New lab dust monitors
Jeff B, Jim, Dave [WP5697]
As part of the install of the new OSB lab dust monitors:
generated new autoBurt.req file. Generated new DAQ EDCU INI file. Recanned conlog against autoBurt.req file.
New GDS version
Jim [WP 5696]:
completed this morning.
Clearing partially loaded filter modules
Was able to do full loads on susbs, susitmx, susitmy, susprm, sussrm. Still have partial loads on lsc, omc, suspr2 and sussr2 which are waiting for the system experts to clear.
DAQ reconfigure
DAQ EDCU was reconfigured for the missing h1tw0 and new DUST channels. Was applied during today's two DAQ restarts.
DAQ Restarts
In both DAQ restarts the dataconcentrator, tw1 and both framewriters started with no issues. In the first restart the broadcaster started by both NDS daqd process were no longer controlled by monit. A simple monit restart of the daqd processes cleared the error. On the second restart the broadcaster started, stopped and later restarted. Again both NDS processes did not start, and when they were restarted they failed. The error was that high dcuid nodes for the Beckhoff SDF system has been mistakenly added to the testpoint.par file, and only the NDS machines objected to this. The file was repaired and monit was able to restart the NDS daqd processes.
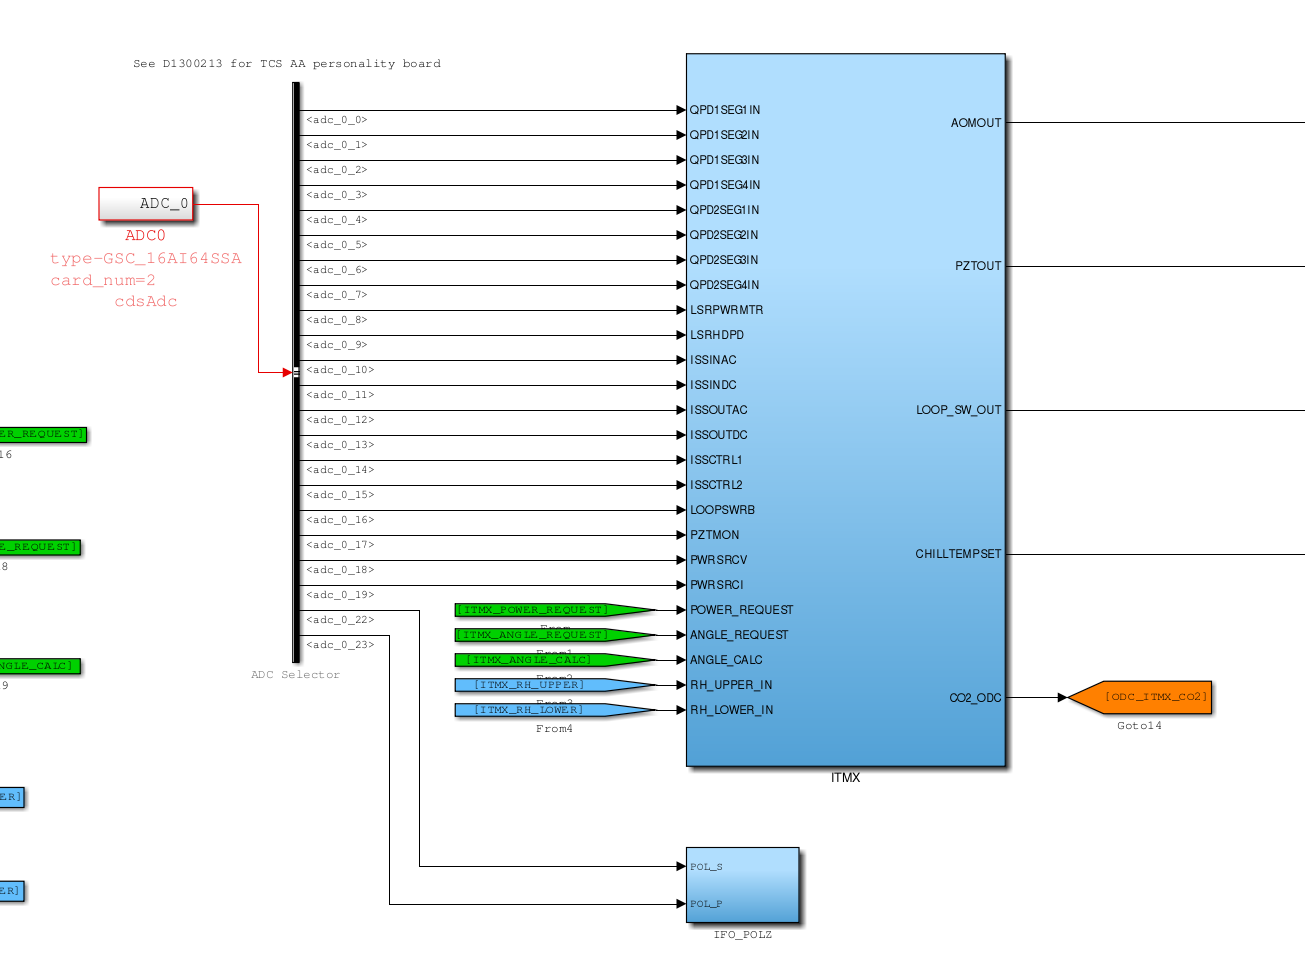
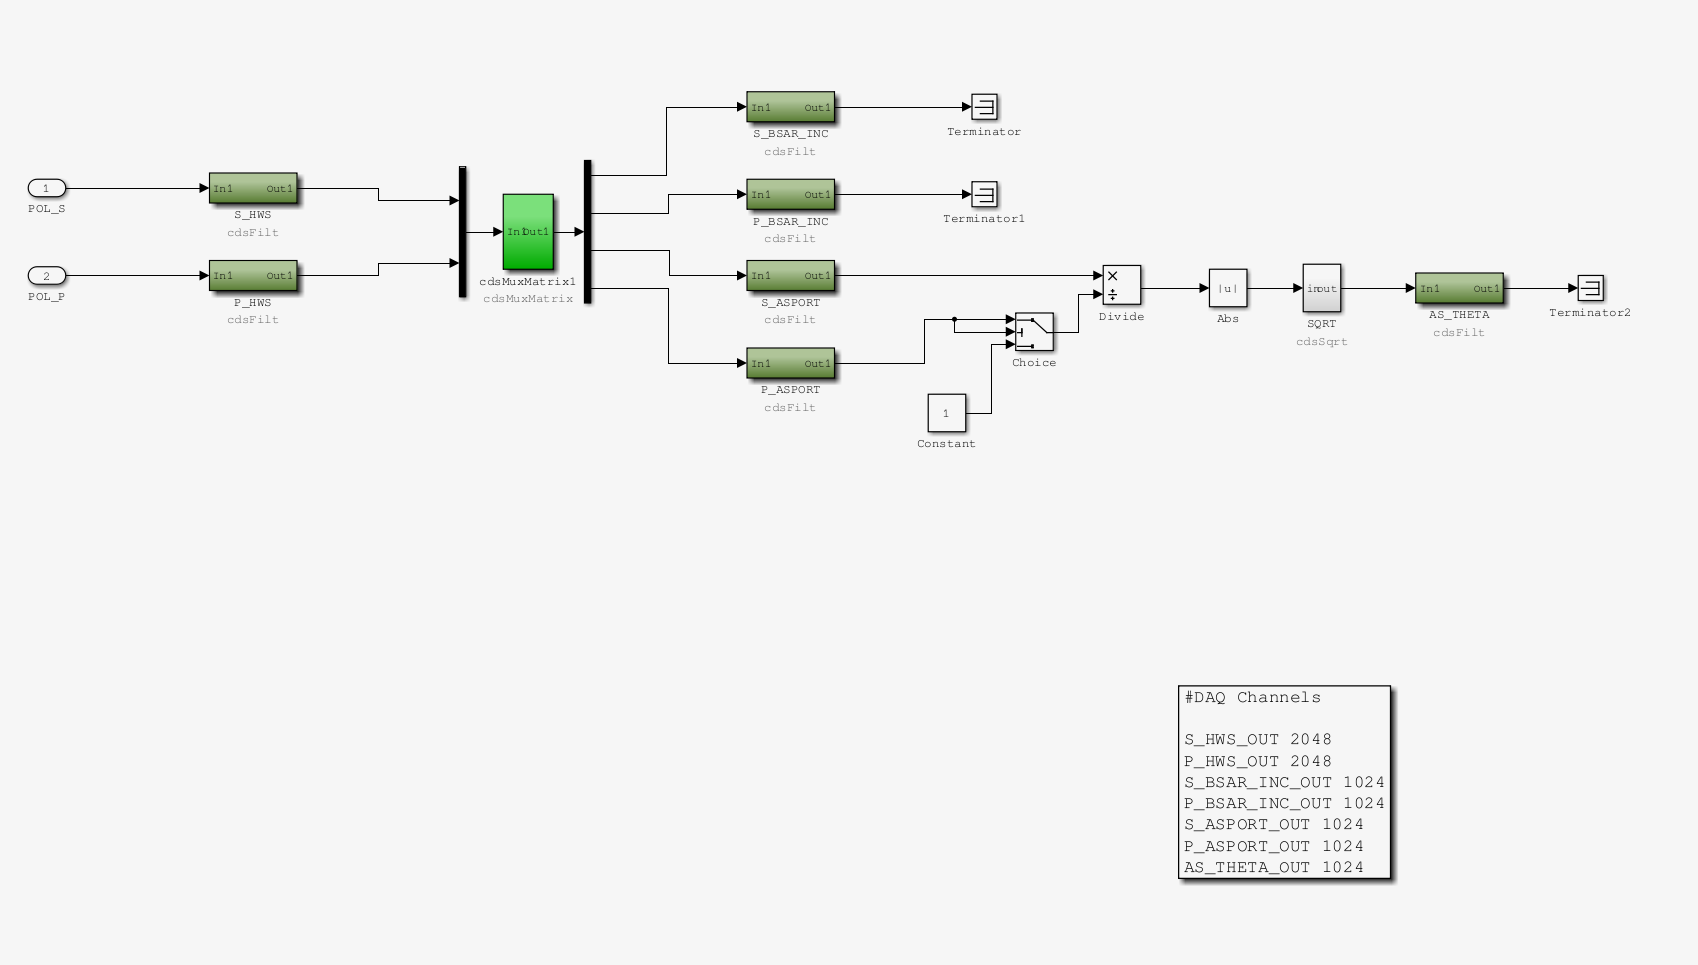
TCS model changes
Aidan and Dave [WP5688]:
Installed new h1tcscs model onto h1oaf0. DAQ was restarted.
New Beckhoff SDF code release
Jonathan [WP5695]:
Jonathan tested the new code on EY Beckhoff. He found an issue with enumerated binaries and backed this version out.
RACCESS monitoring/control of h1hwinj1
Jonathan, Jim, Dave:
Jonathan added the hardware injection machine h1hwinj1 to his RACCESS control system. MEDMs were updated accordingly.
H1OAF change to drive audio in control room
Richard, Evan, Dave [WP5704]:
h1oaf and h1pemcs models were changed to permit oaf to drive the 8th DAC channel of PEM's 18-bit DAC card. This analog signal is then routed from the CER to the control room using the audio channel in the digital video fiber link between the rooms.
New operator table install in the control room
Richard, Carlos, Jim, Dave:
The new powered, adjustable-height operator table was installed in the control room at the operator station. The access control PC, gate cam and alarm machines were shuffled to the left and a new workstation was installed on the new table.
HPI and ISI safe.snap work
Hugh, Dave:
Hugh worked on the safe.snap files for HPI and ISI. I was able to offer some help by creating a new script to convert sub-systems to safe SDF mode and converted all HPI and ISI to safe. Later I converted them back to OBSERVE mode.
New ECAT EPICS channels for corner station
Daniel, Dave:
Daniel made Beckhoff changes in the corner station. I updated the ECAT DAQ INI files and the target autoBurt.req files.
Server patching and rebooting
Carlos, Dave:
Carlos applied security patches and rebooted cdsssh, cdslogin and cdsadminctrl. We restarted the vacuum alarms system on cdslogin.