Summary: most coupling at LHO was measured to be about the same as for the pre-run injections. Magnetic coupling was found to be lower in the CS ebay, and vibration coupling was found to be lower at the PSL periscope and at EX, as we were expecting. Since changes were for the better, we conservatively use the values from the start of the run and nothing has to change in estimates of noise from the environment. I also injected at locations we didn’t reach during the first round; there is low but interesting acoustic coupling at both mid-stations.
We make an abbreviated set of injections at the end of the run in case coupling changed after the pre-run injections (link to pre-run injection summary: Link). We made at least one magnetic and one acoustic injection in the LVEA, the 3 electronics bays, the two VEAs and the PSL. These were designed to show if any coupling changed significantly, in which case we would investigate using further injections. For O1 end-of-run injections, all significant changes were improvements, so we change no estimates, and do not alter the coupling functions and estimated ambient levels from the beginning of the run.
In addition, we made several injections that were planned but that we did not get to in the September round. These included shaking of ETMX and Y, and of the beam tube at the mid station.
Vibration coupling at mid-station
The smallest clear aperture in the beam tube between the corner and end stations is associated with the mid-station cryopumps. For this reason, the beam tube is instrumented with accelerometers at the mid-stations. We first injected at the mid-station during the current round of PEM injections because of time limitations during the first round.
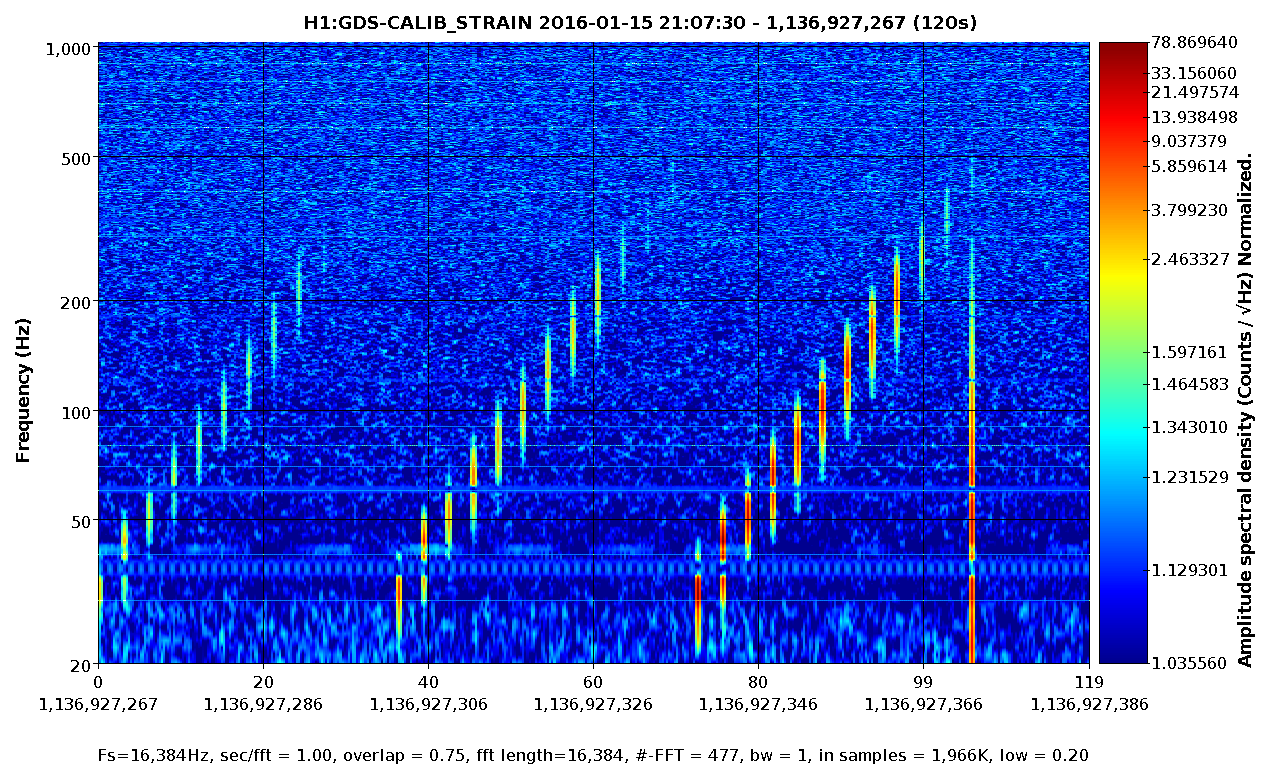
Shaker sweeps on the beam tubes revealed several sensitive frequencies, possibly resonances of scattering structures. Figure 1 shows a comb injection at MX with one of the lines centered on a putative resonance. The feature in DARM has the side-band structure that is typically produced by scattering coupling. The acoustic line at 130 Hz is about 3 orders of magnitude above background, which was also the approximate excitation level needed to produce features in DARM at several other frequencies at MX (250, 315 & 170 Hz) and MY (150 Hz).
While the normal acoustic levels at the mid stations are not a problem, it is not difficult to increase the sound pressure level by 3 orders of magnitude. A loud bang in a mid-station VEA may show in DARM, as might bumping into the beam tube. I suggest that we emphasize that when we are in observation mode, we record in the log when people are working in the VEAs at the mid stations.
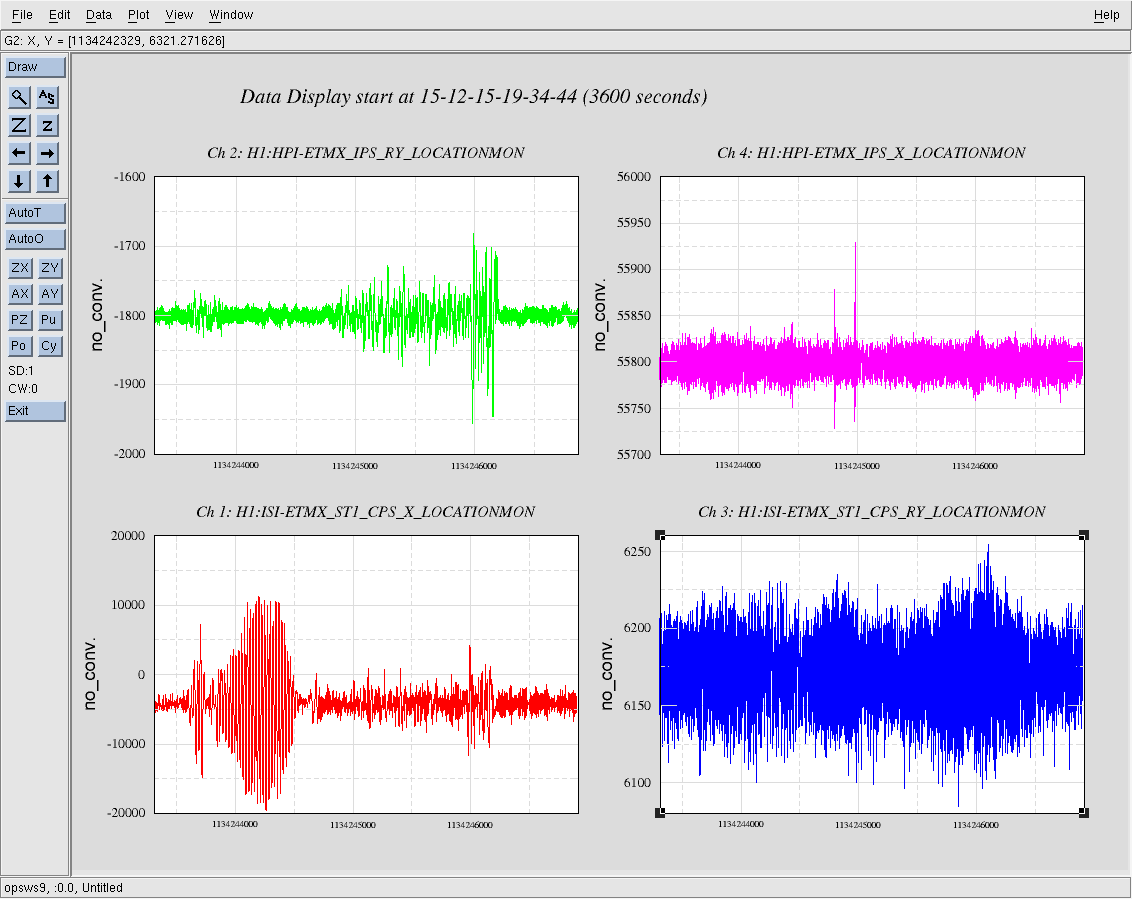
Shaking of ETMX and Y
I used piezo shakers mounted on the blue cross beams of the ETM BSCs. This increased the amplitude of motion by about 2 orders of magnitude between about 100 and 1800 Hz. No effect was noted in DARM.
Reduced magnetic coupling in CS electronics bay.
For pre-O1 PEM injections, the only magnetic coupling that would prevent us from reaching our sensitivity goals was magnetic coupling in the corner station electronics bay (Link). The coupling function was not the highest, but in combination with the high magnetic noise level in the ebay, the pre-O1 coupling would limit us to about 1e-18m/sqrt(Hz) at 12 Hz. However, Figure 2 shows that this coupling was found to be greatly reduced during the post-O1 injections. It is not clear when this improvement was made, but Richard remembered several activities in the ebay that could have improved cable shield connections etc., during the two weeks between when the measurements were made and the start of the run.
Reduced acoustic coupling at EX.
We expected that the high acoustic coupling measured at EX (Link) would be reduced when the beam diverter was finally closed (Link) on Oct. 6. Post run injections showed that it was indeed reduced by a factor of about 5 in the 50-120 Hz region.
Reduced coupling at PSL
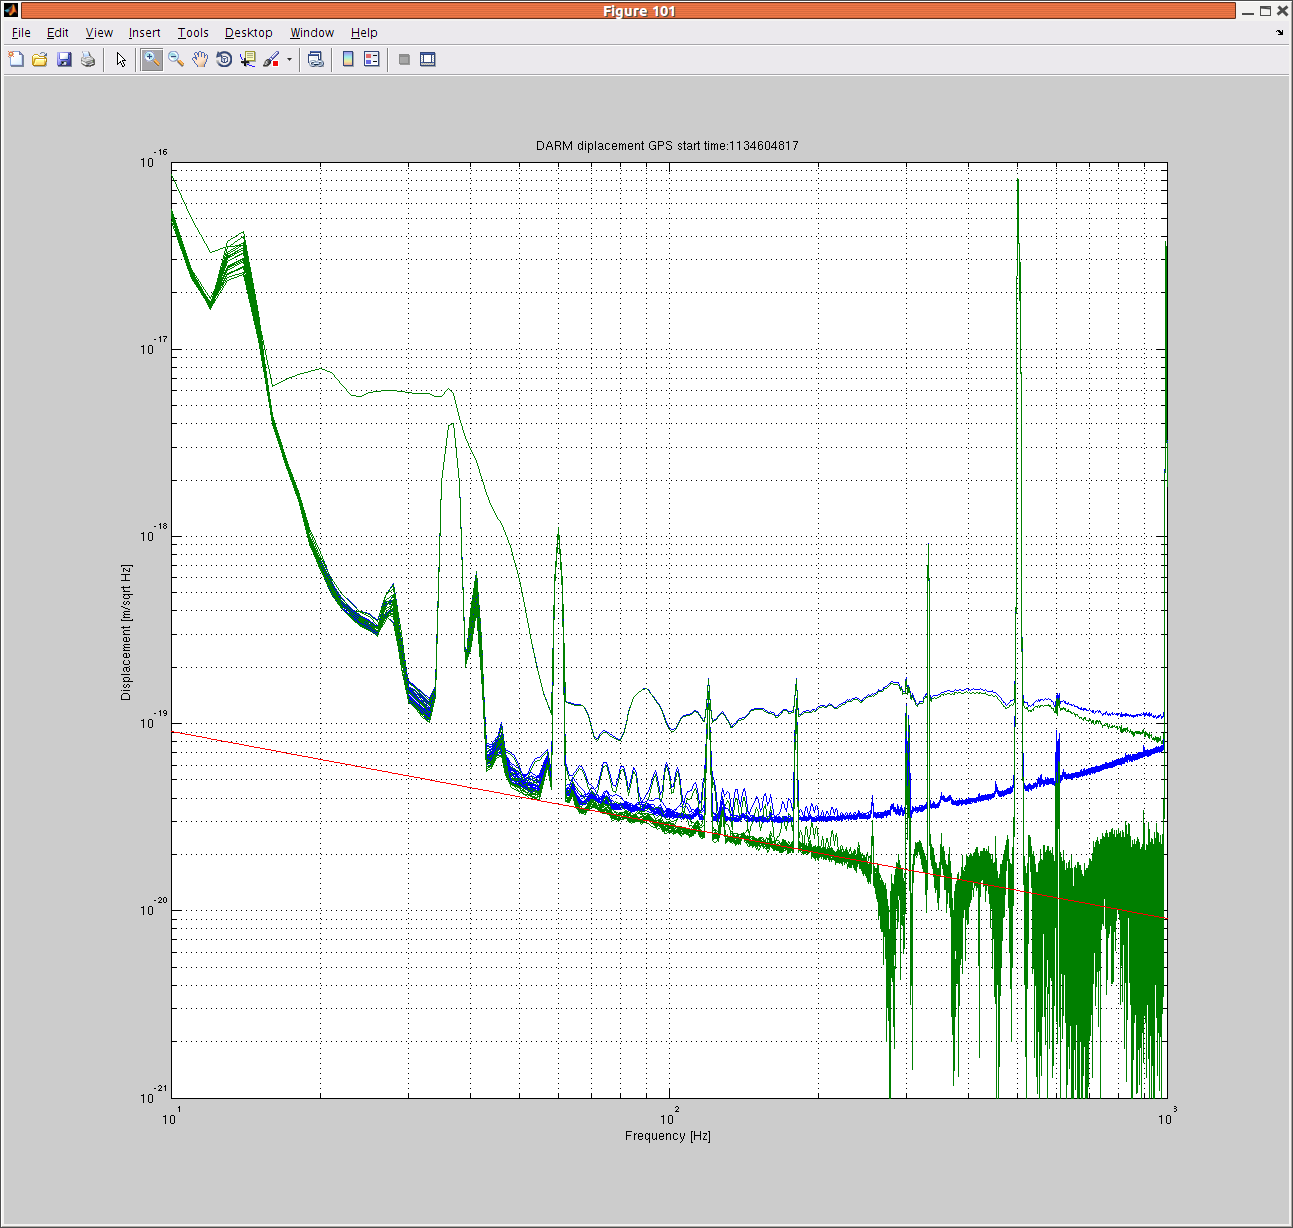
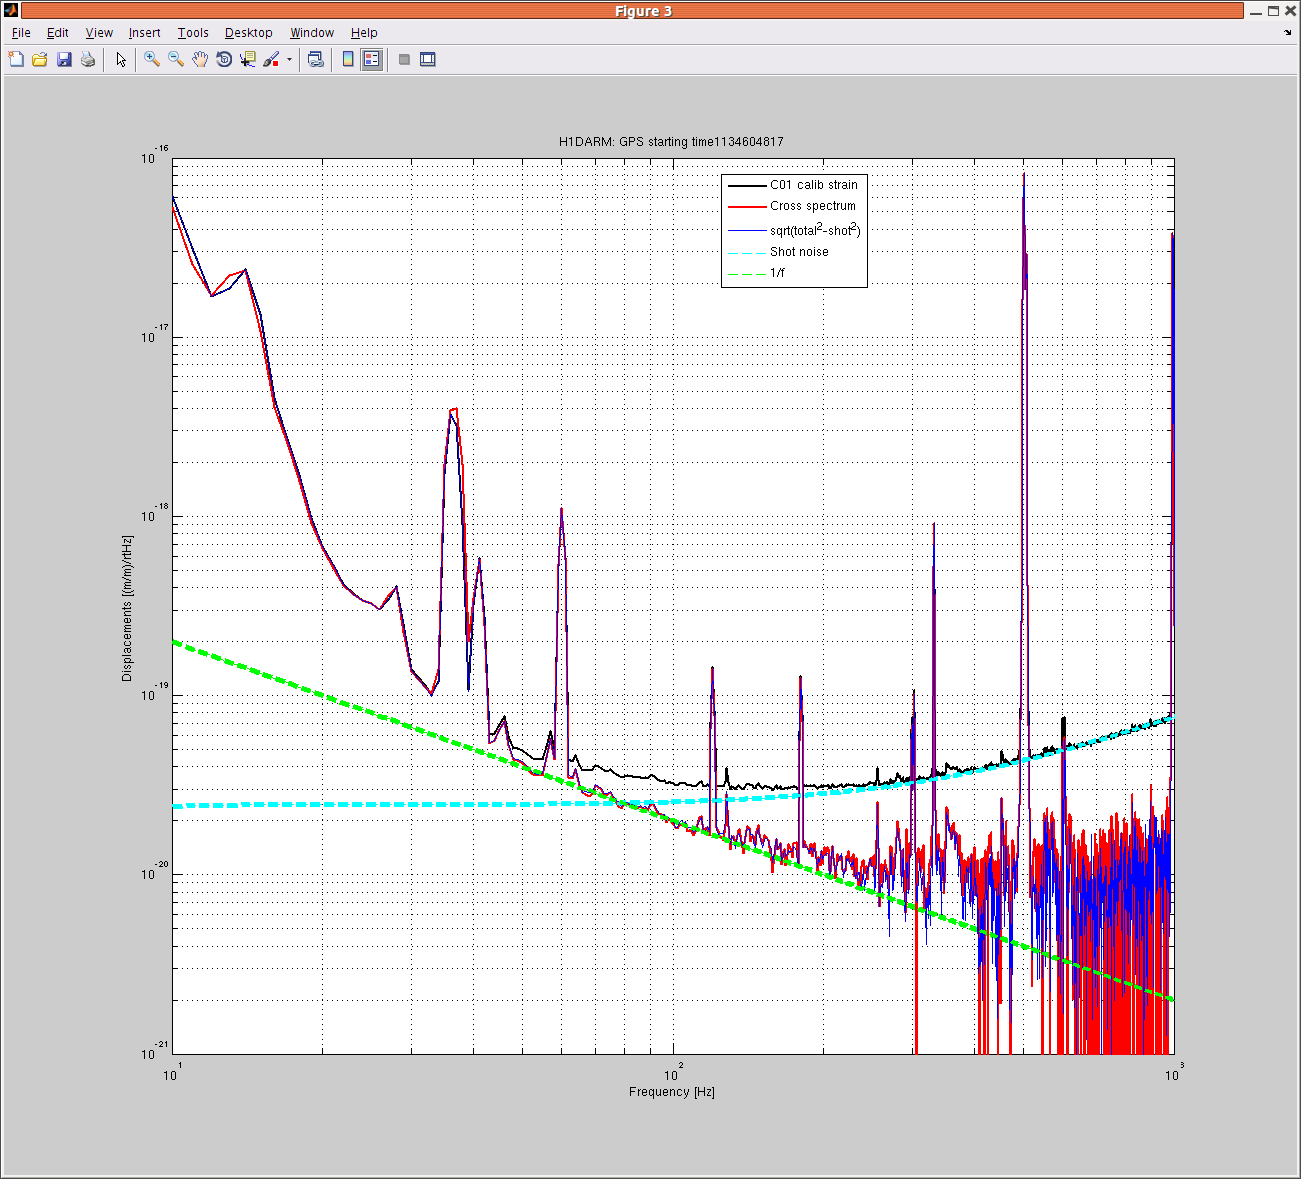
The coupling in the PSL was changed Oct. 13 2015 when I epoxied the top mount on the periscope and fine tuned the peak frequencies using weights. This removed peaks around 300 Hz from DARM (Link). Figure 3 shows the new estimated levels of ambient noise. One peak is very near showing in DARM, but we hope that reductions in jitter coupling, towards the level at LLO, will keep this from limiting us.