betsy.weaver@LIGO.ORG - posted 14:53, Friday 08 January 2016 (24776)
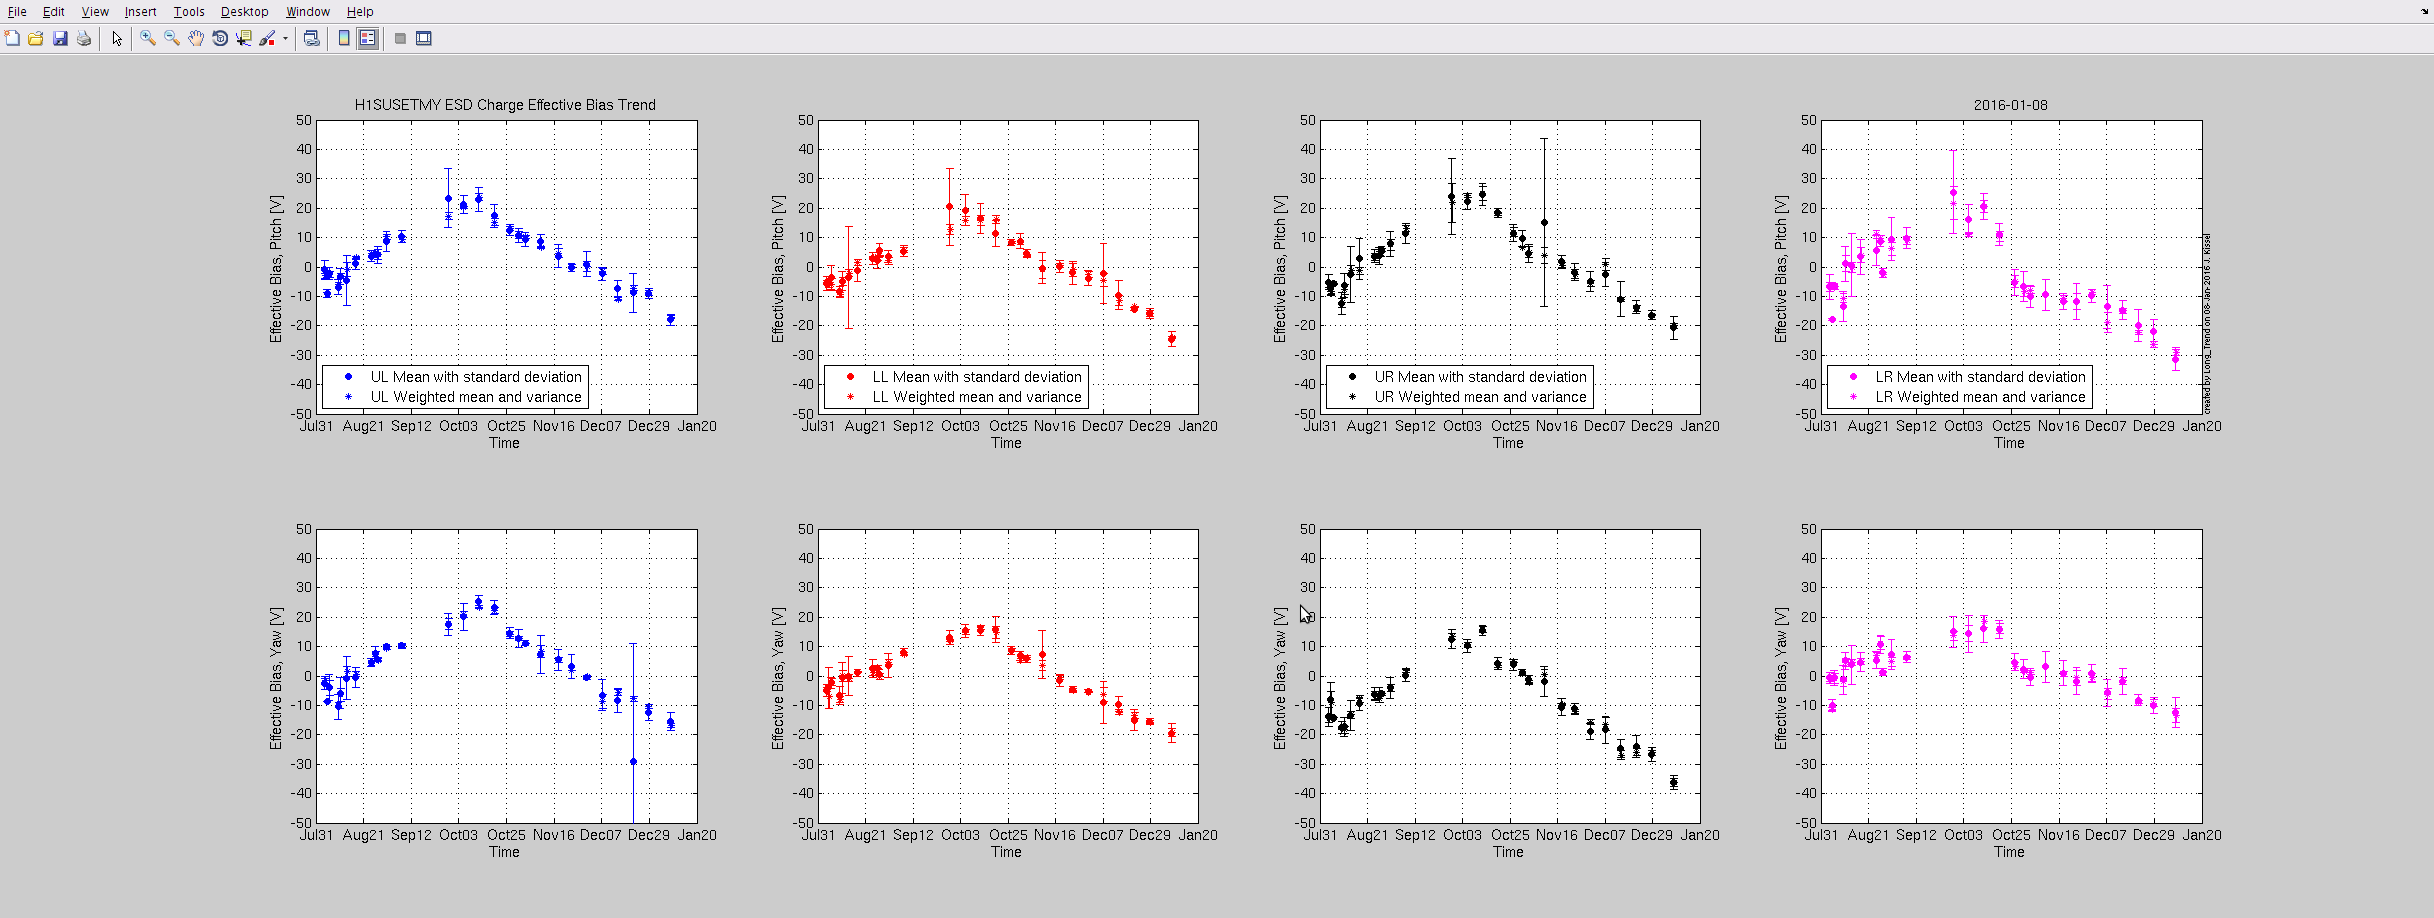
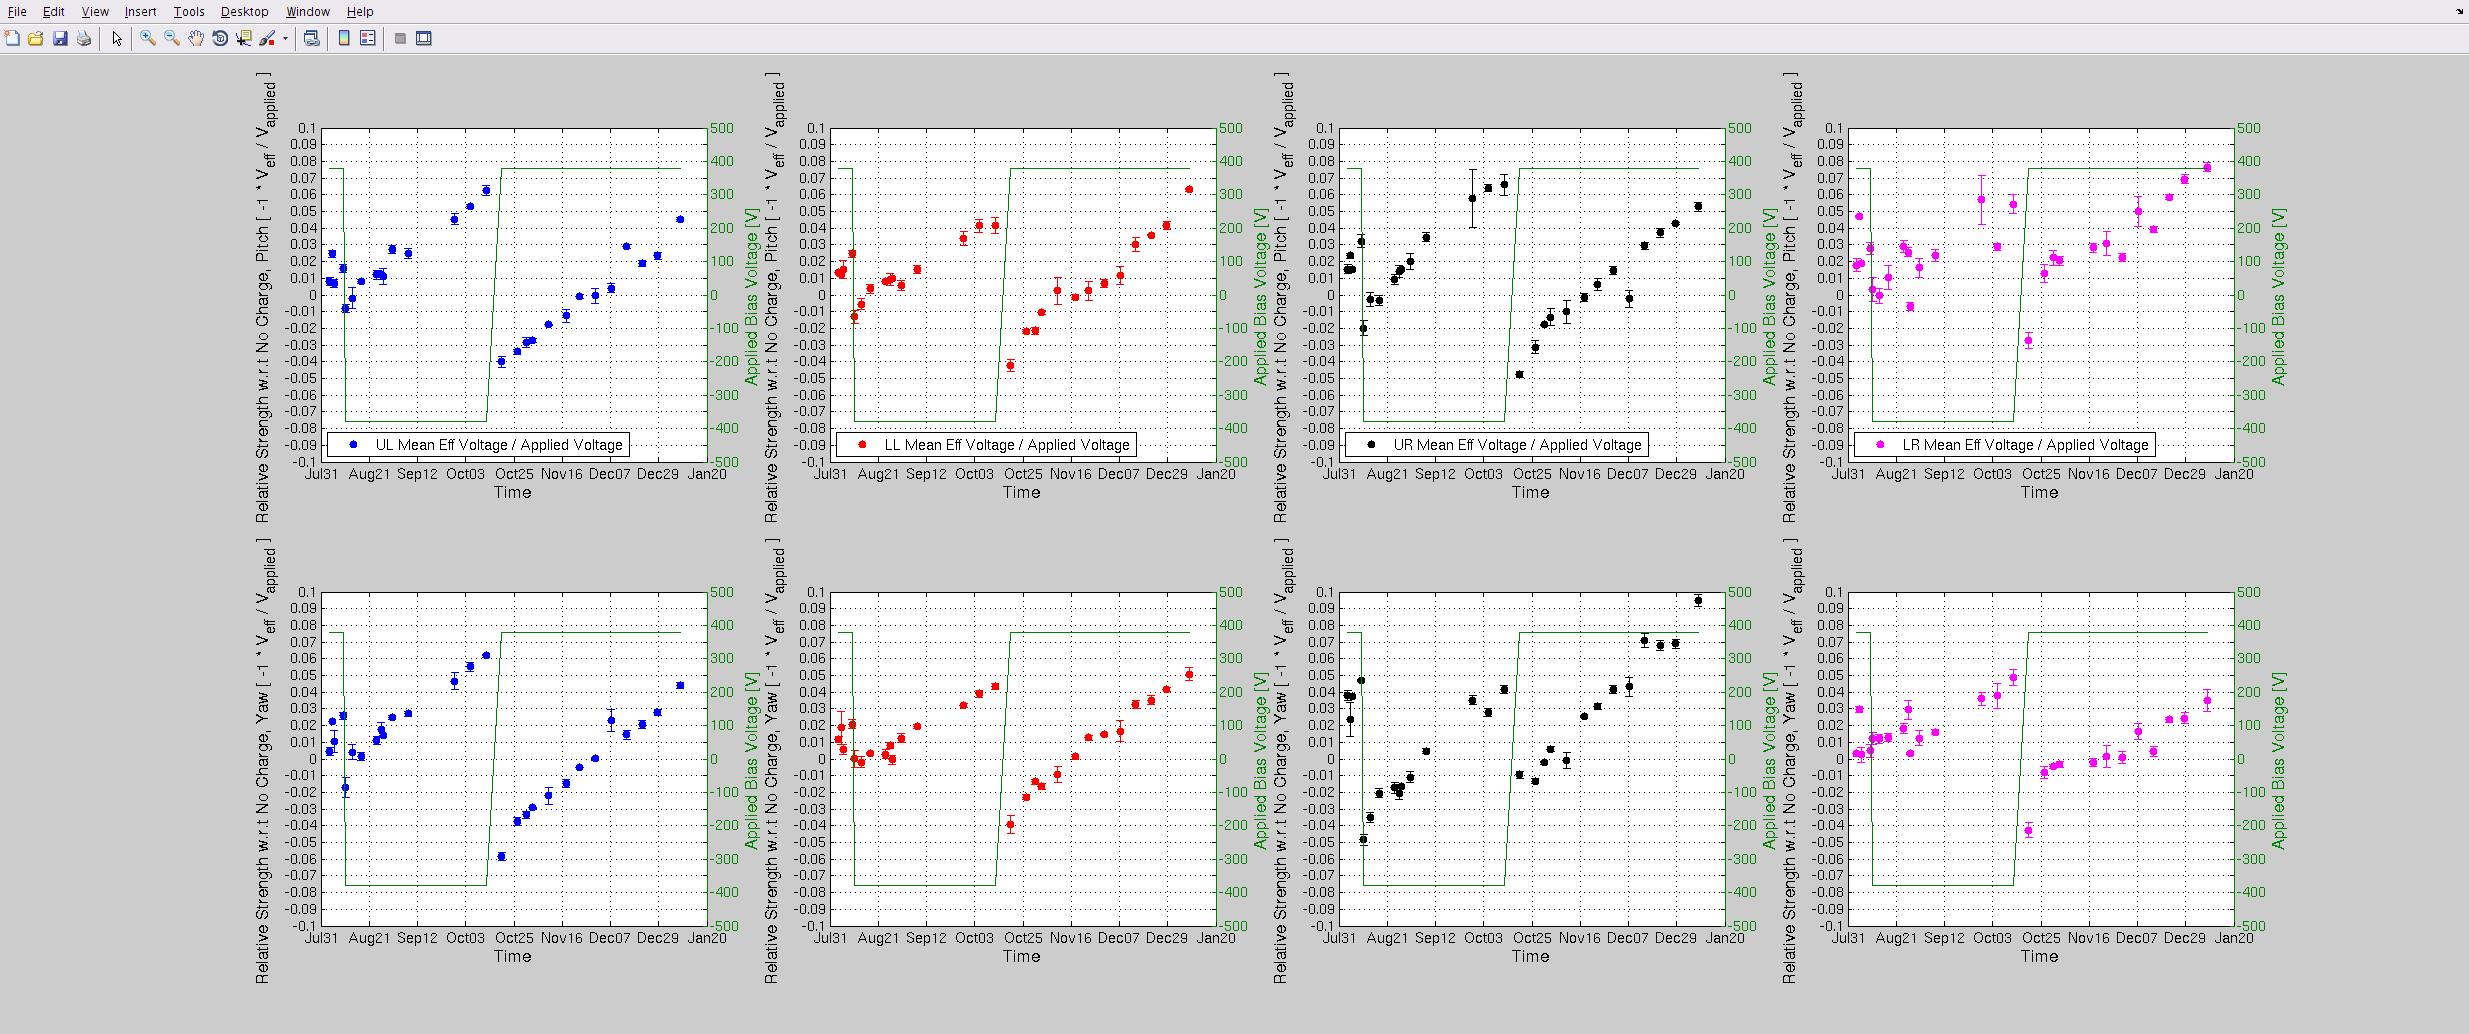
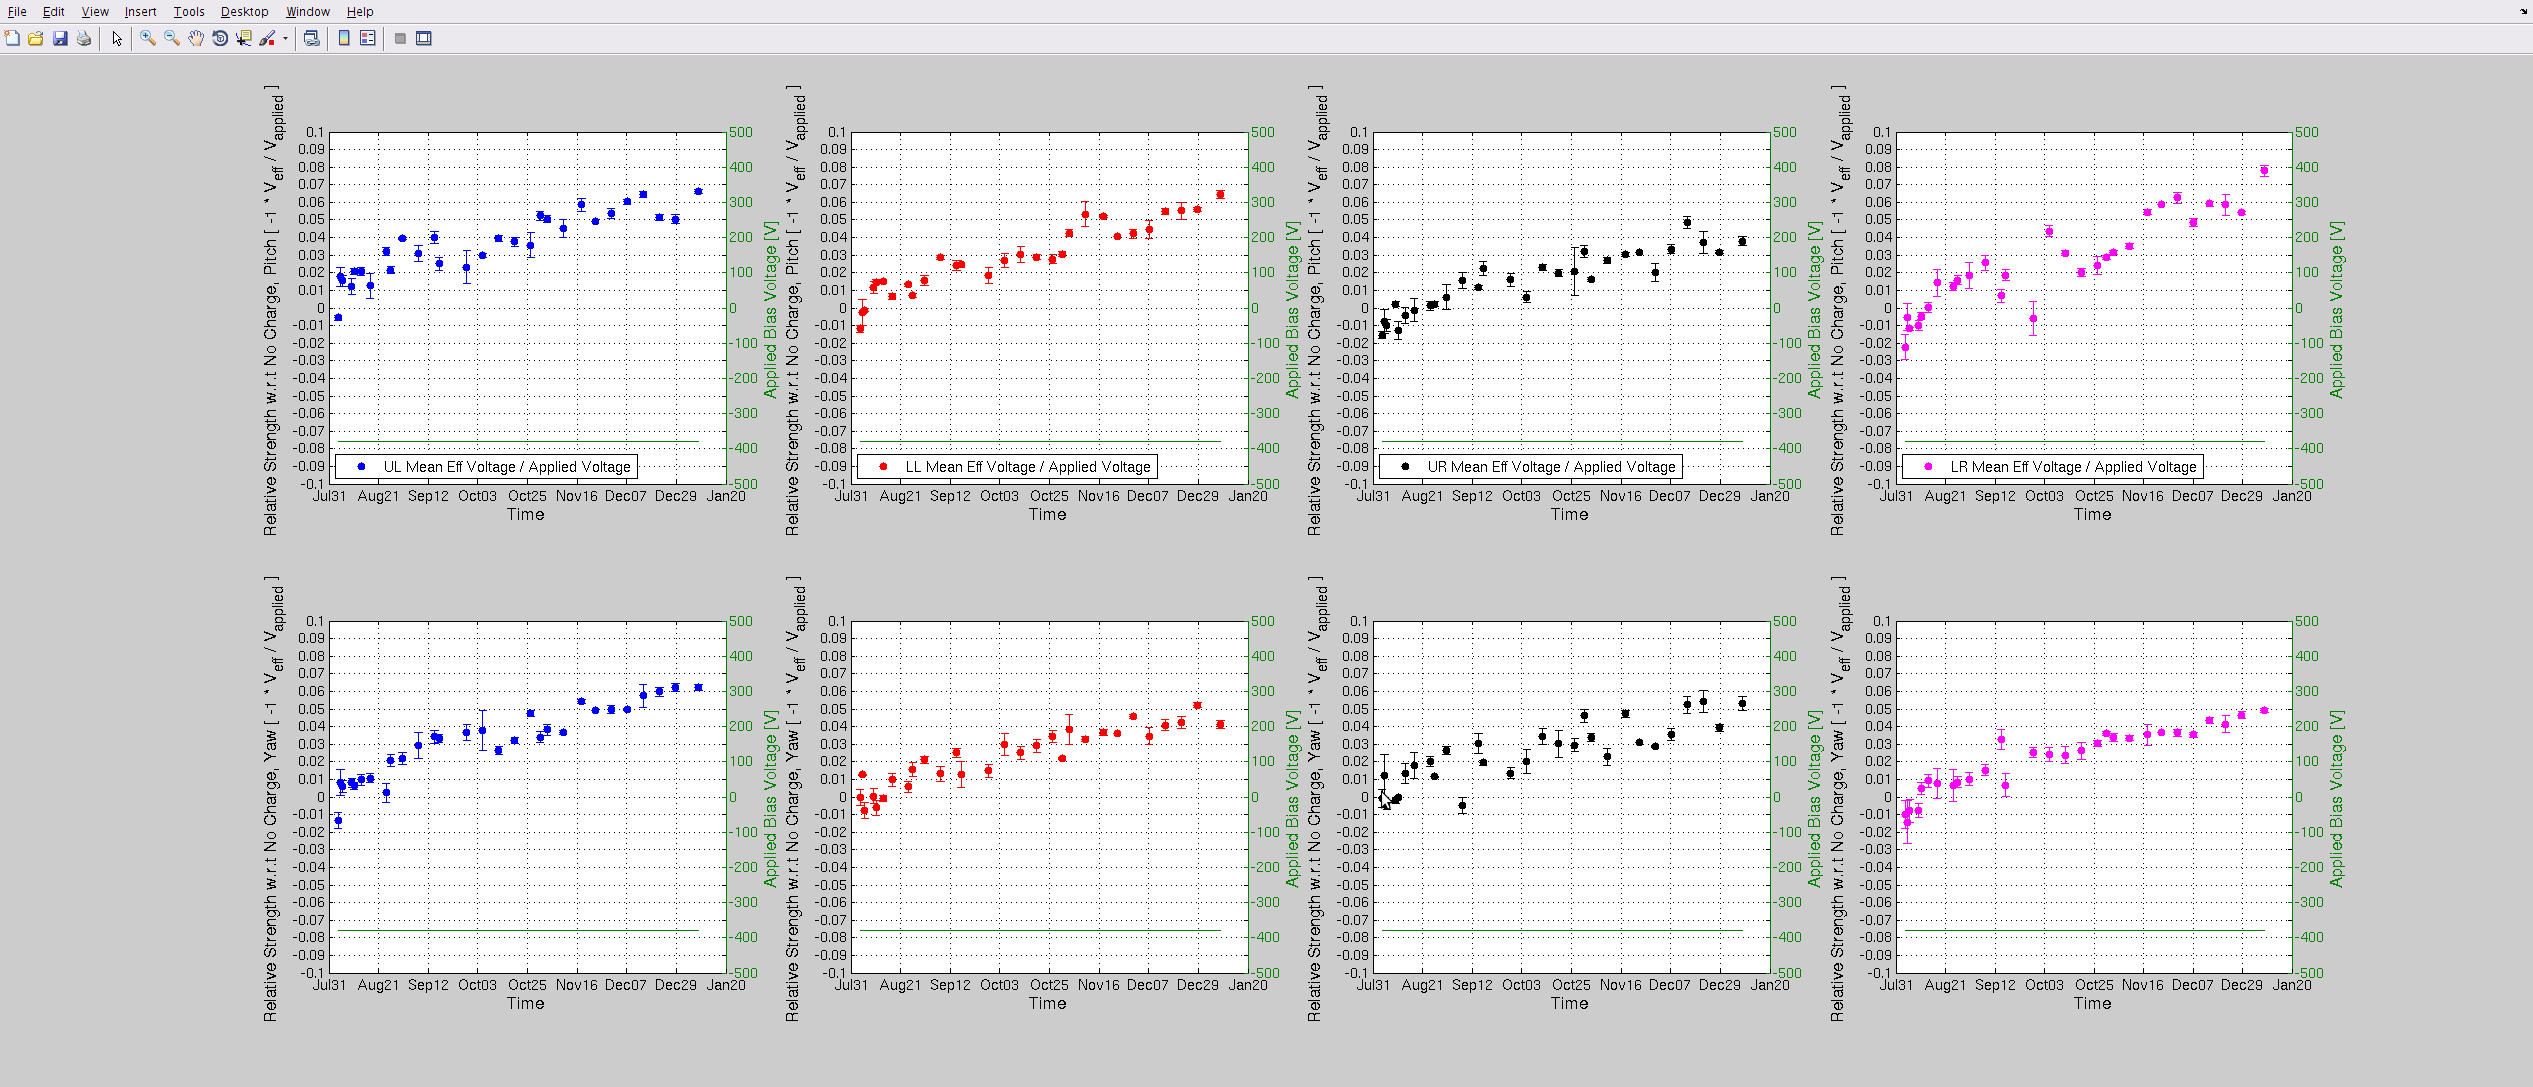
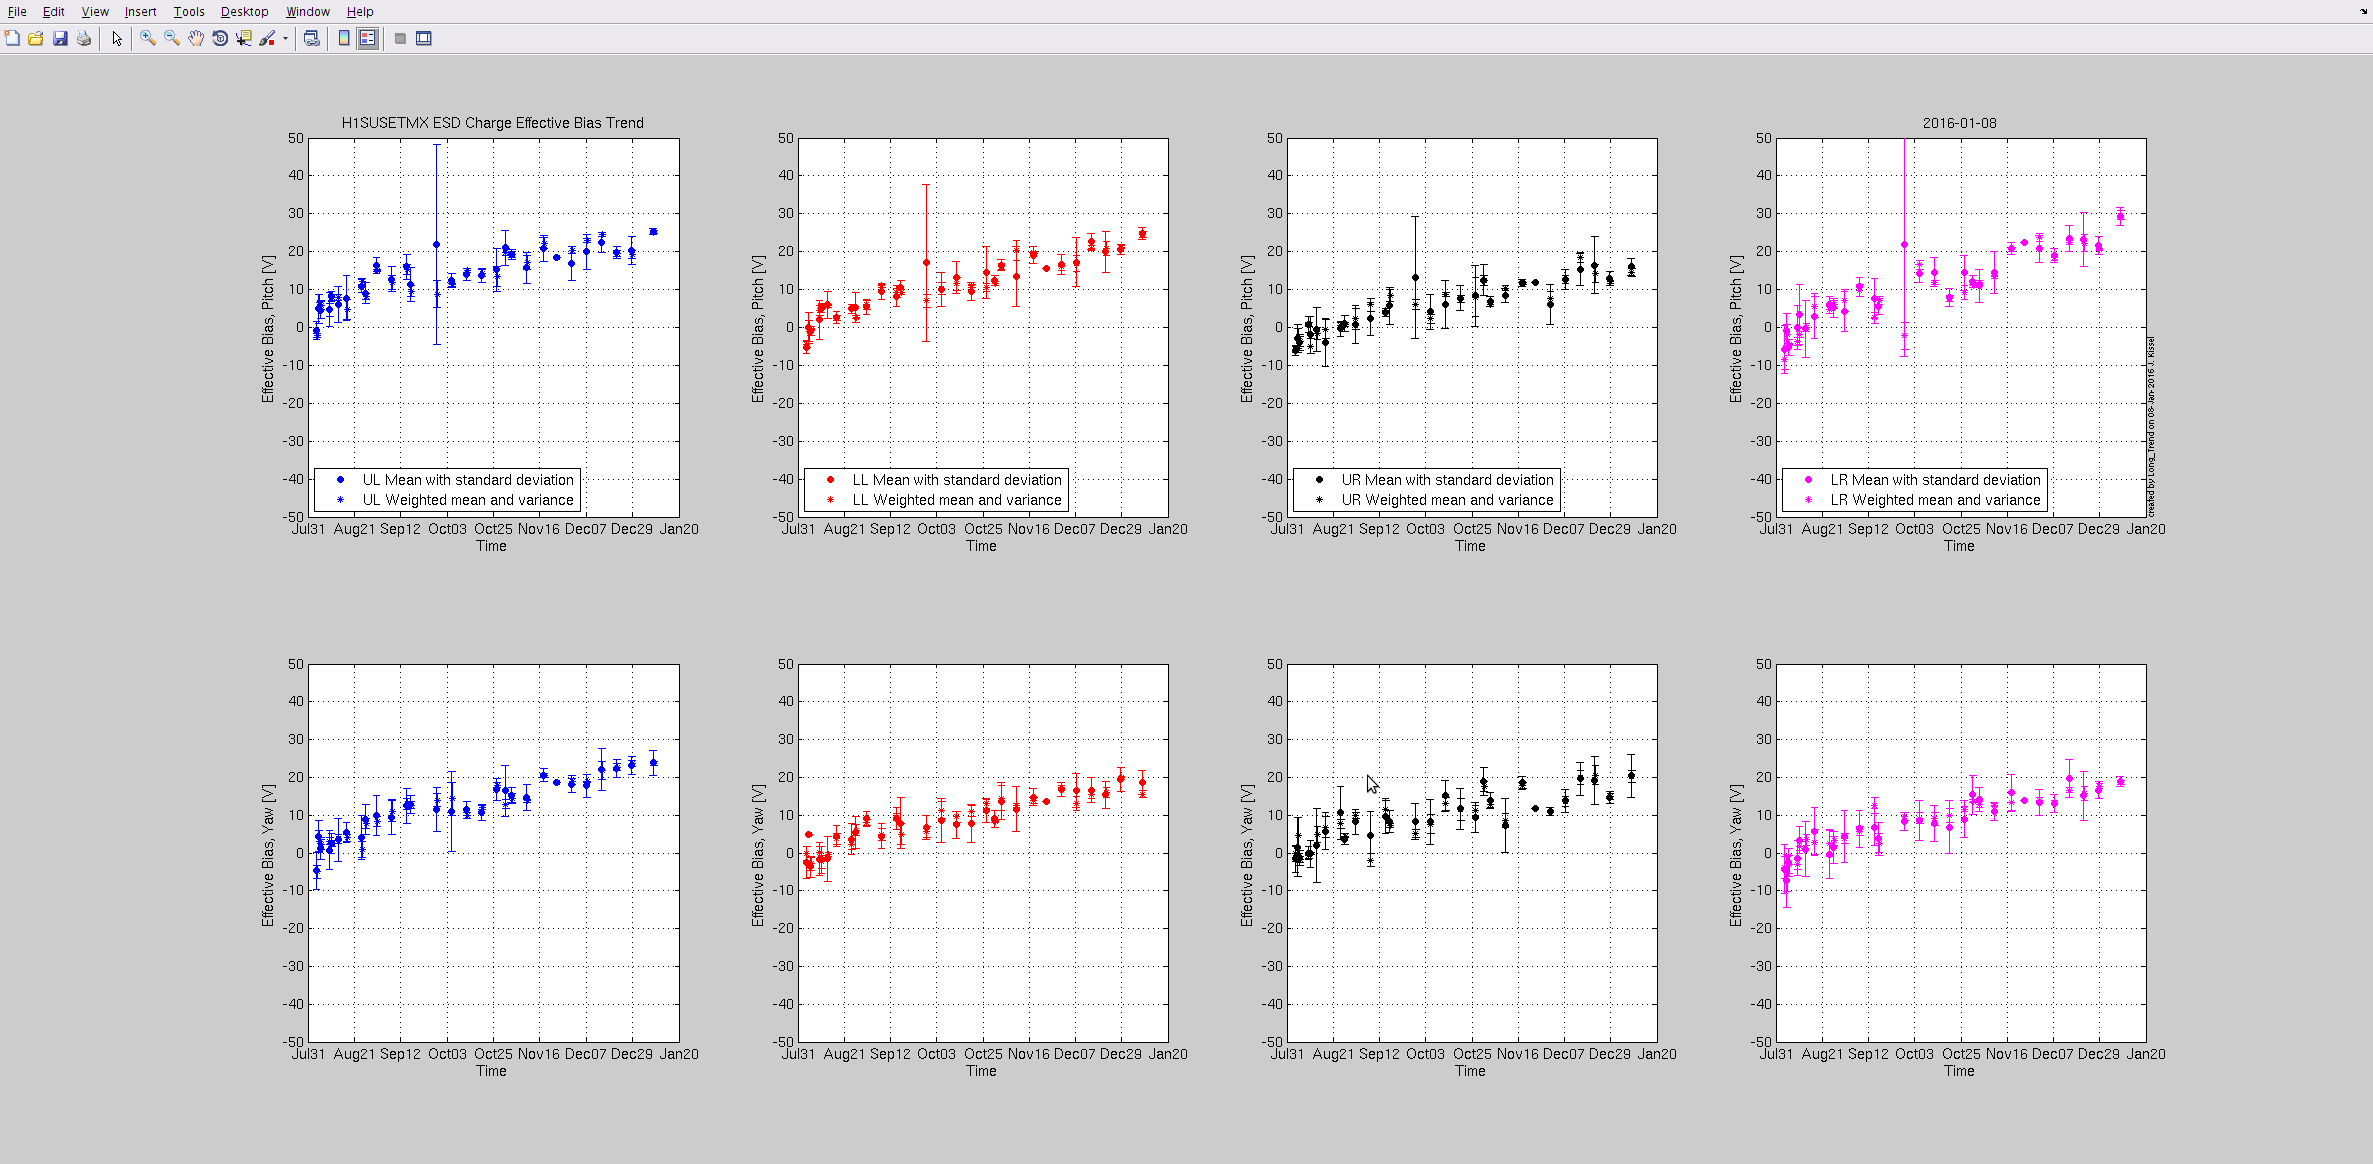
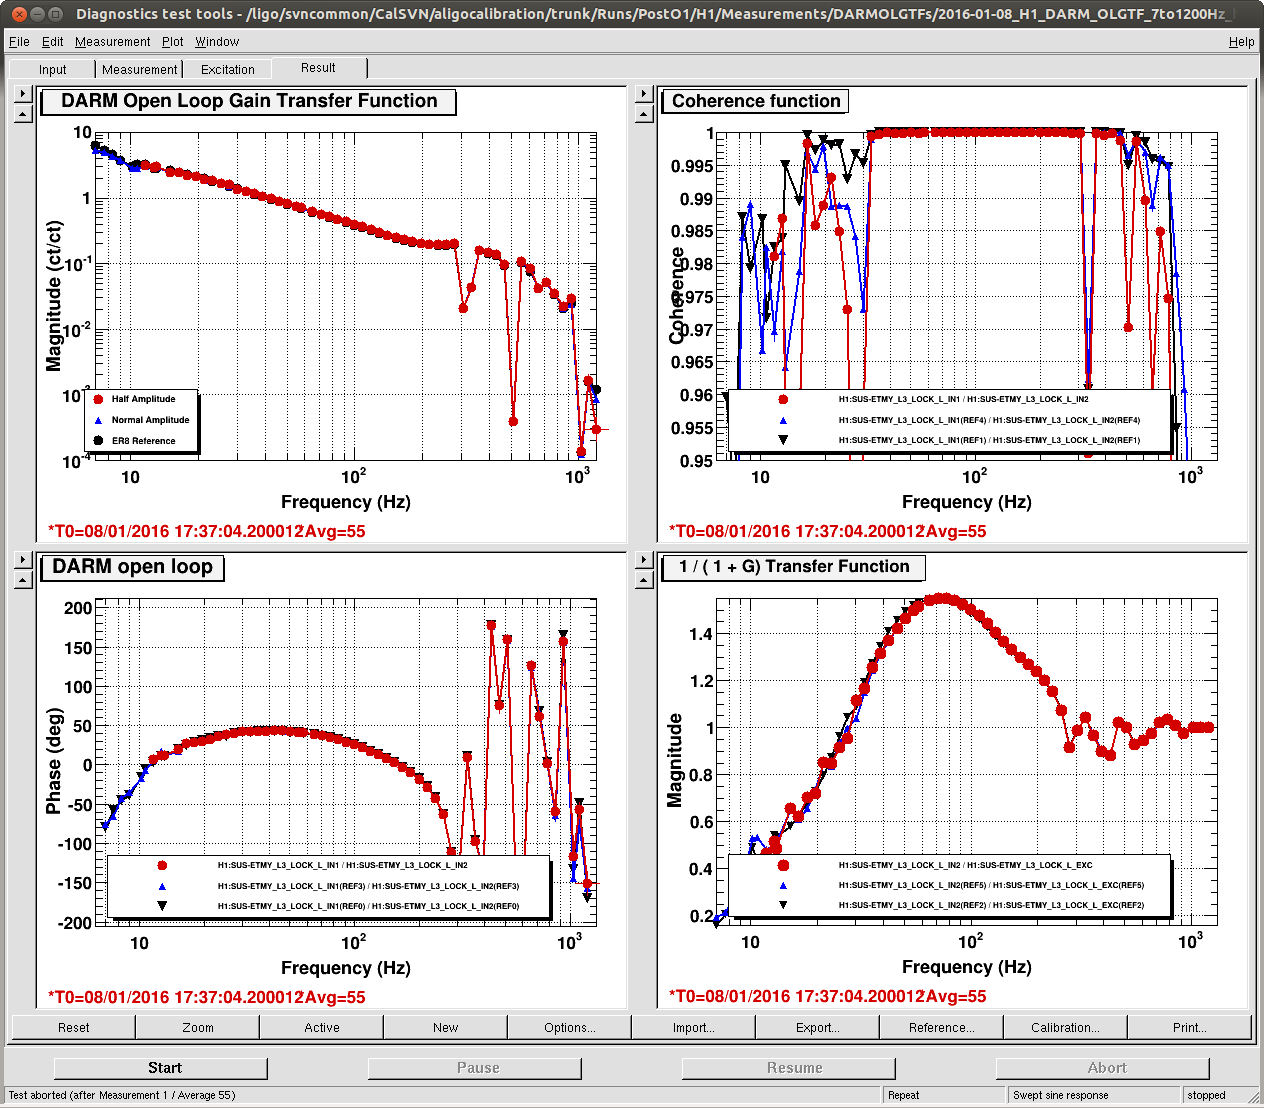
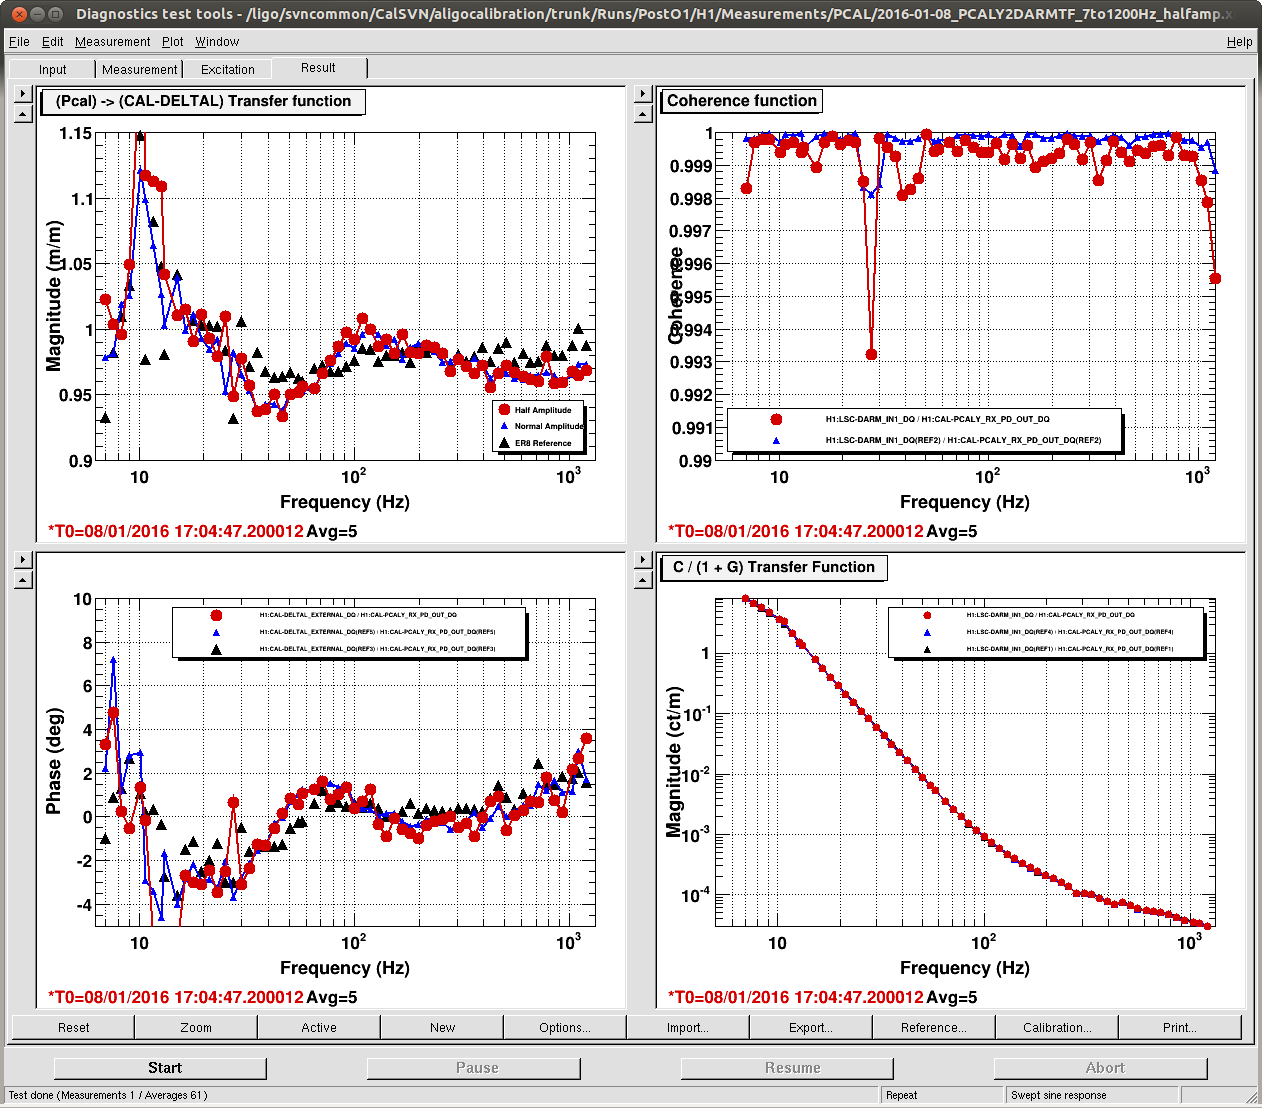
Weekly ETM charge measurements
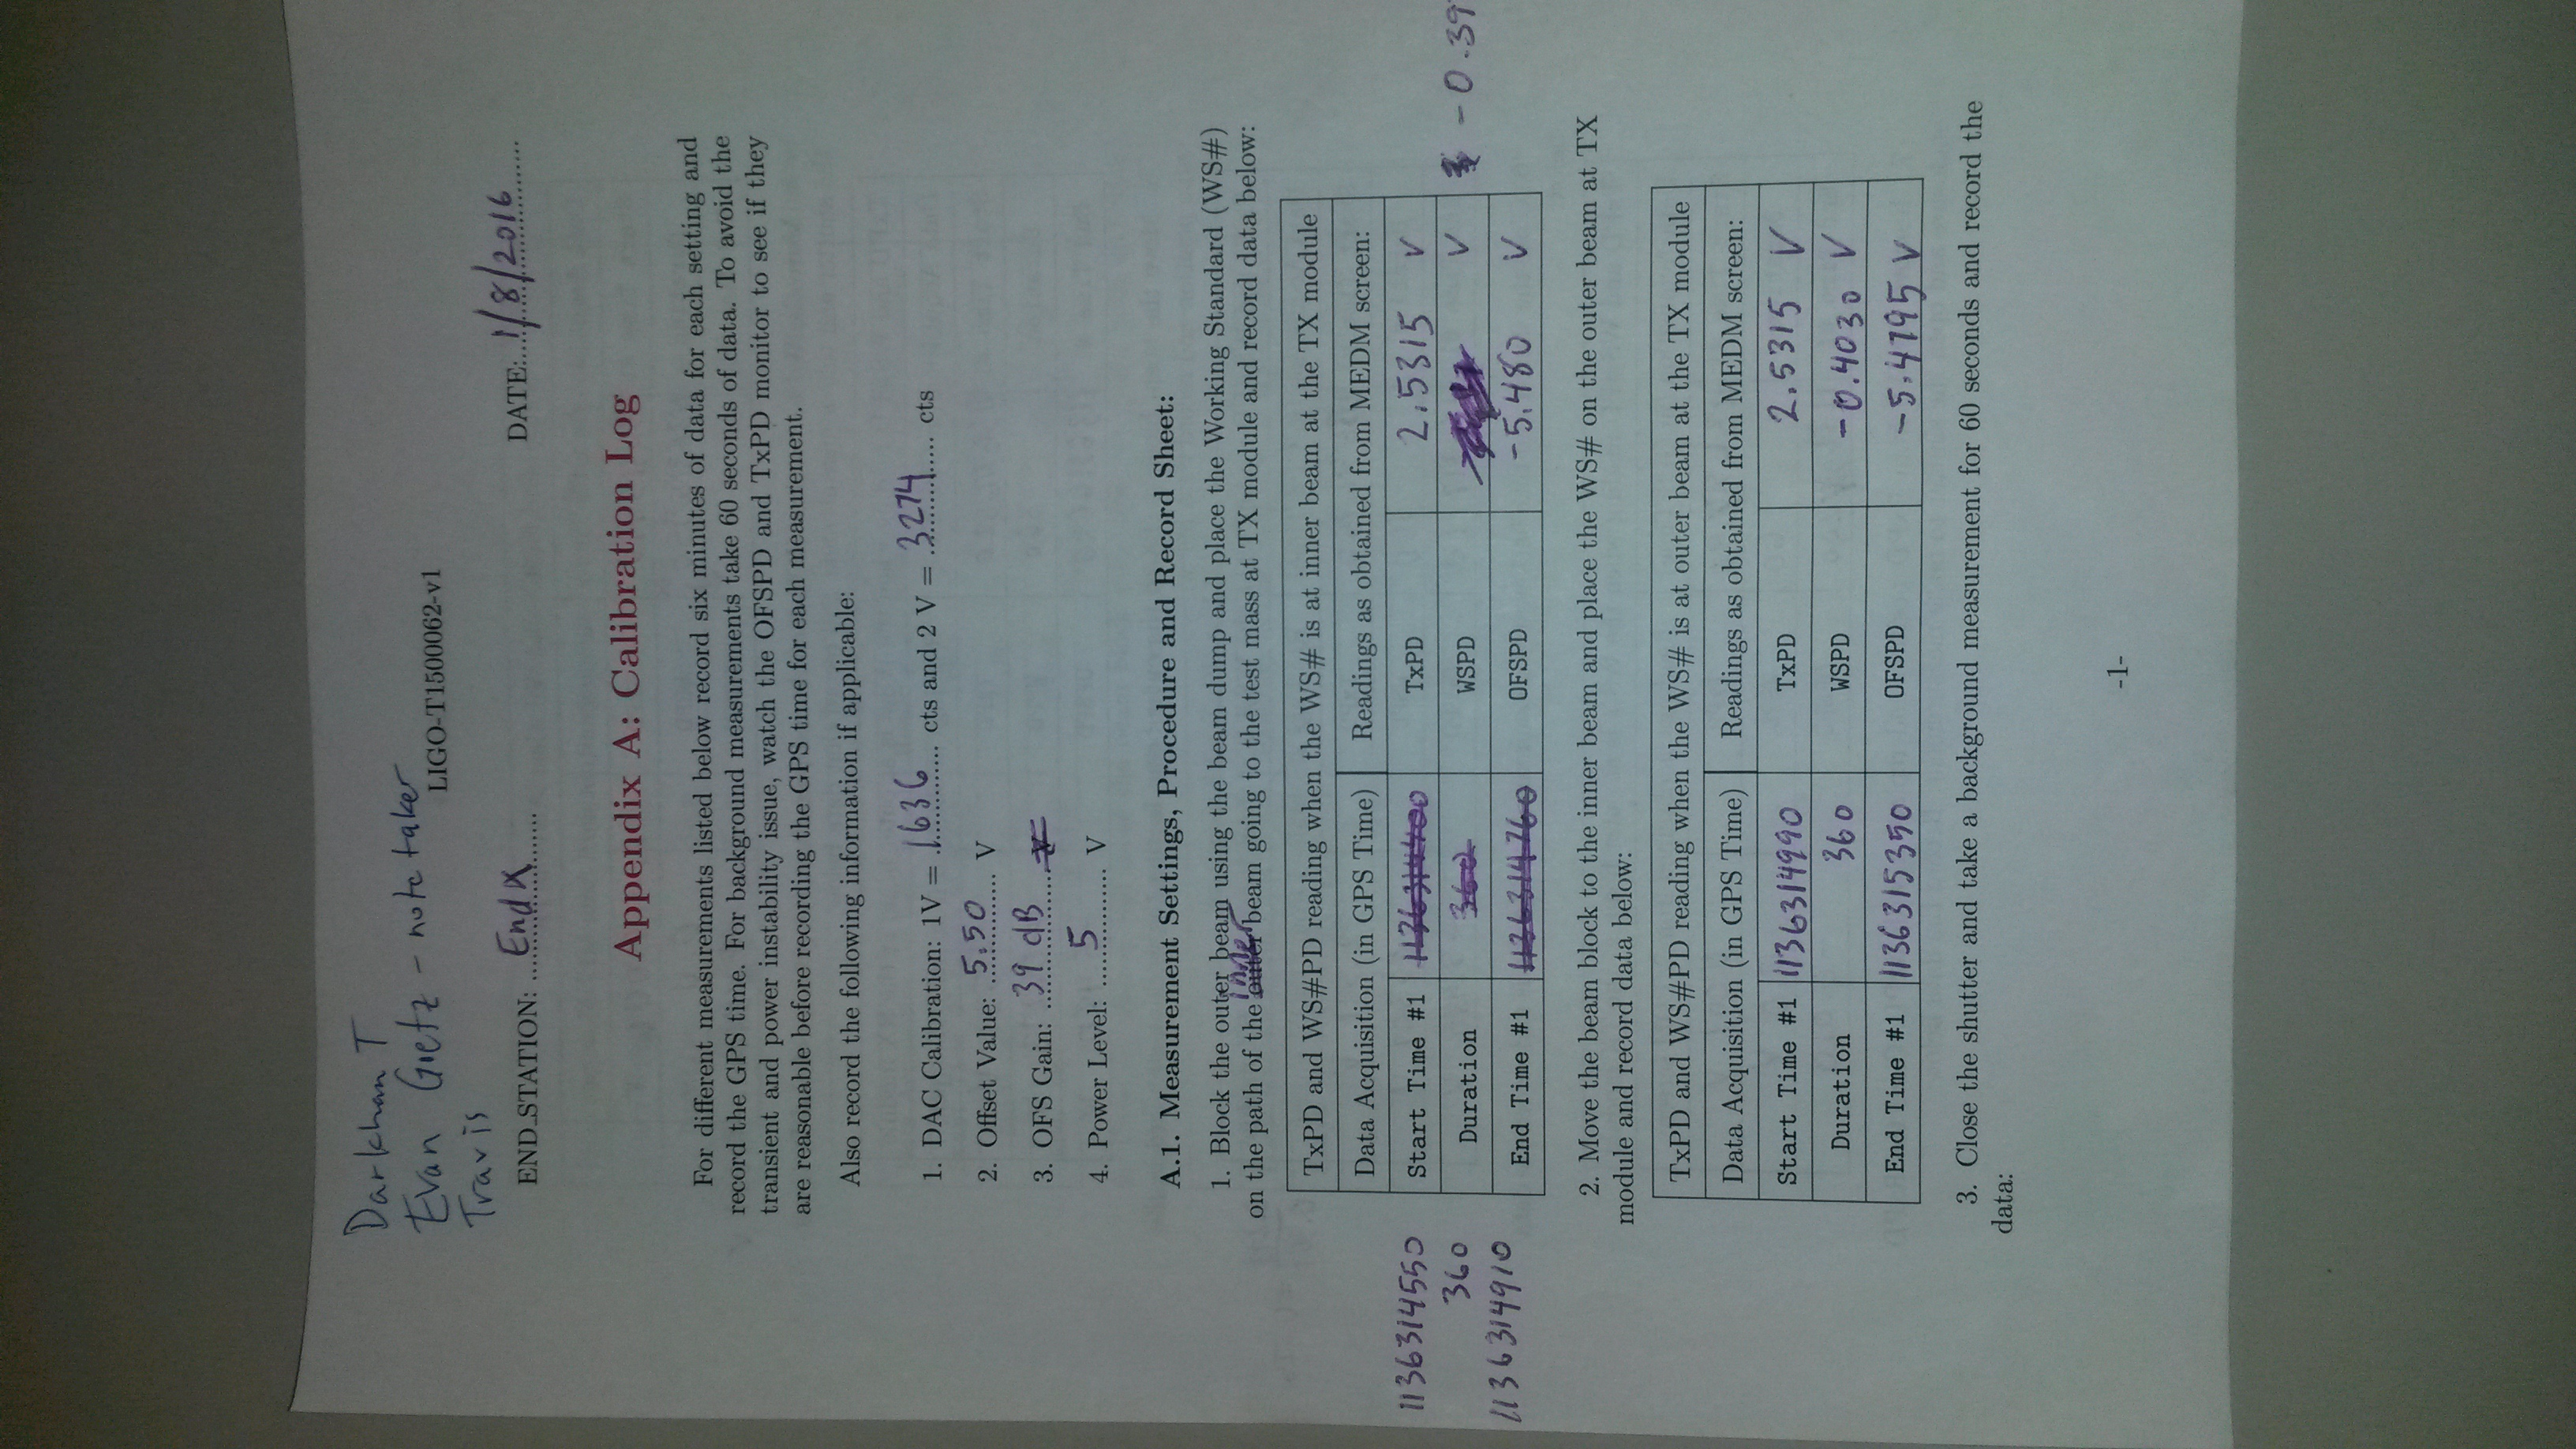
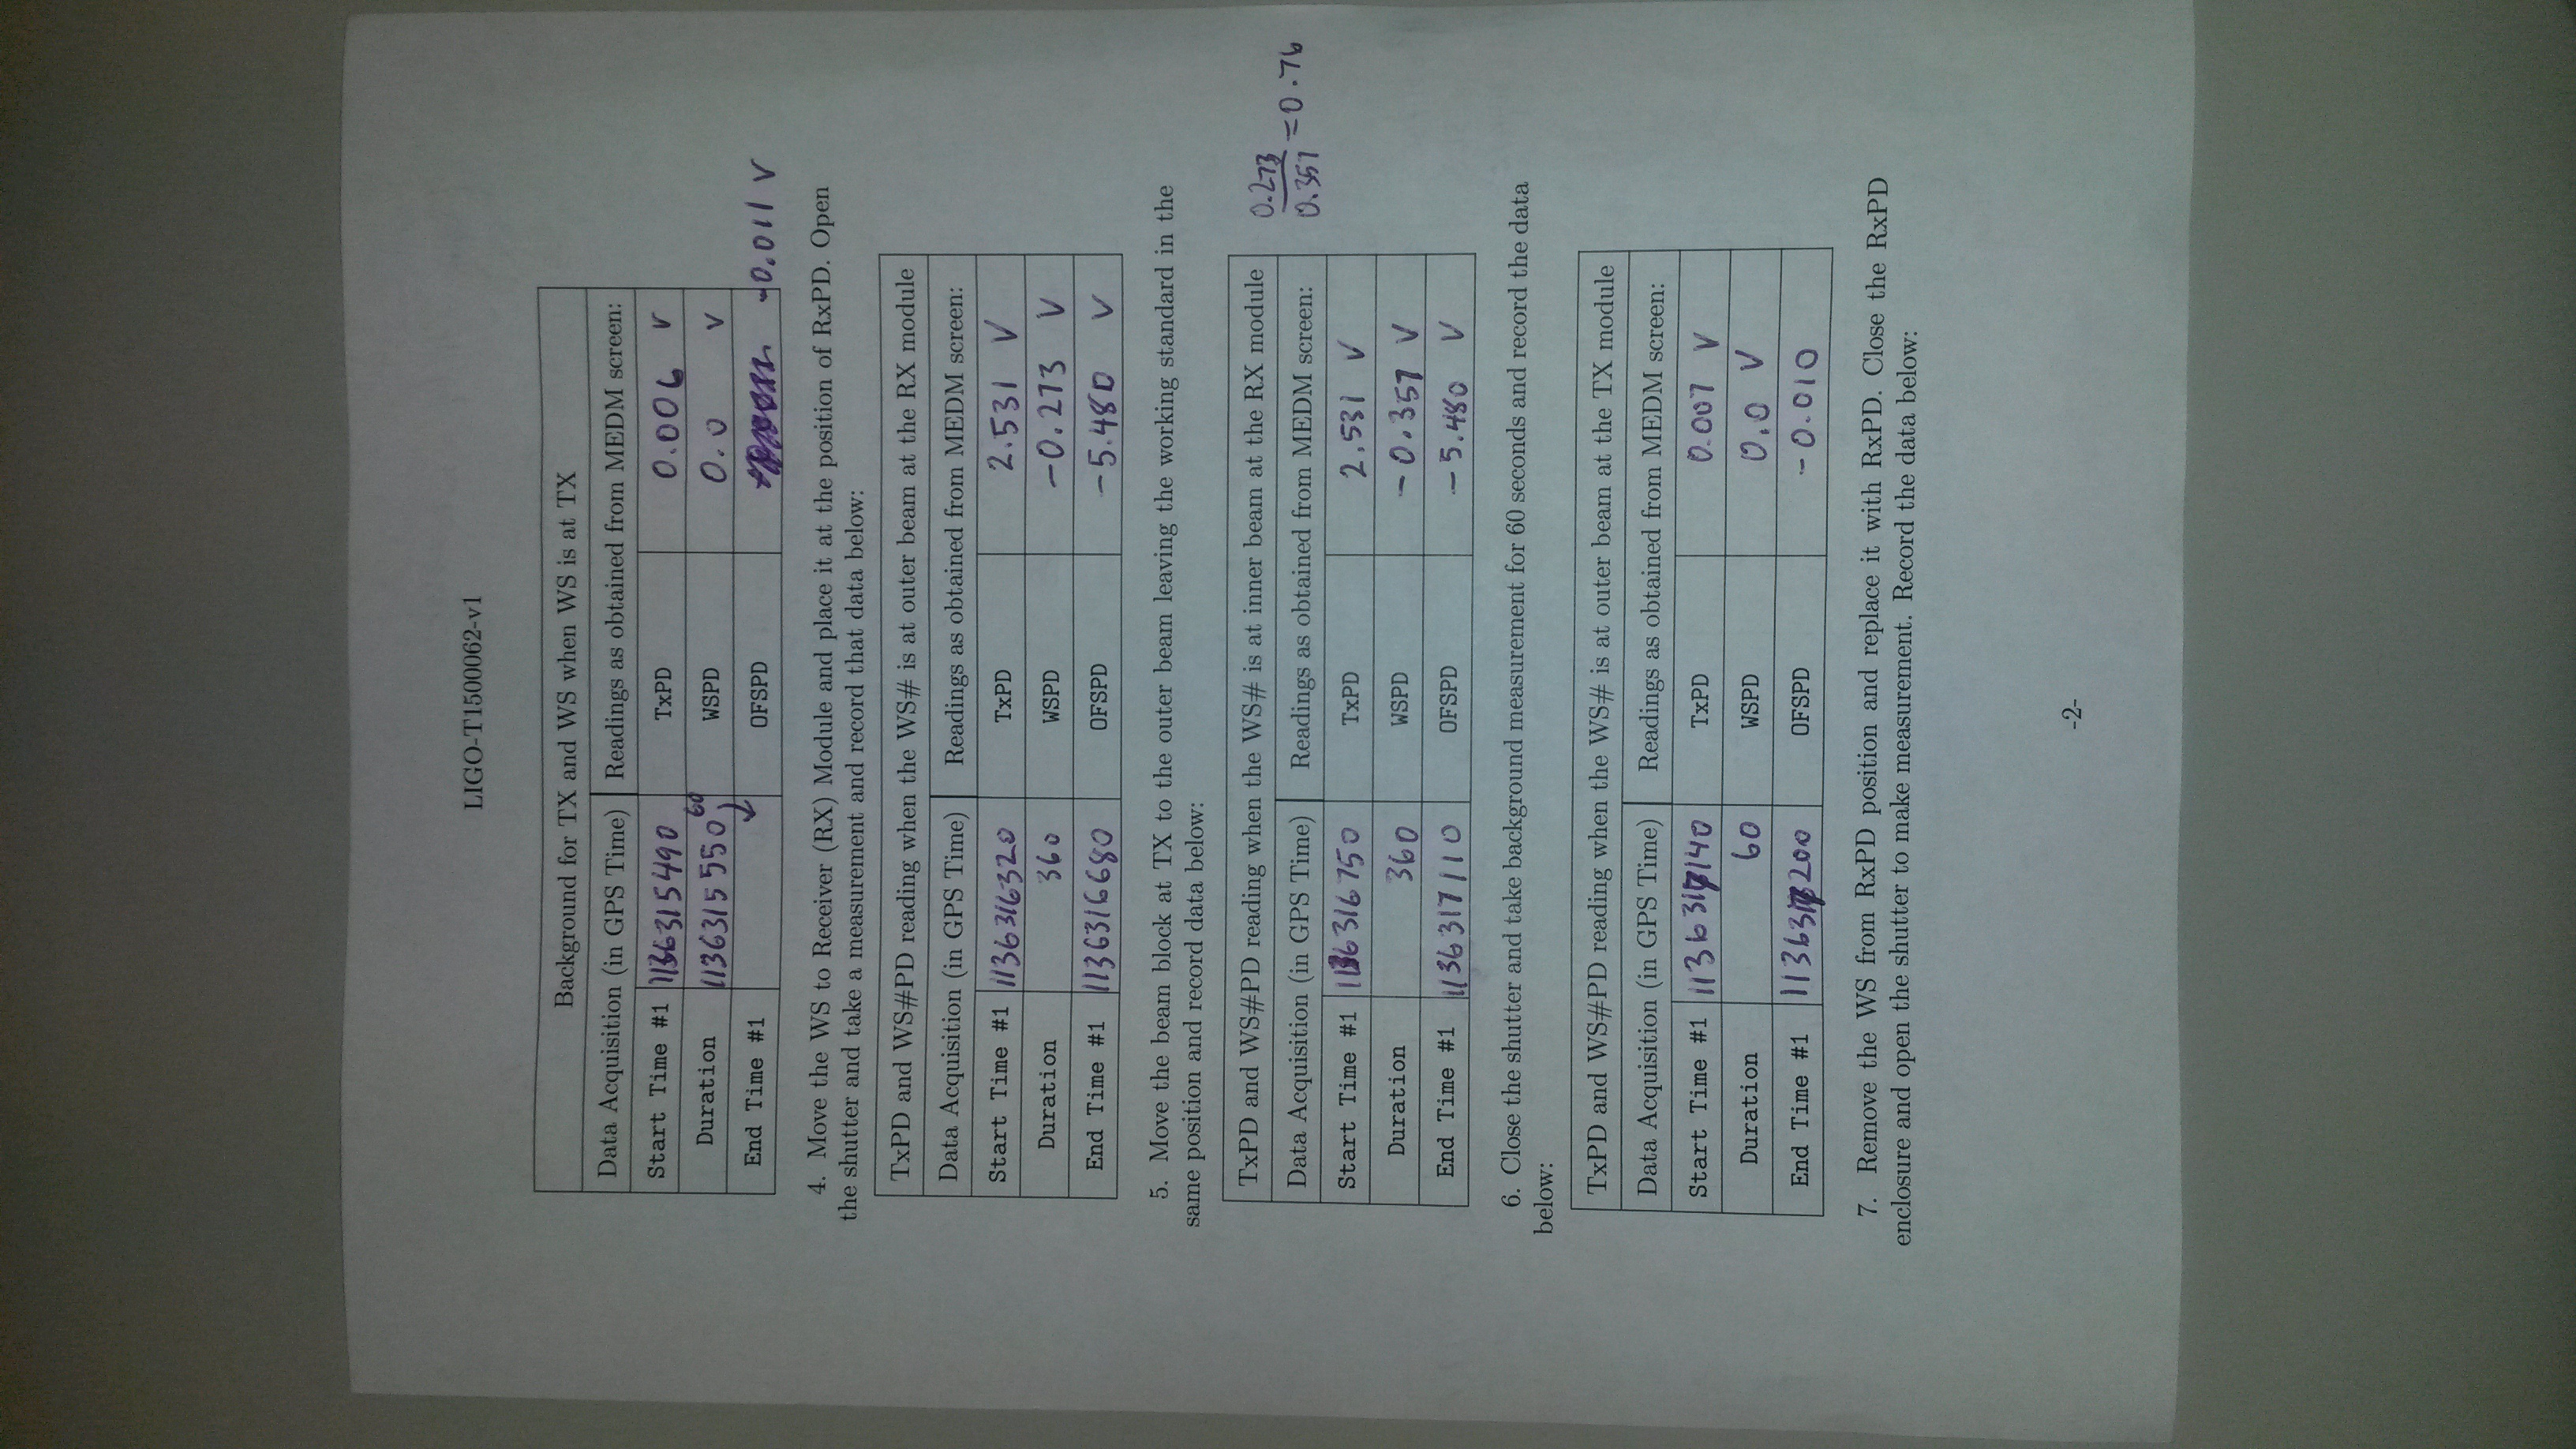
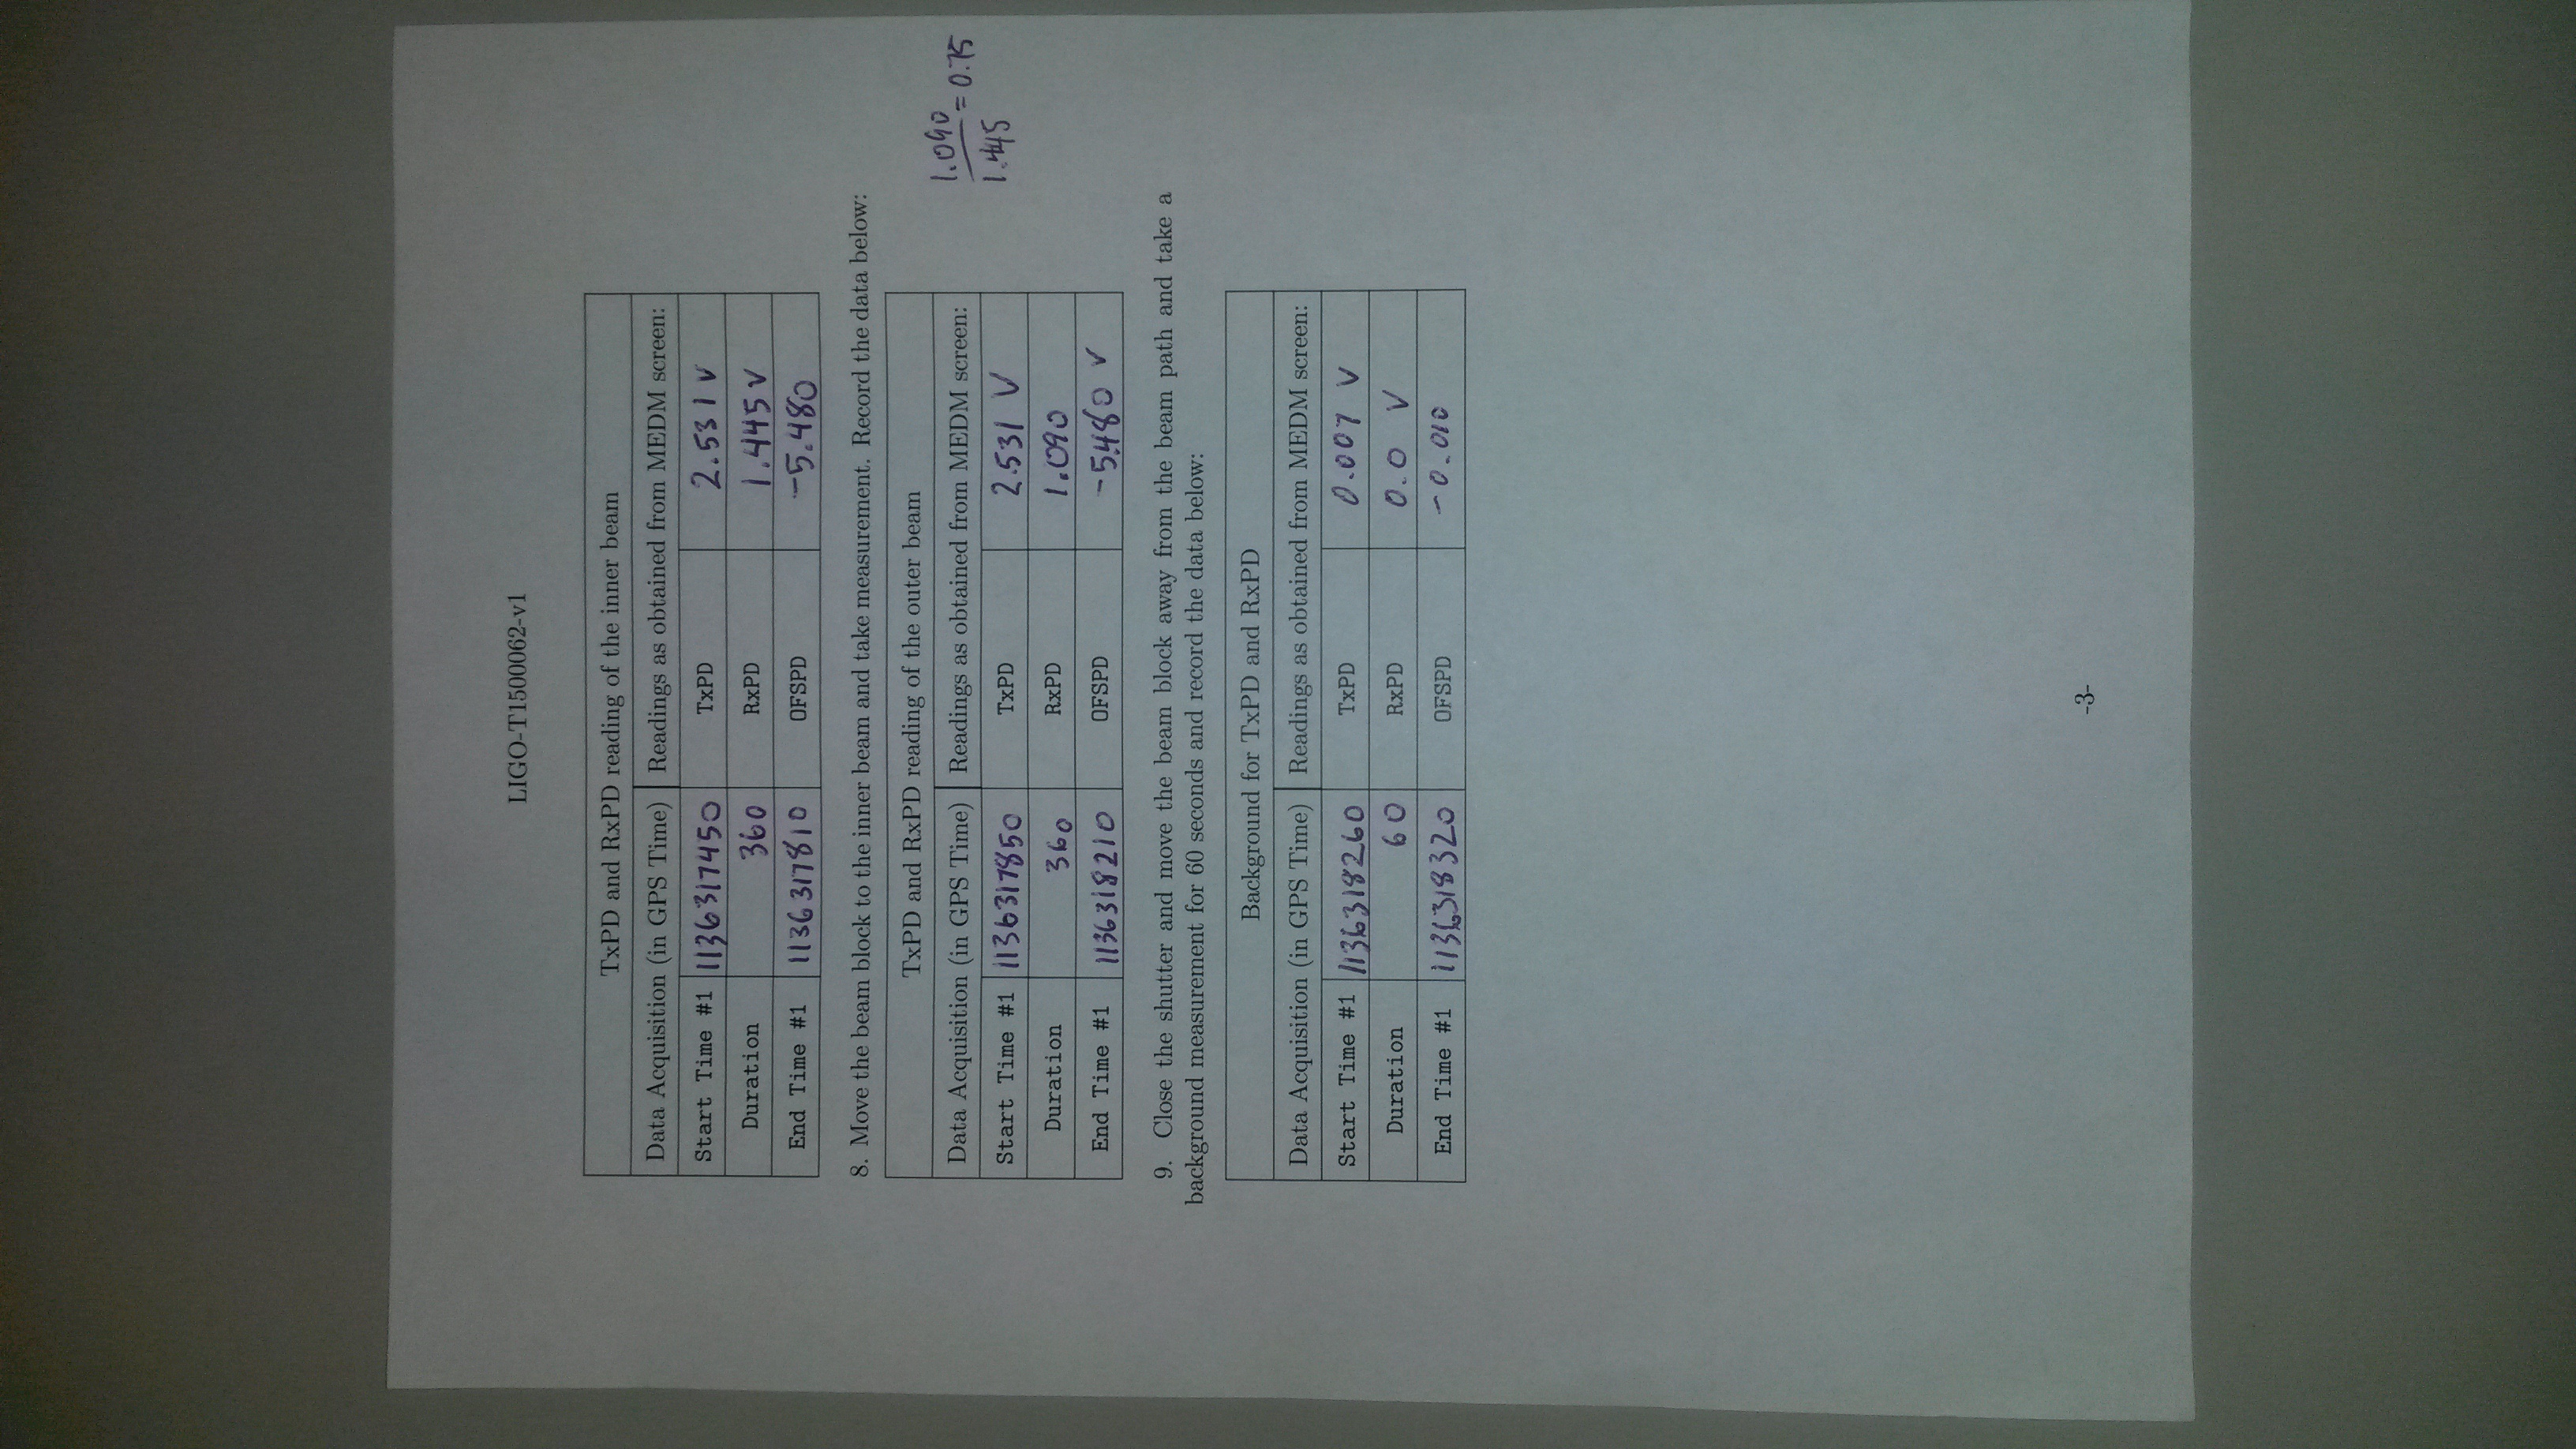
This afternoon, there was a window of opportunity to take ETMX and ETMY charge measurements. Results are posted below. Kissel is suggesting that I add another plot, but since it will take a while to work through I'm deferring to Monday, sad as he now is. Charge is still accumulating and we need to think about flipping the bias soonish.
Images attached to this report