paul.schale@LIGO.ORG - posted 15:33, Monday 04 January 2016 (24691)
DQ shift 28 December - 30 December 2015
- 79% duty cycle at 75-80 Mpc, overall data looks quite clean
- a few lost locks due to earthquakes
- microseism stayed under 0.5 um/s
- no Omicron triggers for 2nd half of shift
- on Dec 28, ~20 Hz glitches occurred for most of the day, Hveto found ASC-CSOFT_Y_OUT_DQ to be responsible (possible scattering?)
full shift: https://wiki.ligo.org/DetChar/DataQuality/DQShiftLHO20151228
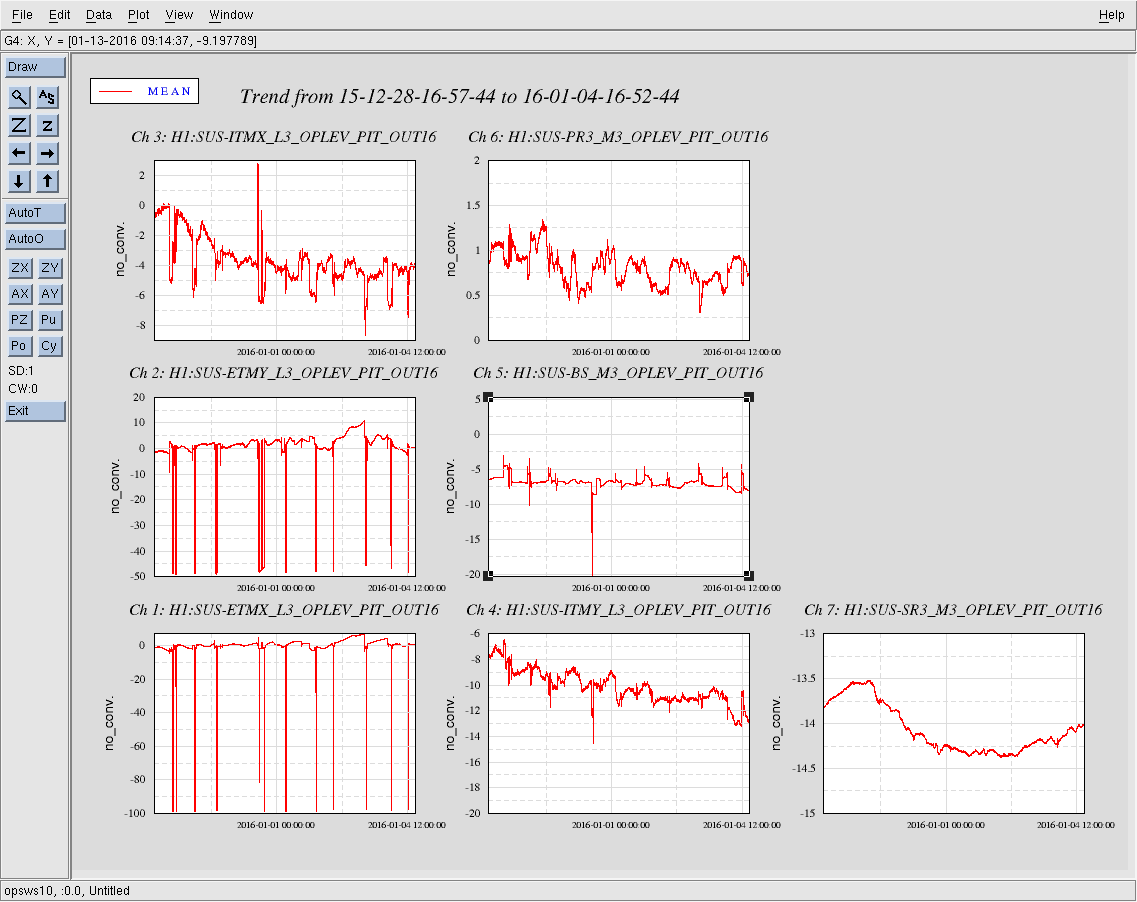
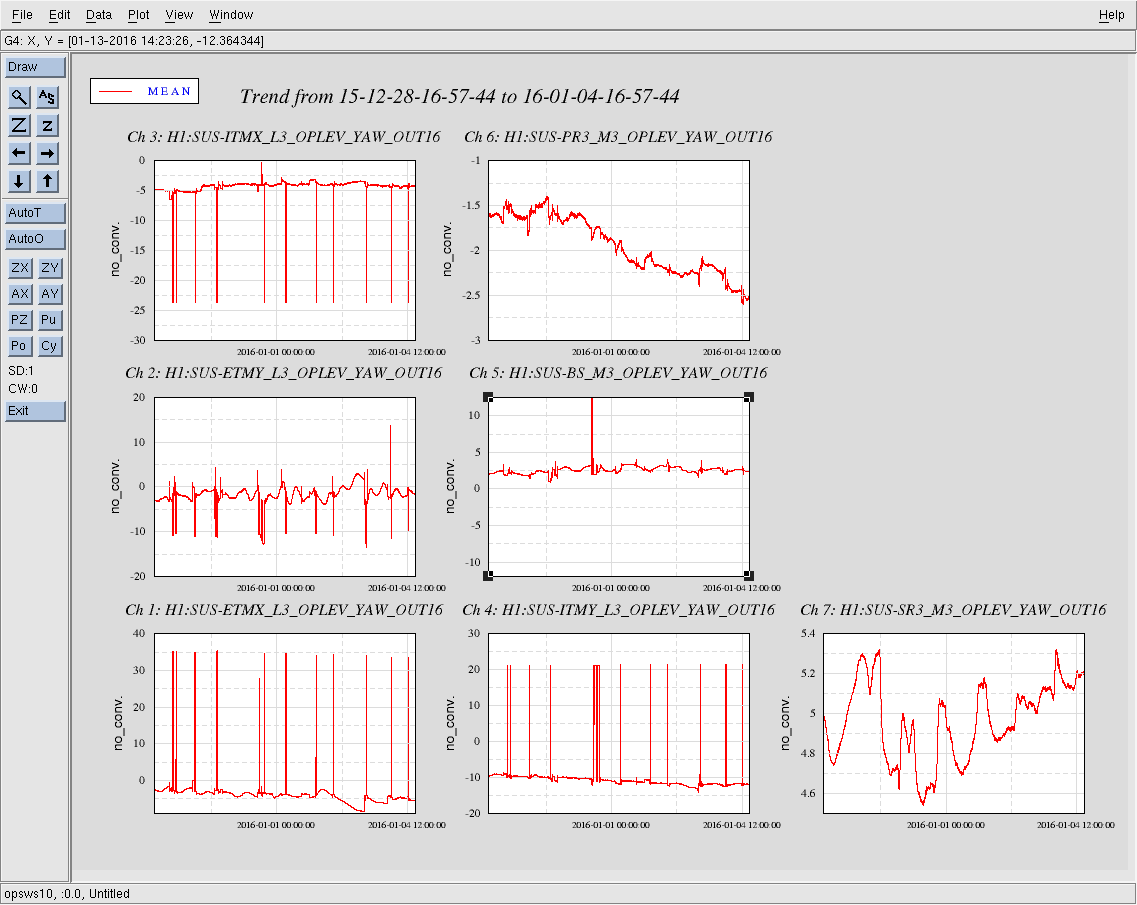
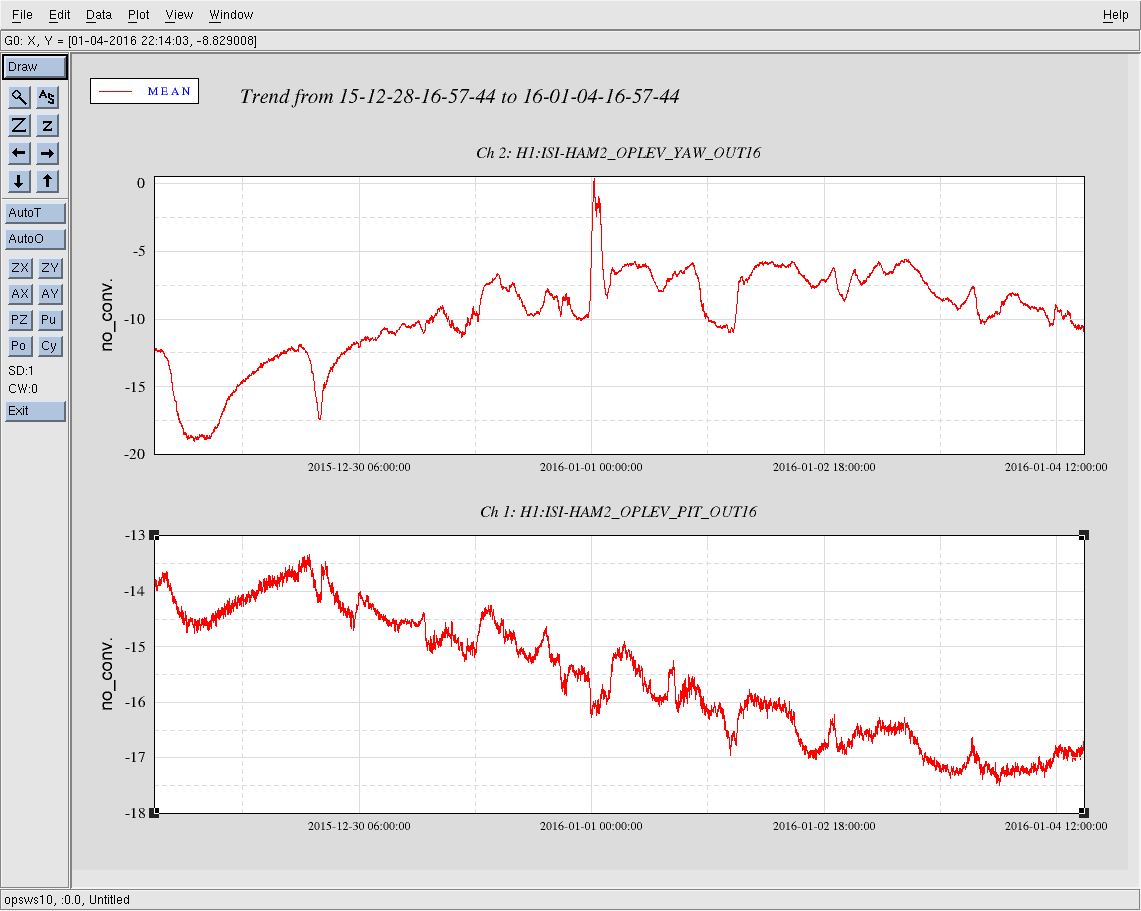
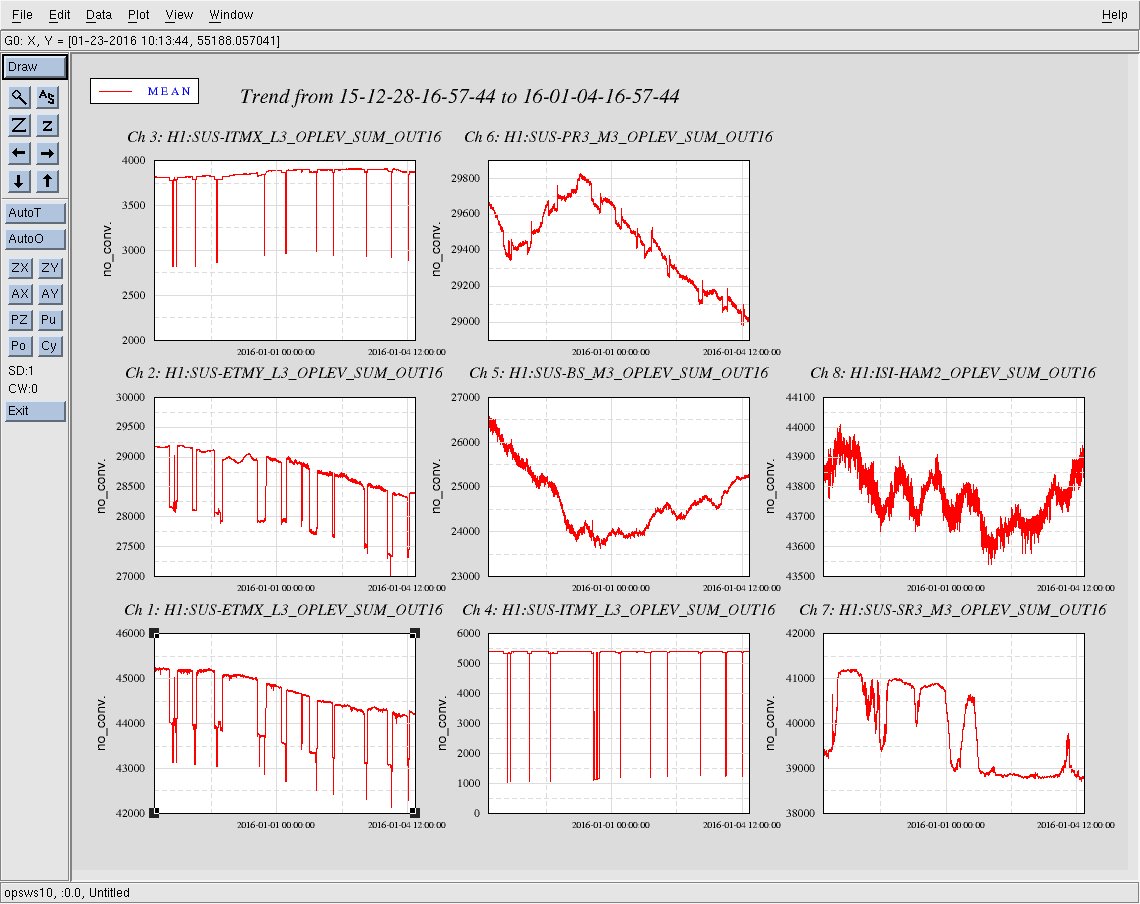
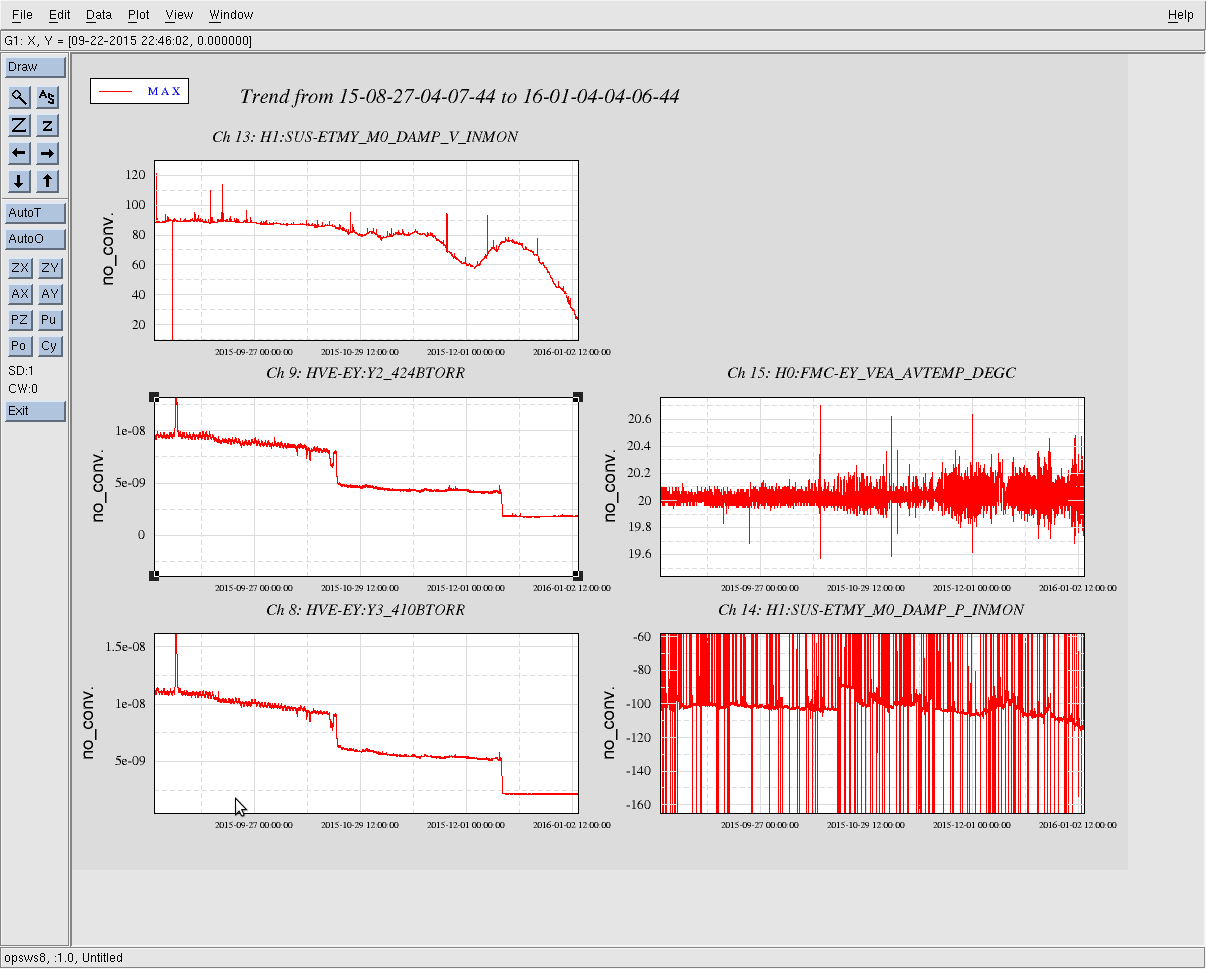
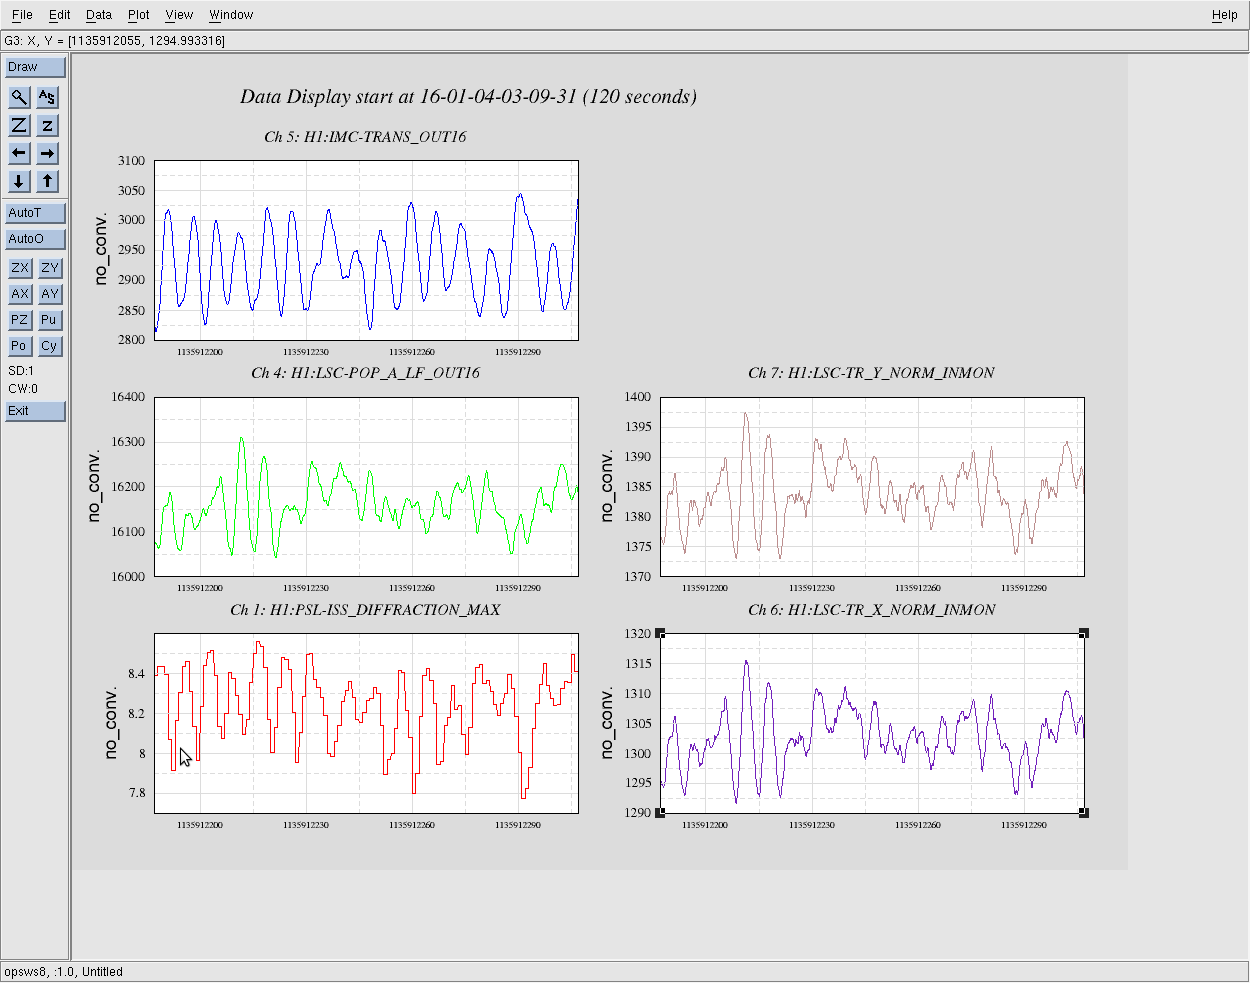
I'm not sure what the significance of this is, or if there is any, but I looked at the pitch and yaw signals for the various optics for today's locklosses, it seems like the ITMY optical lever pitch has behaved similarly to the H1:LSC-POP_A_LF_OUT signal, which is believed to be responsible for our recent locklosses. I've attached two images, one for each lock today. There are many plots shown for the various pitch and yaw signals. The plots in the top right and bottom right are the ones I was interested in.