Title: Ops Day Shift - Mid-shift Update, 22:22UTC
State of H1: lock in DRMI when I started my alog, now in Low Noise
Assistance: Kiwamu, Jenne, Ed
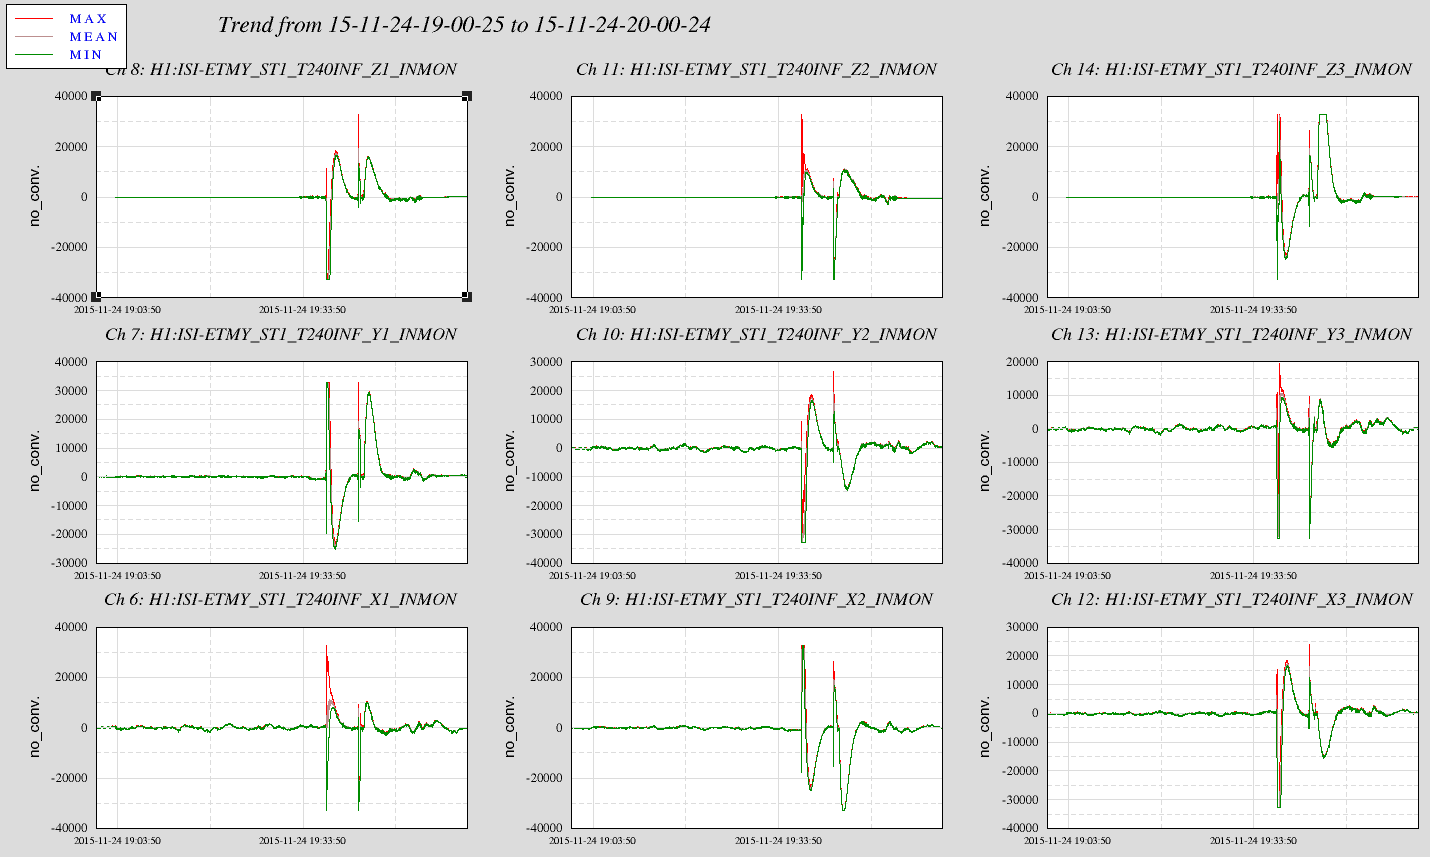
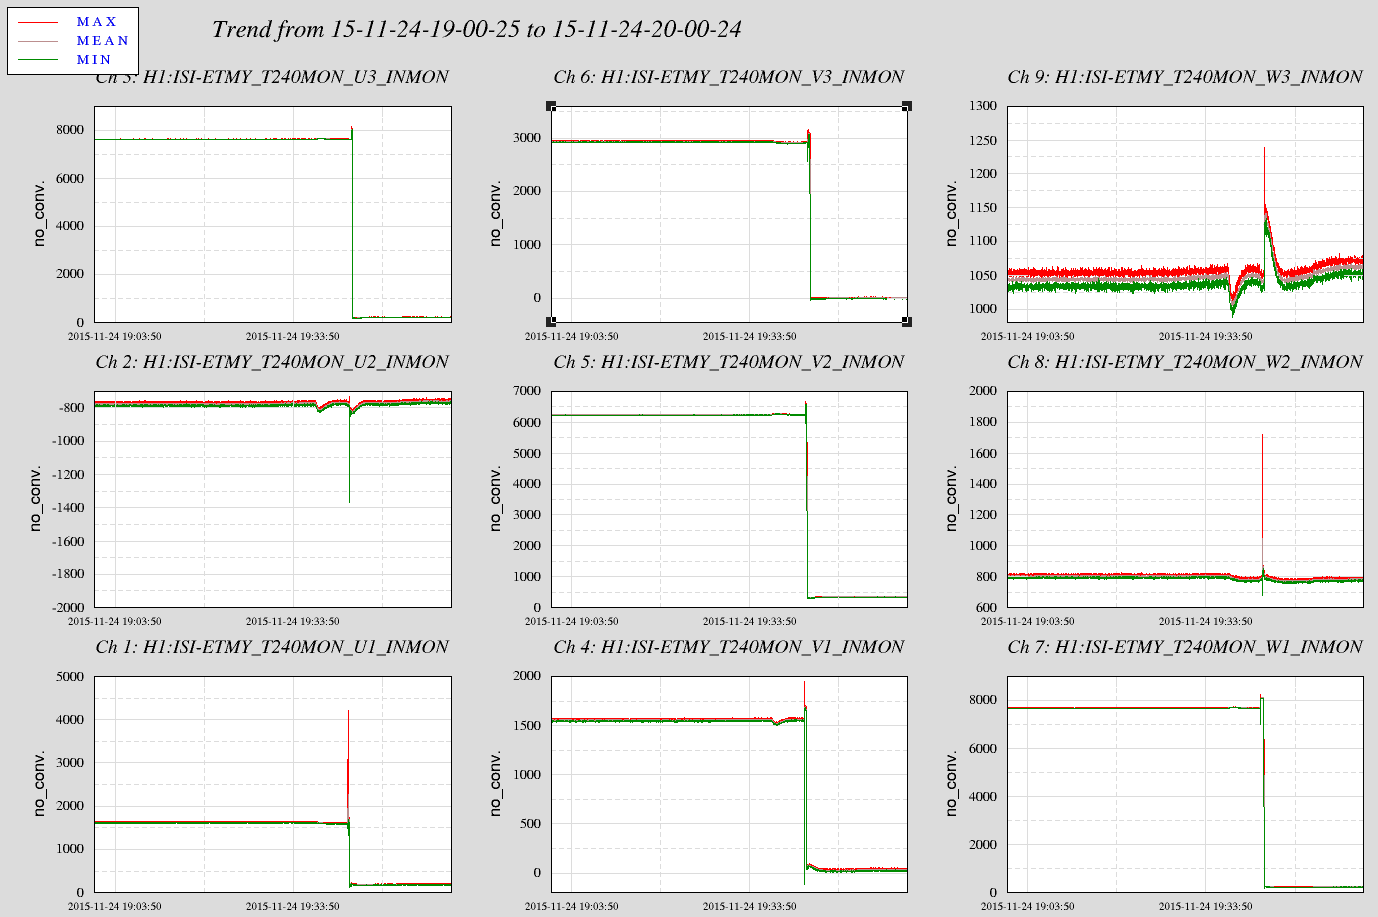
Summary: Y arm alignment has been very sensitive to ETMY alignment, and has needed special attention a couple times today.
Details:
In locking the arms in green, after maintenance, I was able to get Y arm to 0.85 in power, but that alignment was not good for green WFS, so killed the arm.
I chased the changing alignment every time WFS engaged even briefly.
Kiwamu and Jenne diagnosed this as a WFS issue, and driving the WFS issue is was a misalignment in ETMY.
I was able to get the power in the Y arm up to 0.85, however that was optomized for a beam path in the Y arm that wasn't what the WFS wants.
After the Y arm green alignment / locking was corrected and WFS engaged, I offloaded the green WFS and started an initial alignment.
After the initial alignment was complete, the Y arm was again an issue, locking at 0.4.
Again Kiwamu alighned the Y arm, and this time using only ETMY, and arm powers and WFS centering were good.
OMC needed it's WFS cleared.
ISS Second Loop needed to be engaged by hand.
I continued the locking, and currently the IFO is in Low Noise.