cheryl.vorvick@LIGO.ORG - posted 08:49, Monday 21 December 2015 (24355)
GRB alert arrived 16:34:45UTC
State if H1: in Observe
State if H1: in Observe
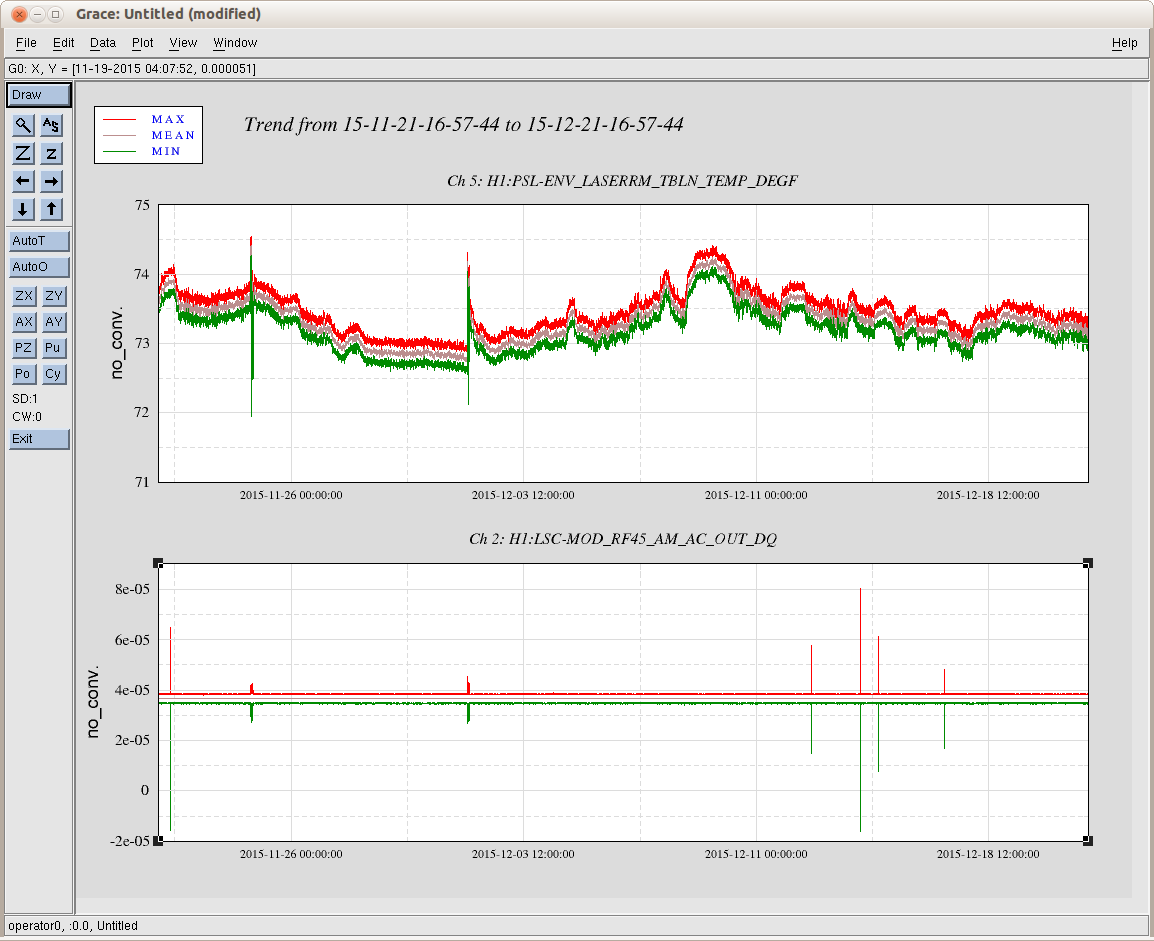
Plot 1 shows the RF AM stabilization out-of-loop sensor and the control signal. Over the past 30 days there were 5 clearly visible glitches in the control signal. These are reflected in the out-of-loop sensor. However, there are two non-stationary episodes in the sensor signal which have only a negligible counterpart in the control signal.
Plot 2 shows the same traces over the past 120 days. Overall, the glitches seem to have reduced in size and frequency for no apparent reason.
Two glitches in the AC channel line up with PSL table temperature swings associated with entry into the PSL laser room.
Activity Log: All Times in UTC (PT)

08:00 (00:00) Take over from Ed
11:15 (03:15) High heat alarm for CS Zone 4 duct temperature, (101.16F). Will monitor.
13:08 (05:08) Four ETM-Y saturations (18:08:33, 37, 40, 44), with a marked drop in range to ~ 63Mpc
16:00 (08:00) Turn over to Cheryl


End of Shift Summary:

Title: 12/21/2015, Owl Shift 08:00 – 16:00 (00:00 – 08:00) All times in UTC (PT)

Support:  None

Incoming Operator: Cheryl

Shift Detail Summary: Locked in Observing mode for past 8 hours. Power at 21.8w, range 79Mpc. Wind is light to gentle breeze (4-12mph). Seismic is improving with a downward trend for the past 6 hours. Microseism is also decreasing, but at a much slower rate than seismic.

Other than 4 ETM-Y saturations (within 11 seconds), which took the range down to a low of 63Mpc, there were no problems or issues during the shift.
All quiet on the western front. IFO is in Observing mode, with 21.8W, and 81.5Mpc of range. The wind, seismic, and microseism have remained constant over the first 4 hours of the shift. For the most part generally good data collecting conditions prevail.
           Transition Summary:
Title:  12/21/2015, Owl Shift 08:00 – 16:00 (00:00 – 08:00) All times in UTC (PT)

State of H1: 08:00 (00:00), The IFO has just relocked. Power at 21.9W, range 78Mpc. Wind is variable up to a moderate breeze (18mph), seismic and microseism remain high.

Outgoing Operator: Ed
TITLE: Dec 21 EVE Shift 00:00-08:00UTC (16:00-00:00 PDT), all times posted in UTC
STATE Of H1: Observing @ 80Mpc
SUPPORT: N/A
INCOMING OPERATOR: Jeff B
SHIFT SUMMARY: Lots of trouble with µSei and a bit of wind that blew up. The details are in the activity log. ISI Blends set to 45Mhz around the board except for ETMX off axis
ACTIVITY LOG:
01:15 Trouble with input align. PR2 pointing was bad. Yaw was off by 6µrads
01:18 Dark mitch still won’t grab. µSei is now peaking around 1.5µm/s. Wind is still NOT an issue. The beam splitter appears to be really feeling the ground motion.
02:50 Touched base with Jenne just to apprise her of the IFO situation
03:00 took ISC_LOCK to down. There doesn’t seem to be any locking (ie Dark Mich, PRMI or DRMI) going on in my near future. uSeism is still trending above 1um/s and the BS is jumping all over itself. th wind has also blown up to >= 20mph at EY.
05:58 PRMI locked! (first small victory)
06:01 DRMI Split mode. no time to tweak.
06:08 DRMI Split mode. no time to tweak.
06:14 DRMI Split mode. no time to tweak.
06:24 Lockloss. IMC broke lock.
06:57 DRMI LOCKED!!!!
07:05 John called to tell me that he was turning on some heat in the LVEA. (H1CA)
07:13 Lost lock at COIL_DRIVERS. grrrrr
08:02 NLN!
08:04 intent it set to Observing
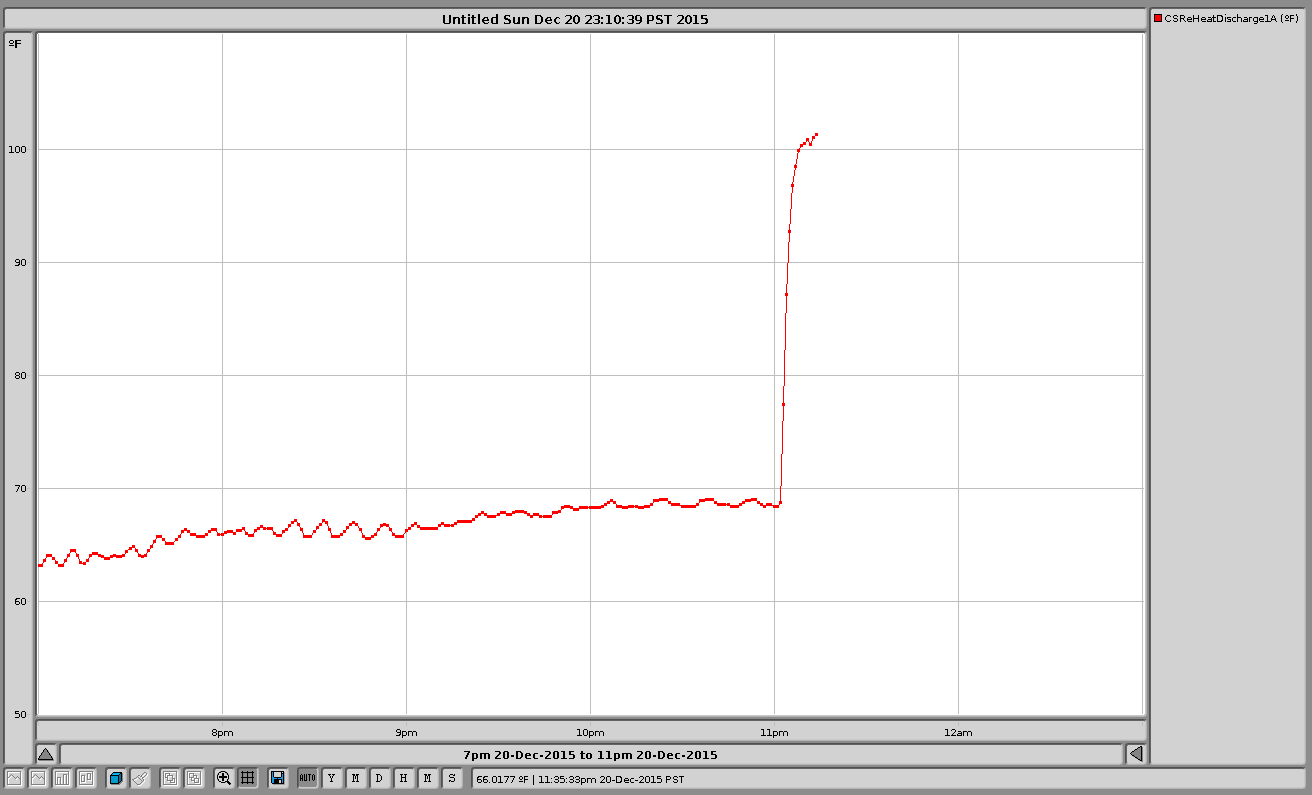
I noticed that the LVEA temperature control was running out of range so I have added an additional stage of heat.
HC1A control has been set to 15ma (was 4 ma) It appears that the first stage heater is not working so this should turn on the second stage.
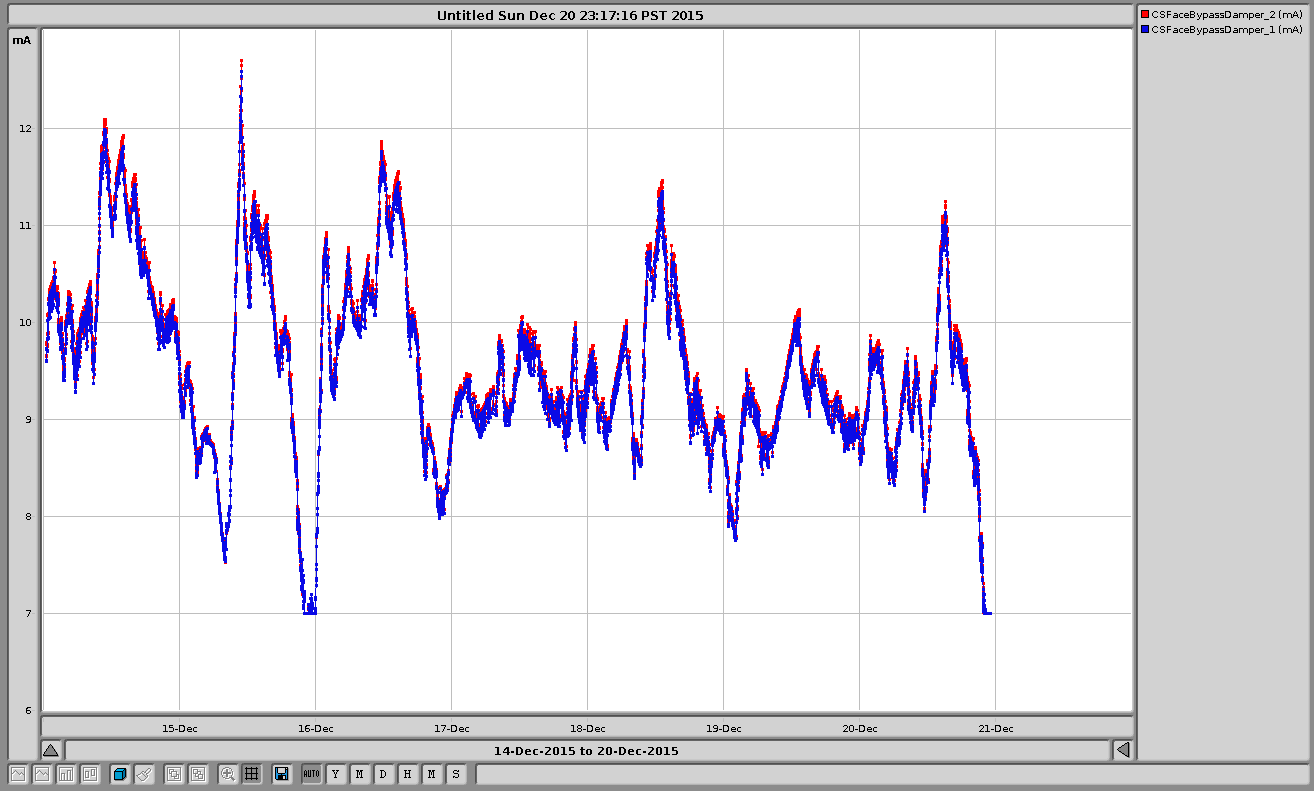
The duct temperature is behaving normally - first plot. Second plot shows the face bypass dampers railing at 7ma.
No locking for ~8 hrs now. uSei is upwards of 1um/s. Wind is tilting EY. I id do quite a bit of batle trying to lock Dark Mich ad PRMI, to no avail. I spoke to Jenne to apprise her of the situation and was advised to sit patiently until conditions improve.
TITLE: Dec 20 EVE Shift 00:00-08:00UTC (16:00-00:00 PDT), all times posted in UTC
STATE Of H1: Environment
OUTGOING OPERATOR: TJ
QUICK SUMMARY: Initial alignment in progress. Dark Mich doesn’t seem to want to grab. winds dies down to ≤10mph from ≥40mph just a few hours ago.EQ bands are below .1µm/s and µSei is trending up into the .9-1µm/s land. Let's get this thing locked!
TITLE: 12/20 Day Shift: 16:00-00:00UTC (08:00-16:00 PDT), all times posted in UTC"
STATE Of H1: Unlocked
SHIFT SUMMARY: Knocked out of lock halfway through the shift by a combination of wind, earthquake, and usesim. Relocking was proving to be impossible for a while. The winds died down about an hour ago, but the seismic still has some activity that I think is moving the optics enough that I cant make it through an initial alignment.
INCOMING OPERATOR: Ed
ACTIVITY LOG:
The winds at EX have picked up to gusts up to 40mph. ONLY the Xarm has any kind of significant wind though. Kinda odd.
I can get ALS locked almost immediately but then will drop after. Everything seems to be very well aligned. I have tried different blend configurations, and 90's on EX with 45's everywhere else seems to work the best. ISI ETMX motion is still pretty high though from the winds.
The EQ is still ringing down a bit, high useism, and high winds at EX, nature is giving us a 3 hit combo. It's not looking good.
The wind is not at the corner station as well, a gust up to 45mph. EX and EY blends in 90's.
Looks to be a mixture of things; high useism (~1um/s), wind picked up (20mph), small EQ (0.03-0.1Hz = 1um/s), ISI ETMX oscillation (This isnt what did us in though!)
The winds picked up to <20mph and then ISI EMTX X started to oscillate, this direction agrees with Jim's startments about teh RY direction causing the ring ups (alog24245). I changed the blend from 45 to the 90's and it all looked much better. I messed around with the Y direction blend as well but it seemed to look better in the 45s. After all of this but before I put it back in Observing, we got an earthquake that moved things around but we are still locked.
The usesim is back up to ~1um/s, winds are <20mph, range has dropped to 72Mpc.
Follow up from yesterday's work, following the last full rsync of /opt/rtcds from h1boot to h1boot-backup which completed at 2am Saturday morning local time, we have had no epics freeze events in the past 31 hours. For comparison, during the past week we have had an average of 6 events per day. I'm now working on splitting the rysnc into smaller chunks so hopefully each one has no impact on the front end EPICS communications but we still keep the h1boot-backup machine up todate as an emergency replacement of h1boot.
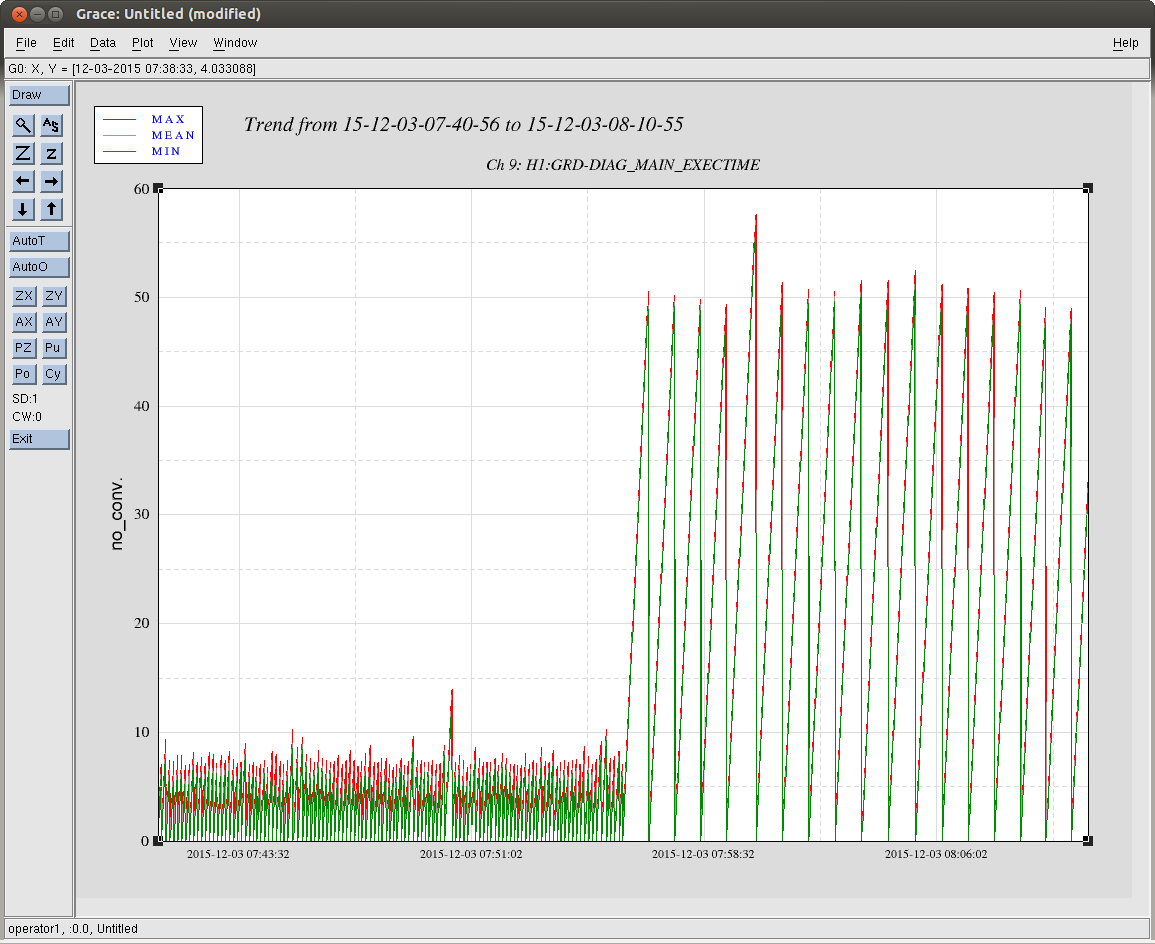
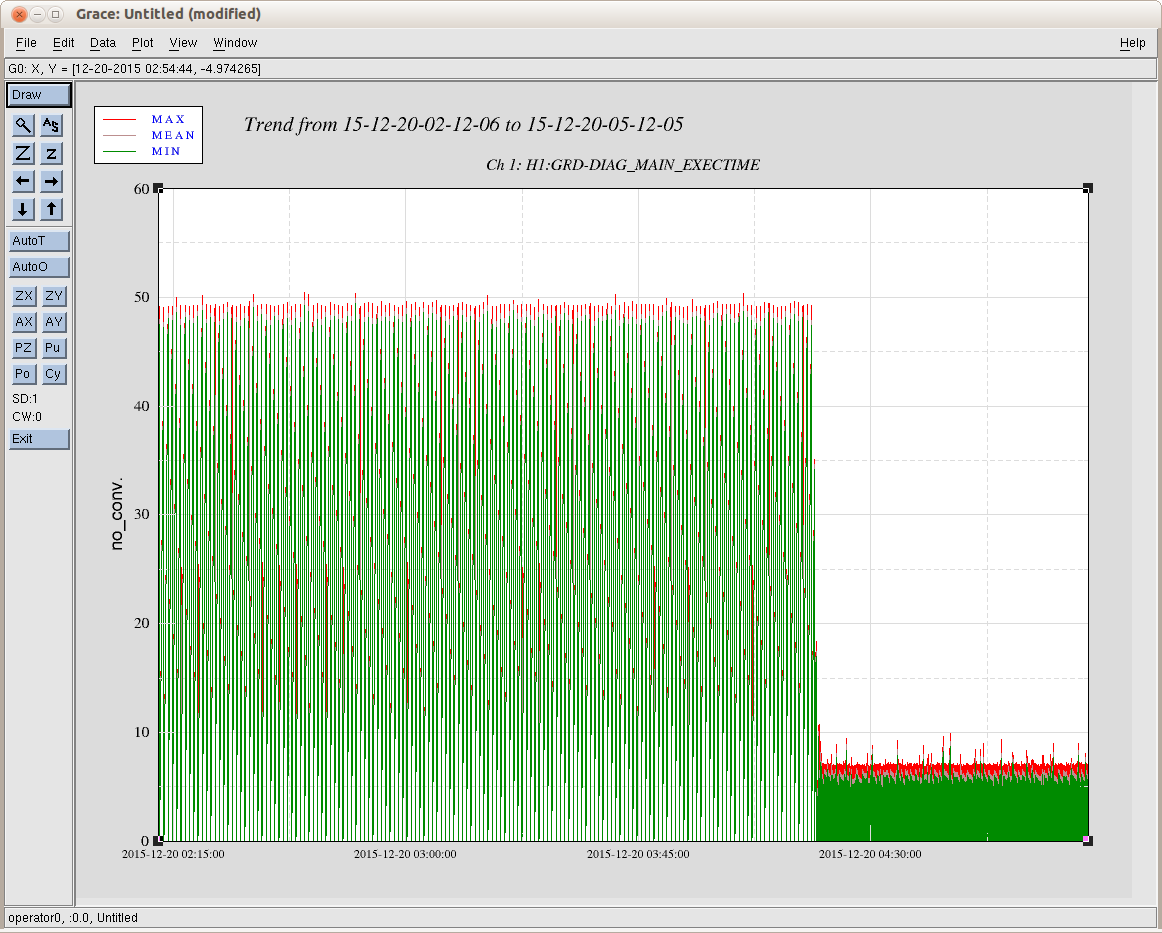
The DIAG_MAIN exec time normally runs around 6/7sec, and every few months it will jump up to ~50sec. It is not a gradual increase, it will just shoot up. December 3, around 8am PST was the most recent time increase, and last night around 20:15 PST it dropped back to ~7sec. I have checked a few other nodes (IMC_LOCK, ISC_LOCK, ISI_ITMX_ST1, and a few SUS nodes that I can't remember) and their exec times dont seem to show any coincidence with this. The DIAG_MAIN node is different than most of the other ones because it will make numerous ezca calls continuously to check on channels and evaluate what may be out of normal, so it might make sense that the other nodes are not showing the same signs.
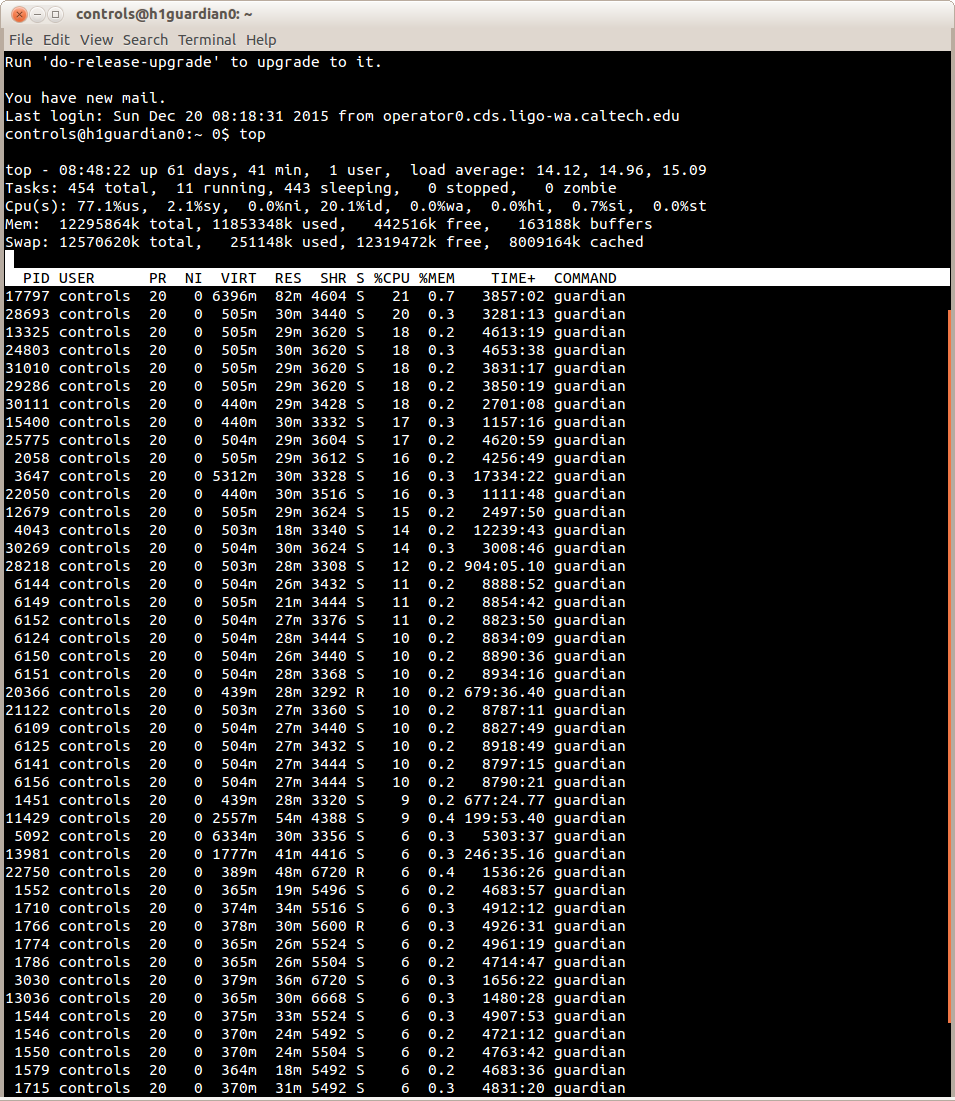
I quickly logged into the h1guardian0 machine this morning, while LLO was down, to see if the usage has dropped from last time I checked on the 3rd. I wasn't smart enough then to take a screenshot, but from what I remember from the 'top' command screen the tasks were about the same and the CPU%'s were similar but maybe now slighty lower, but only maybe. [Login times to h1guardian0: 16:18,16:48 UTC for a few minutes each time.]
Nothing seemed to have happened around 20:15 last night, we have been locked and observing for the past 34 hours. The investigation continues...
TITLE: Dec 20 Owl Shift 08:00-16:00UTC (00:00-08:00 PT), all times posted in UTC
STATE Of H1: Observing at ~80 Mpc
SUPPORT:
INCOMING OPERATOR: TJ
SHIFT SUMMARY: Low wind through out the night. Useism picked up and hit 90th percentile. Mysterious calls continues in the morning, three times in a row. LLO still down from high useism.
TITLE: 12/20 Day Shift: 16:00-00:00UTC (08:00-16:00 PDT), all times posted in UTC"
STATE Of H1: Observing at 78Mpc for 33hrs
OUTGOING OPERATOR: Nutsinee
QUICK SUMMARY: Long lock! Wind <10mph, useism 0.5um/s, PSL 21.9W, CW inj running, LLO not locked.
Useism slight trend down and now just below 90th percentile.Wind picks up just a bit but still less than 10 mph. Very clean DMT Omega. LLO's down due to high useism.
Max, Chris

Summary:

We tested scheduling the burst injections. The purpose of this test was to test the burst pipeline hardware injection recovery as outlined in the O1 plan.

The initial aLog is here: aLog entry

Waveform:

The waveform parameters are here: https://daqsvn.ligo-la.caltech.edu/svn/injection/hwinj/Details/config/Burst/Waveform/WNB_burst_1134573920_1.info

The waveform file for H1 and L1 are: https://daqsvn.ligo-la.caltech.edu/svn/injection/hwinj/Details/config/Burst/Waveform/WNB_burst_1134573920_1_H1.txt https://daqsvn.ligo-la.caltech.edu/svn/injection/hwinj/Details/config/Burst/Waveform/WNB_burst_1134573920_1_L1.txt

First Test:

The first test was scheduled for 1134577813. The schedule file was given:
1134577813 2 1.0 WNB_burst_1134573920_1_

This injection failed.

It failed because the waveform files ended in .dat instead of .txt. tinj was updated but the documentation for performing hardware injections document was not!

Max and I checked the PINJX_TRANSIENT EXCMON channel to confirm that a signal did not go into the inteferometers.

Second Test:

The second test was scheduled for 1134581196. We renamed the waveform ASCII files and the schedule file was given:
1134581196 2 1.0 WNB_burst_1134573920_1_

This injection was successful.

cWB already picked up the injection. See gracedb link: gracedb entry

Action Items

  * The documentation for burst injections needs to be updated with the correct filename.
I checked the segment database to make sure the injection was logged correctly. It was. Querying ODC-INJECTION_BURST:2 in both IFOs from 1134577800 I get a segment for [1134581196,1134581198).
The documentation (DCC link) has been updated to correctly say to use .txt extension for burst injection waveform files.
