The sensor correction on ETMX HEPI needs to be changed, it is using a bad filter. I think it's using a filter that we adjusted for the T240 that used to be installed there. The fix is a simple copy, paste from another bank, but its causing a lot of extra motion at EX. But it's possible that there maybe other issues
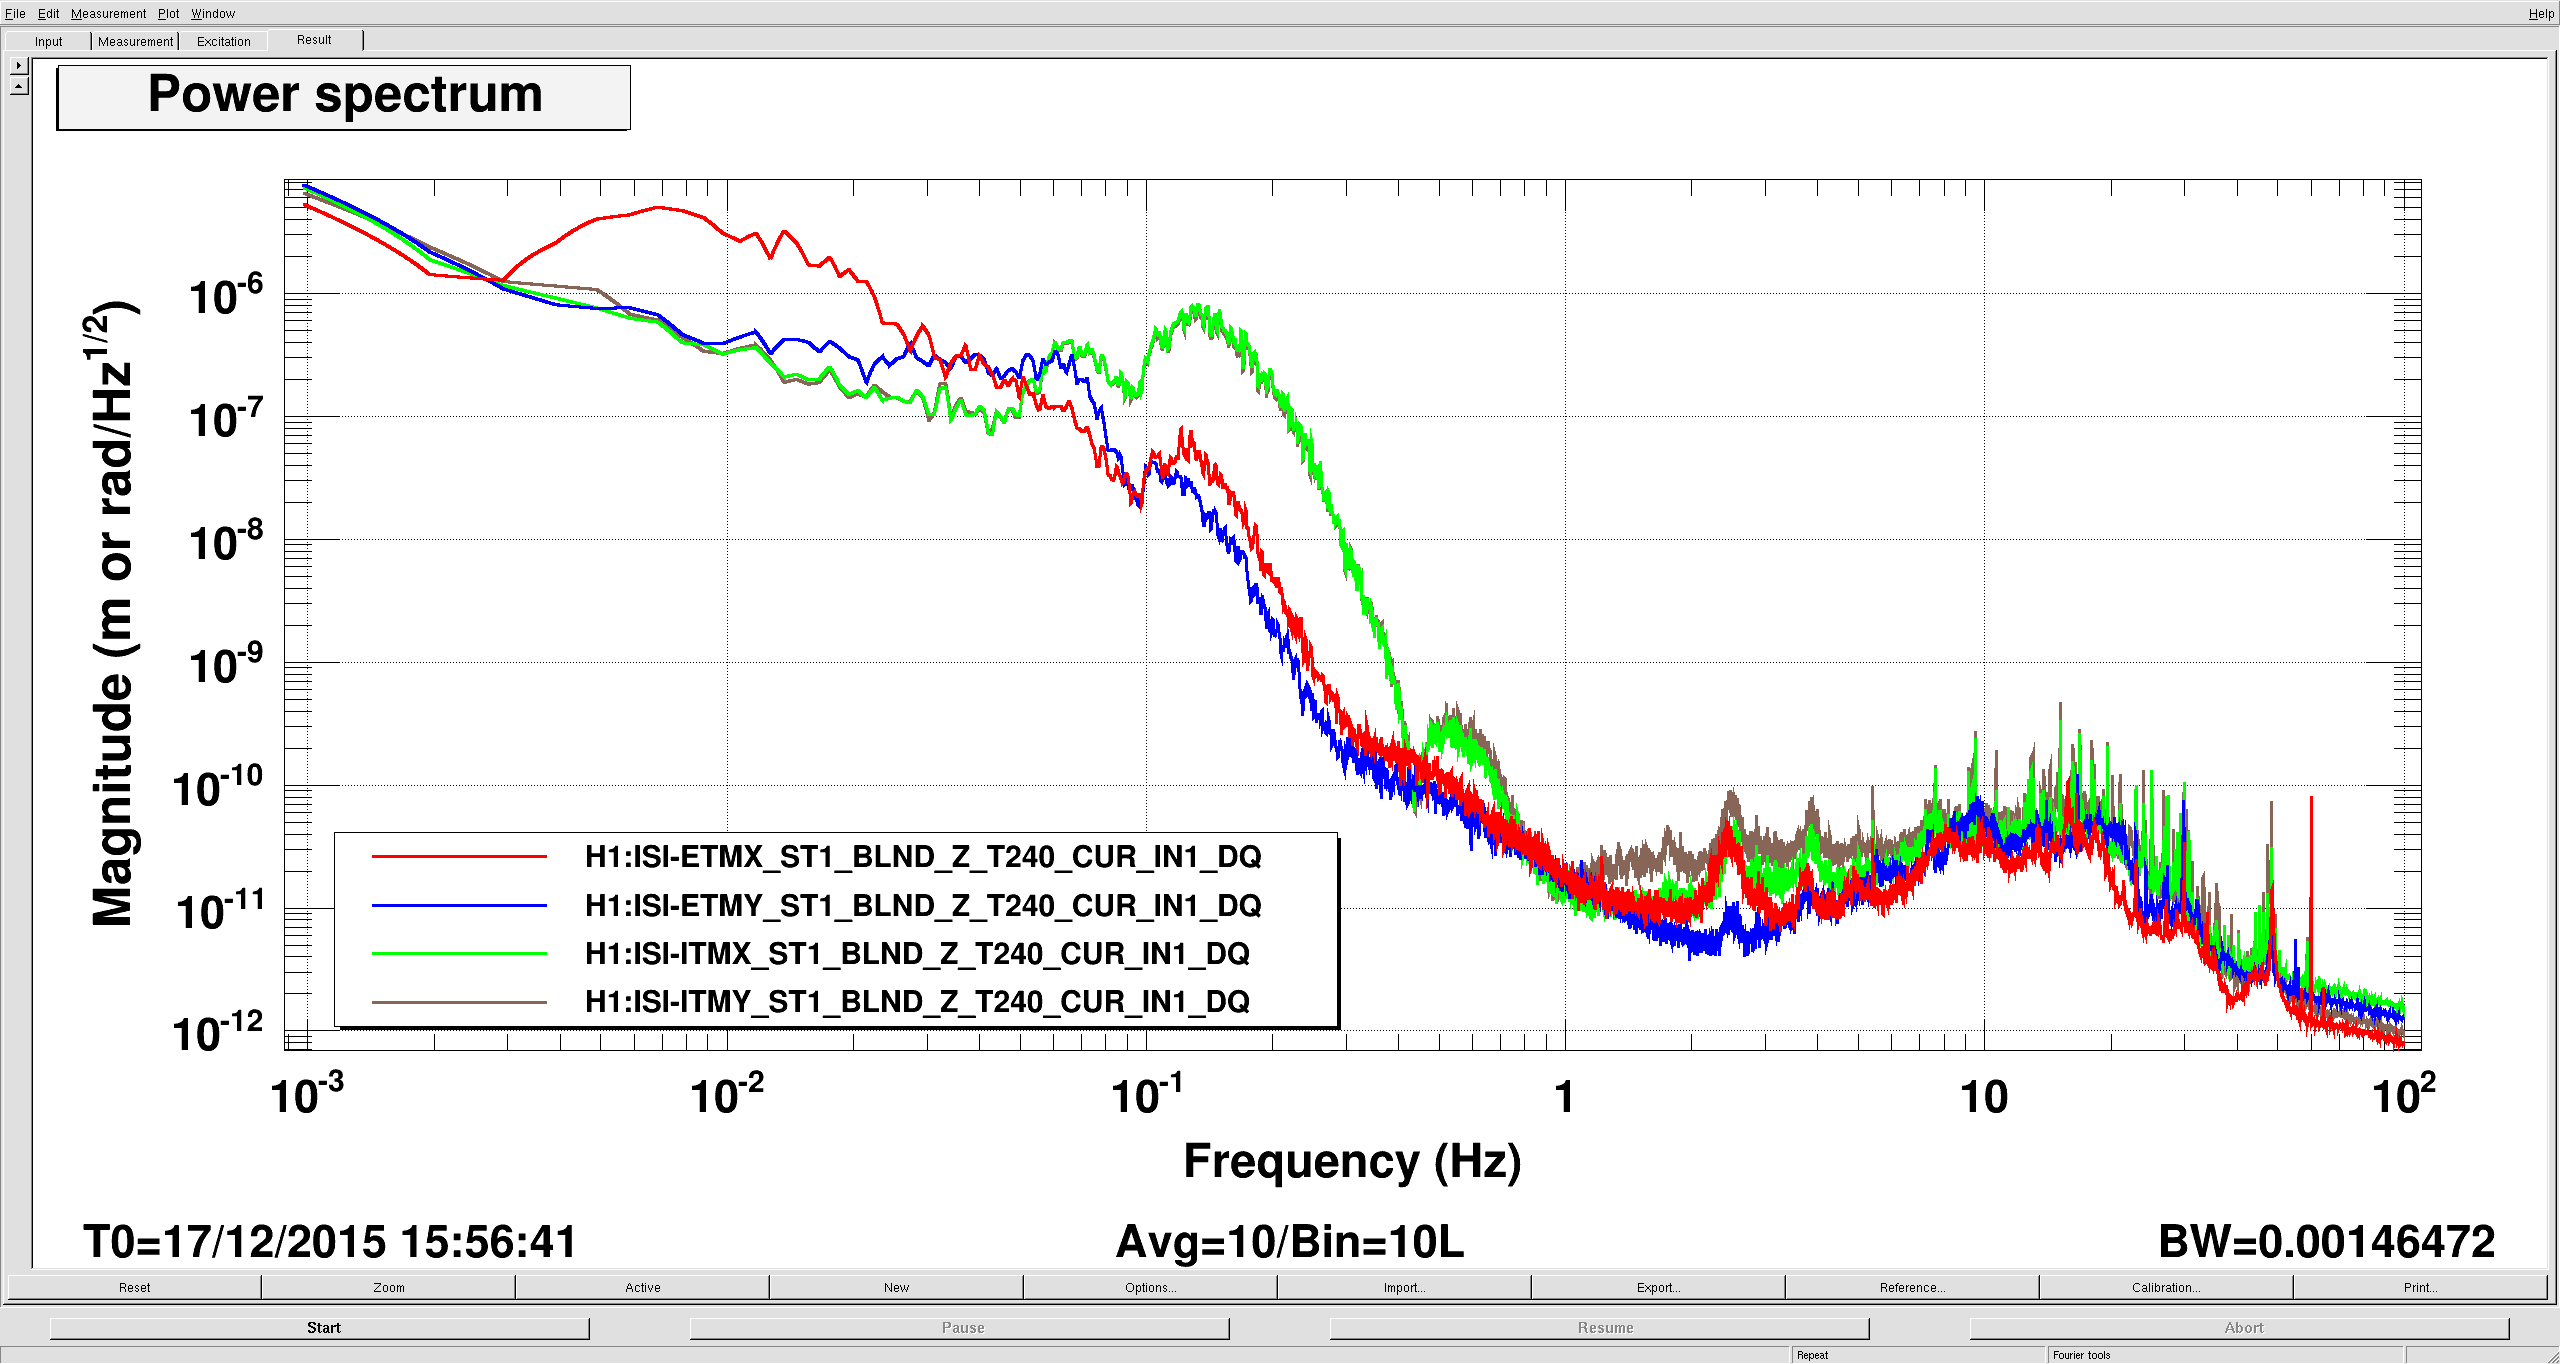
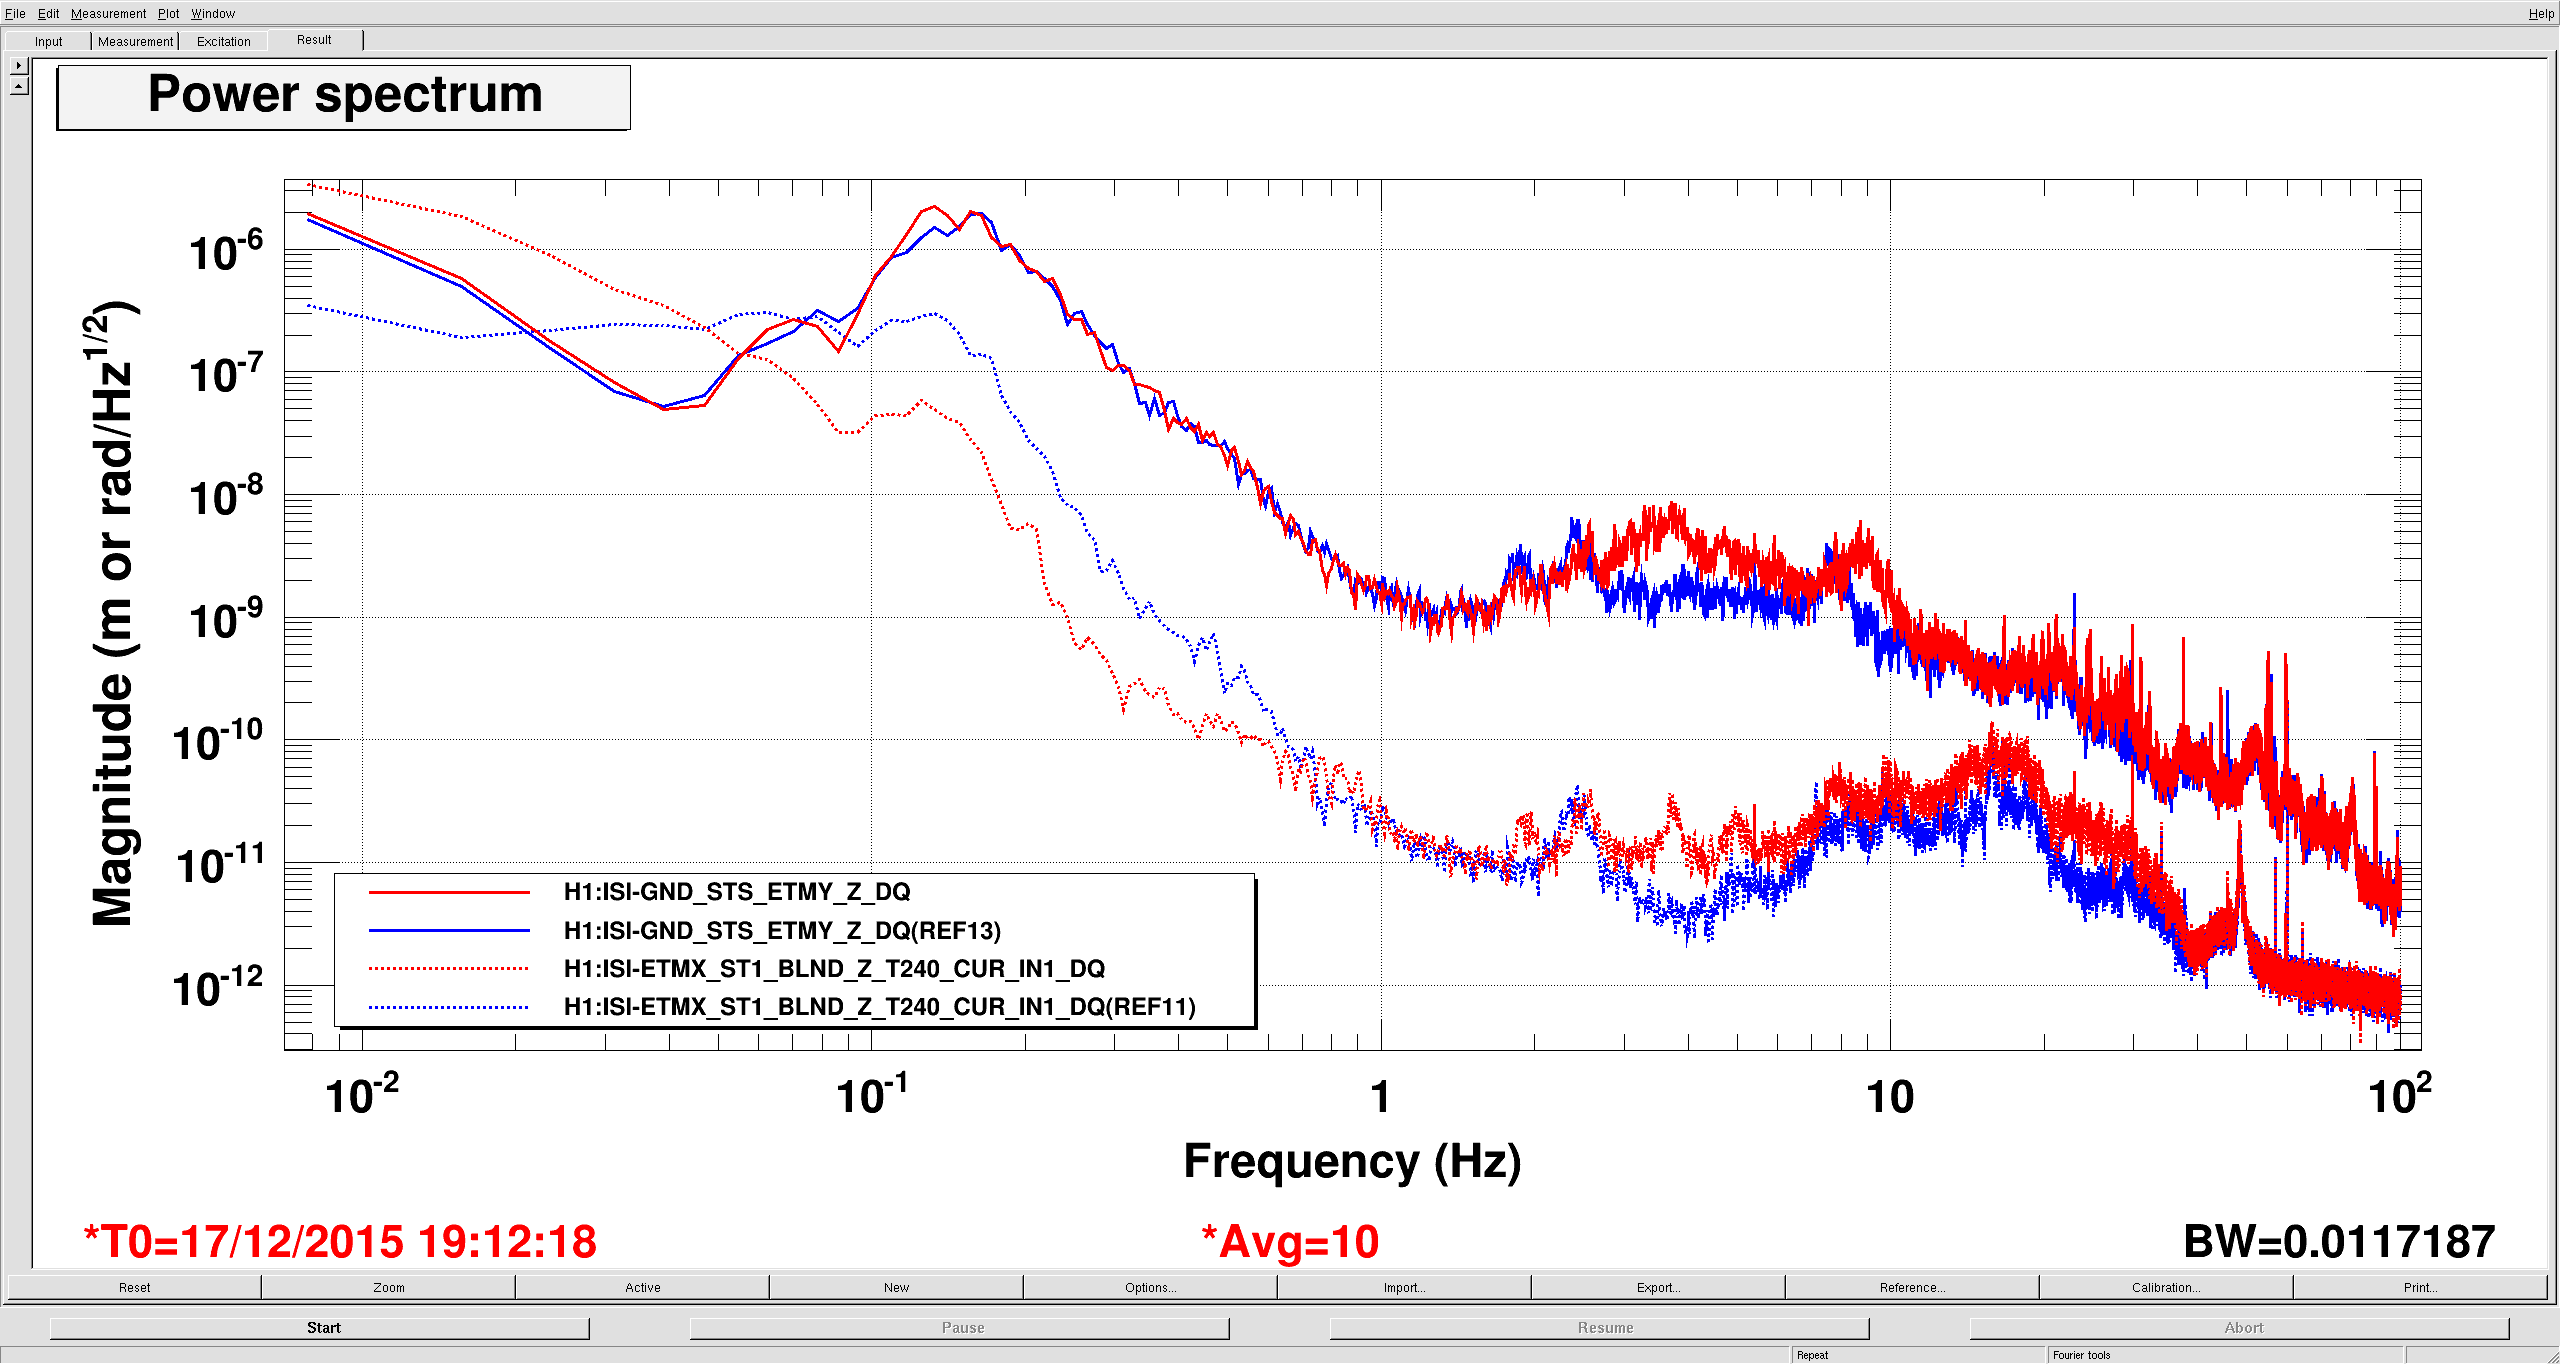
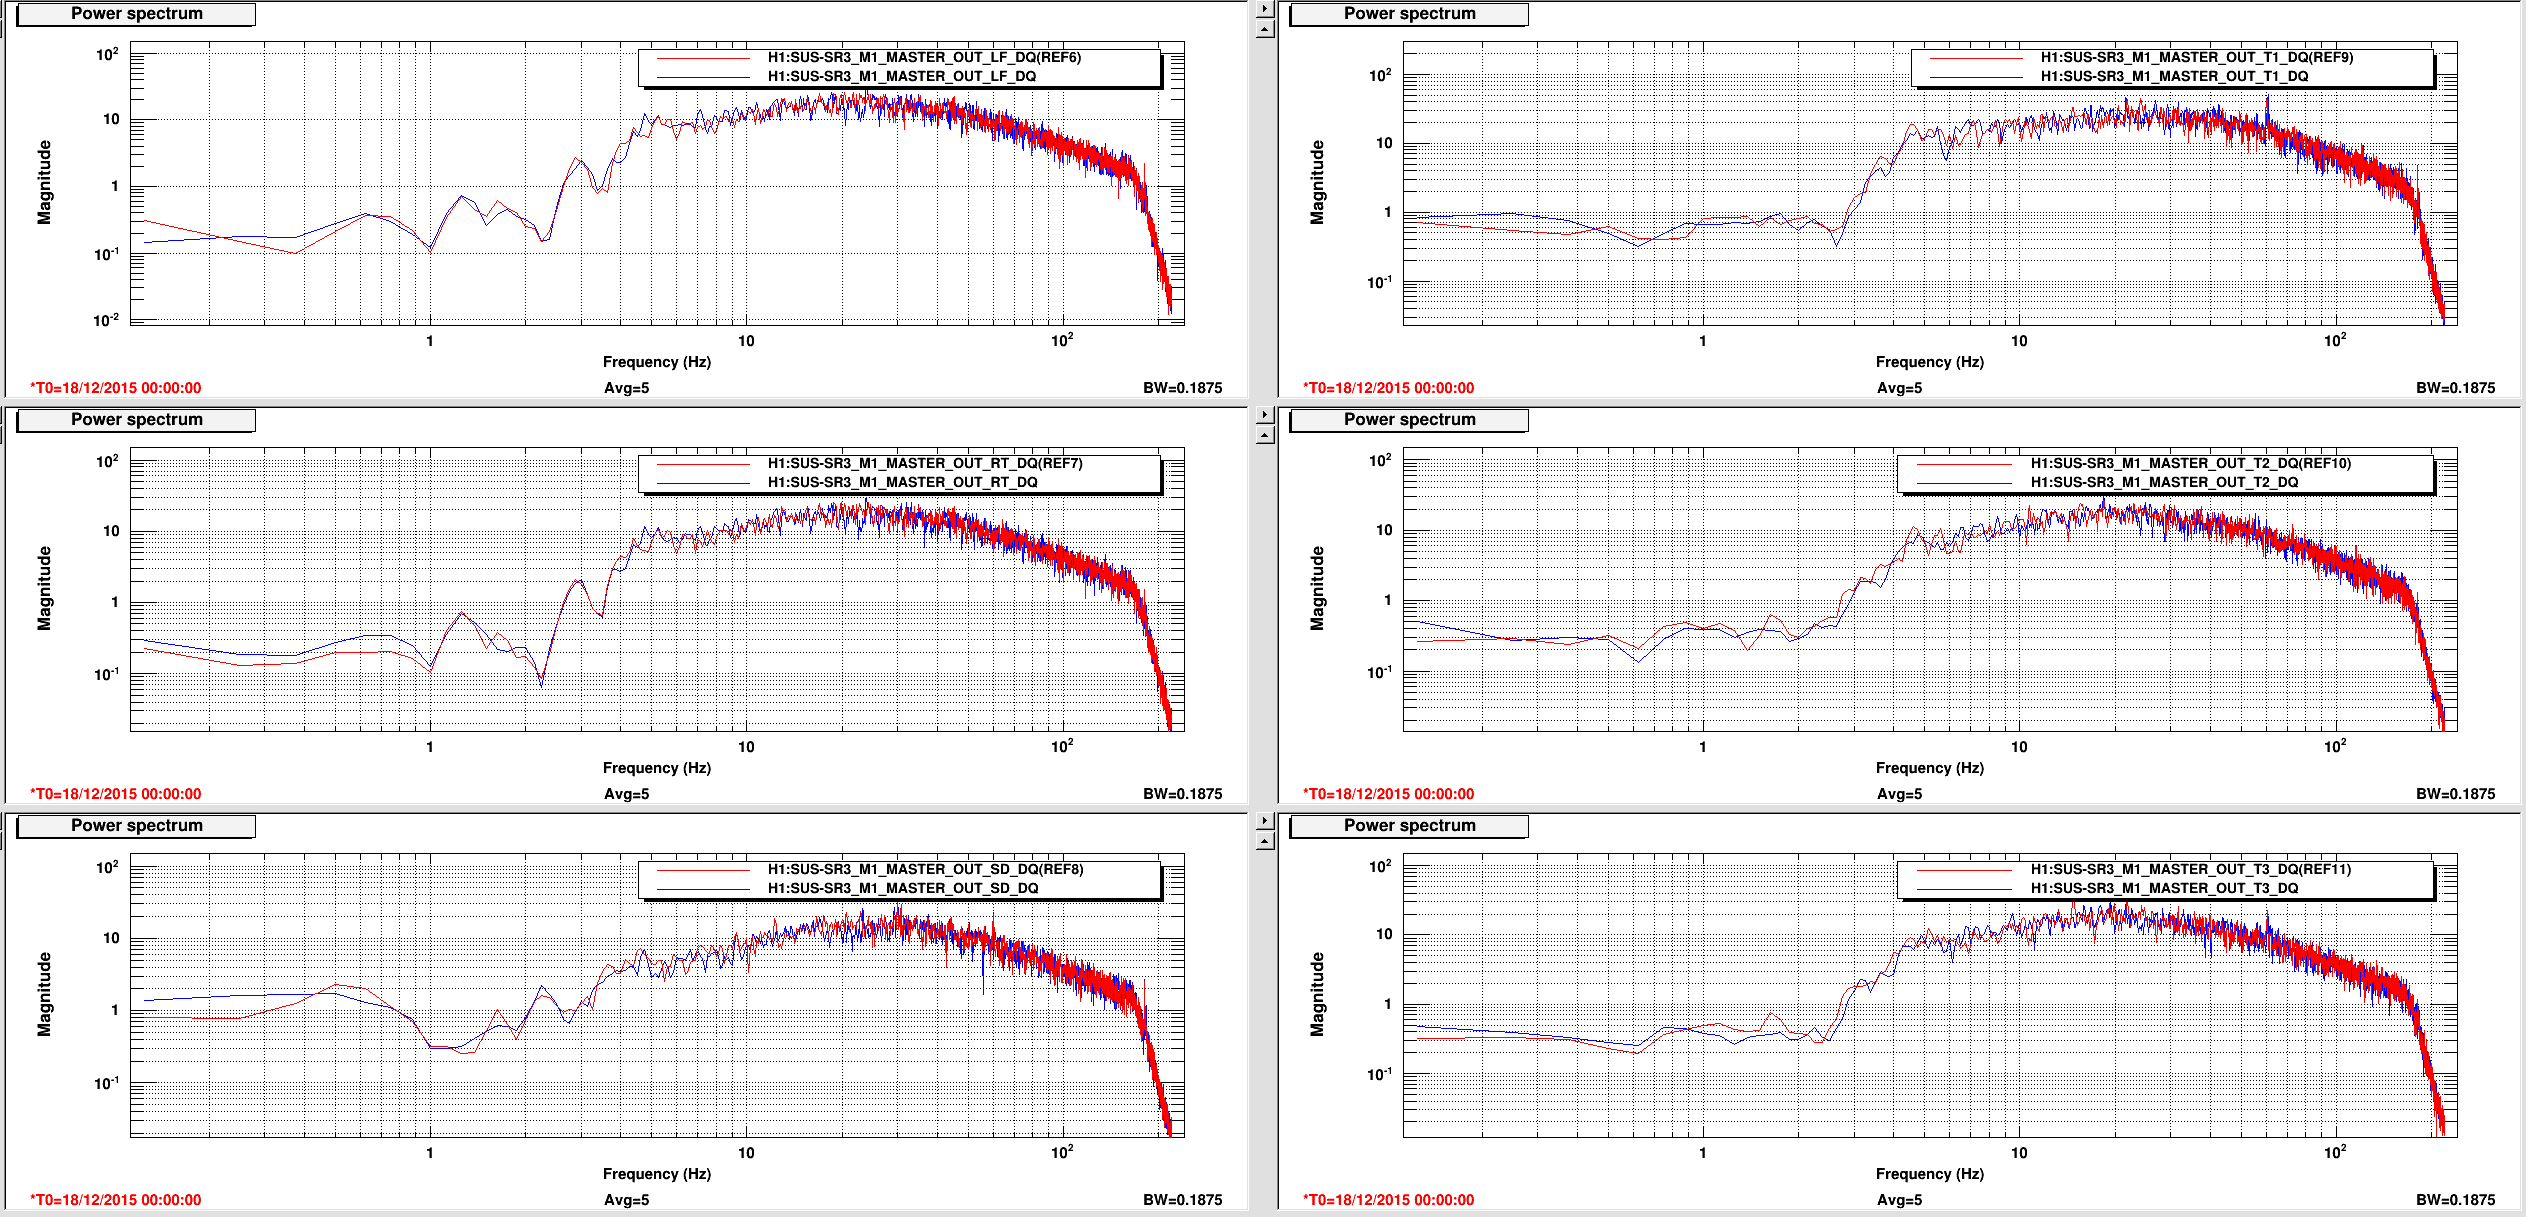
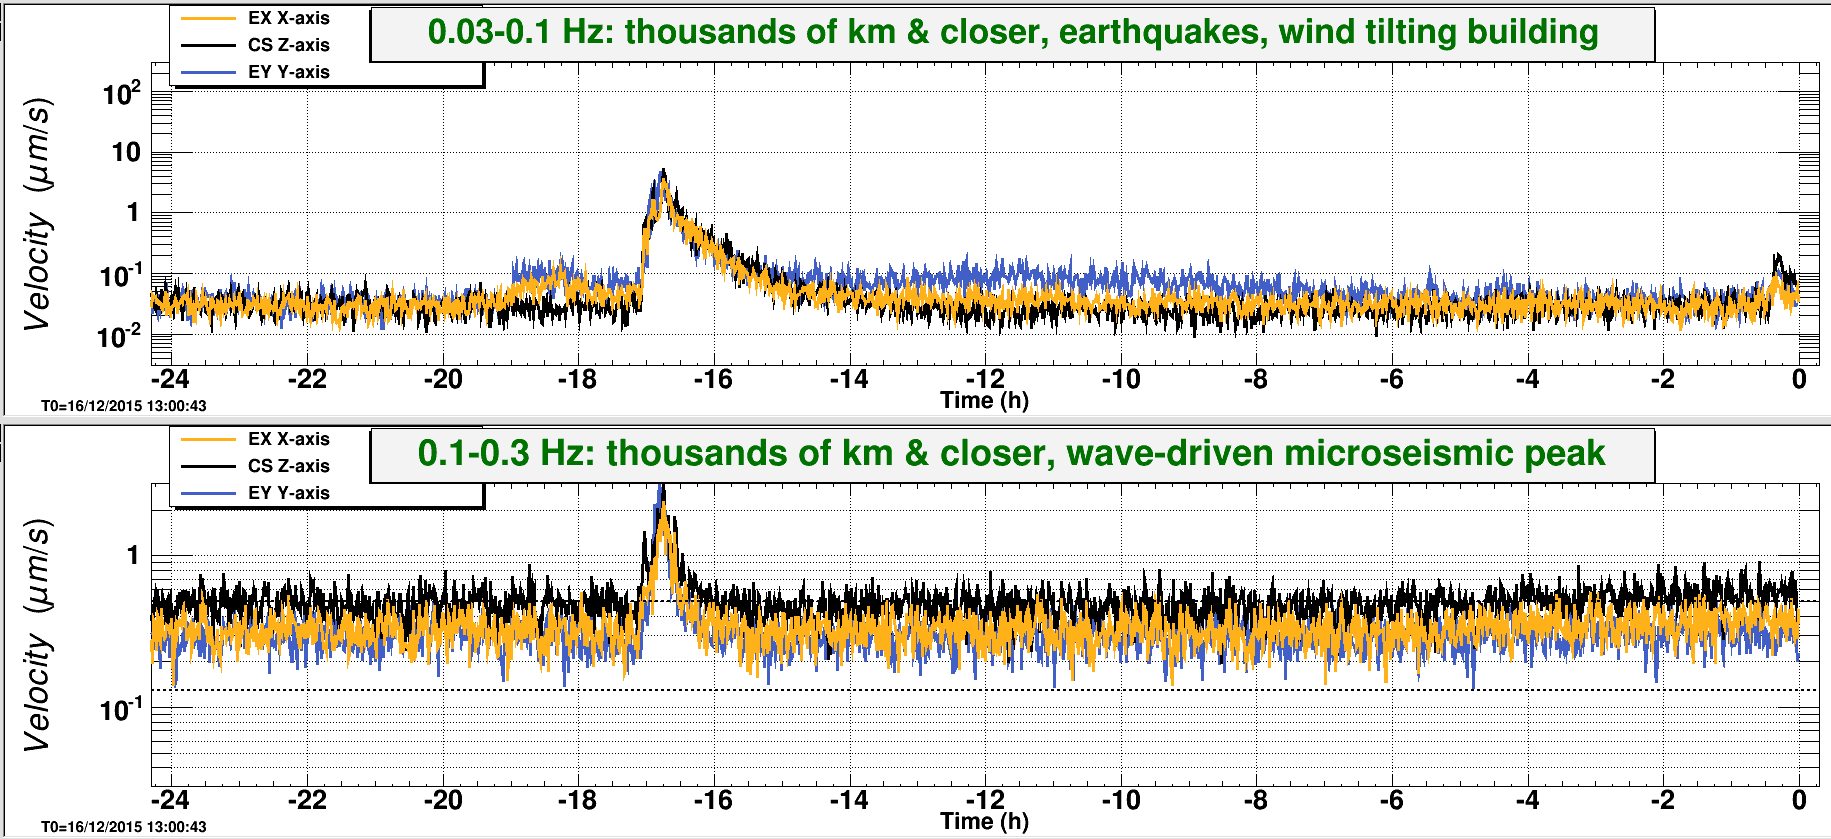
I noticed yesterday that the EX ISI Z performance was bad at low frequency compared to the other chambers. First plot shows each test mass chamber T240 Z spectra. Red is ETMX, blue is ETMY, green is ITMX, brown is ITMY. Around 10mhz ETMX is doing very poorly, it should look like ETMY, which is in a similar configuration. ITMX and ITMY look different because they are still running the 90mhz blends in Z, as Hugh logged a couple weeks ago, alog 24115. I immediately expected some component of the Z sensor correction on ETMX, because we use a broad band low frequency sensor correction whose gain peaking is in this frequency band, somewhat lower than the 45 mhz blend. I did an on/off comparison of the Z sensor correction (LLO was down, so I asked the Mike if looking at this was okay). Second plot is the ETMX Z T240 (dashed lines) and STS ground (solid) with Z sensor correction on (red) and off (blue). The dashed red shows the expected suppression of the microseism, but there is a whole lot of extra motion at 10 -50 mhz, the dashed blue shows that this disapperars when I turned the sensor correction off. That I've seen, none of the other BSCs see this, so I think the other filters are correct.
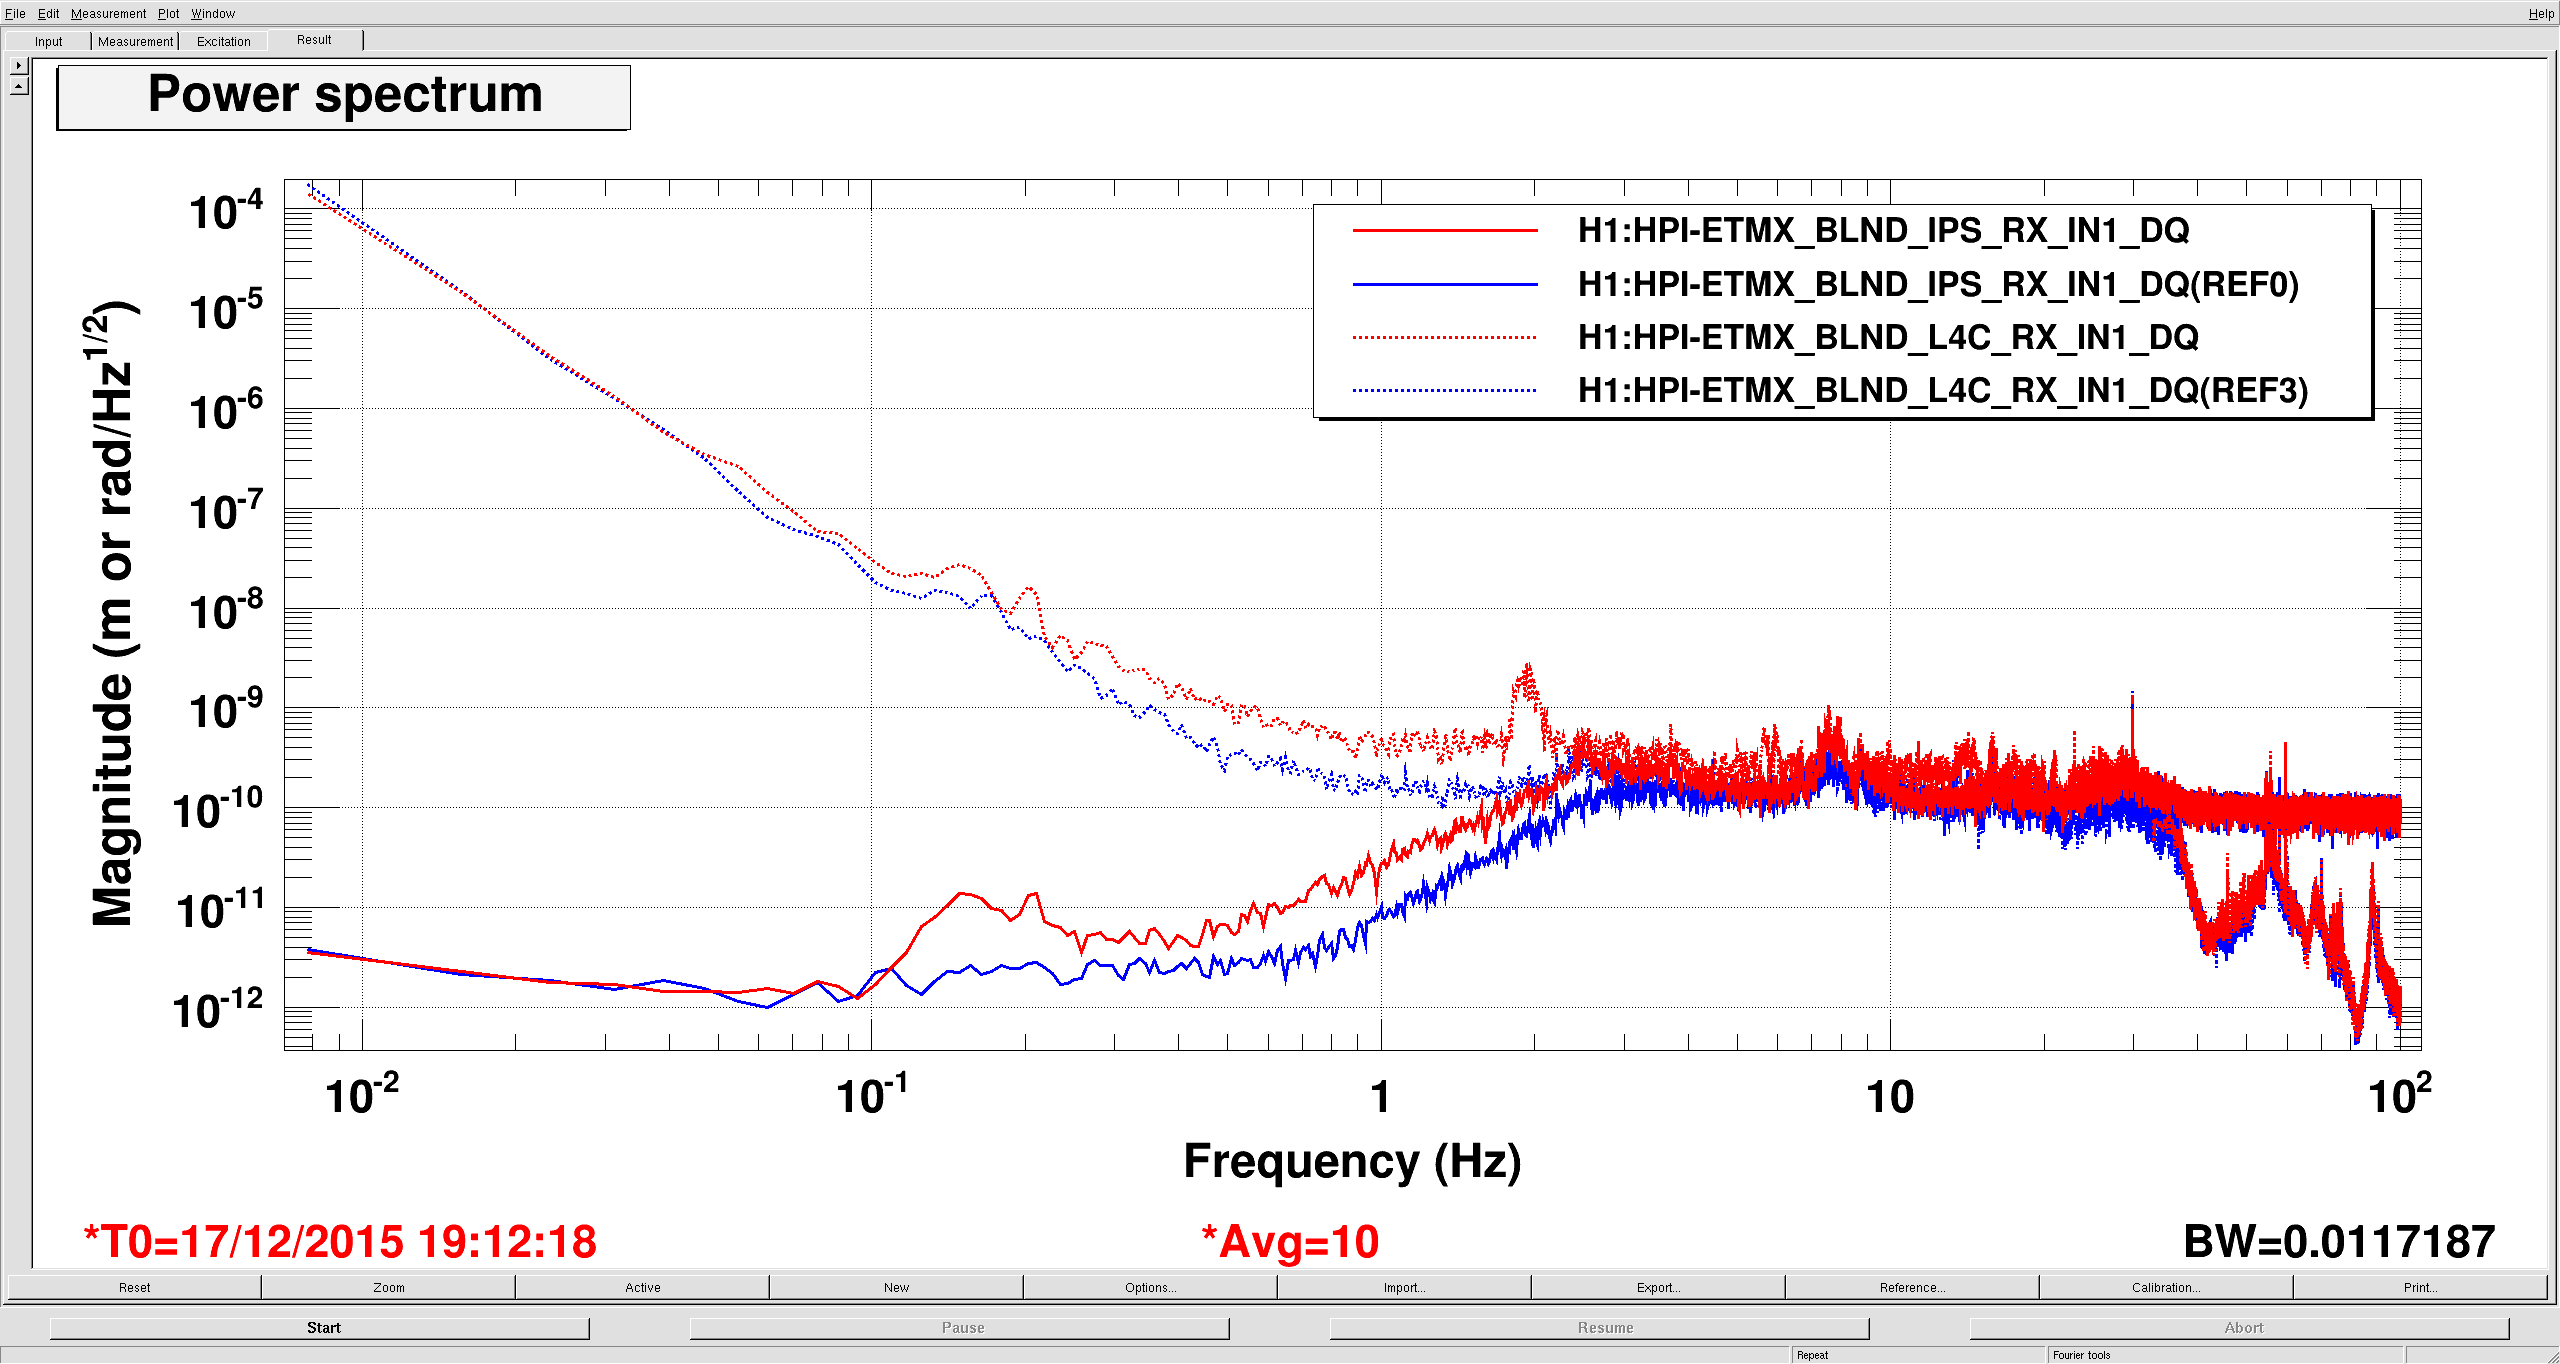
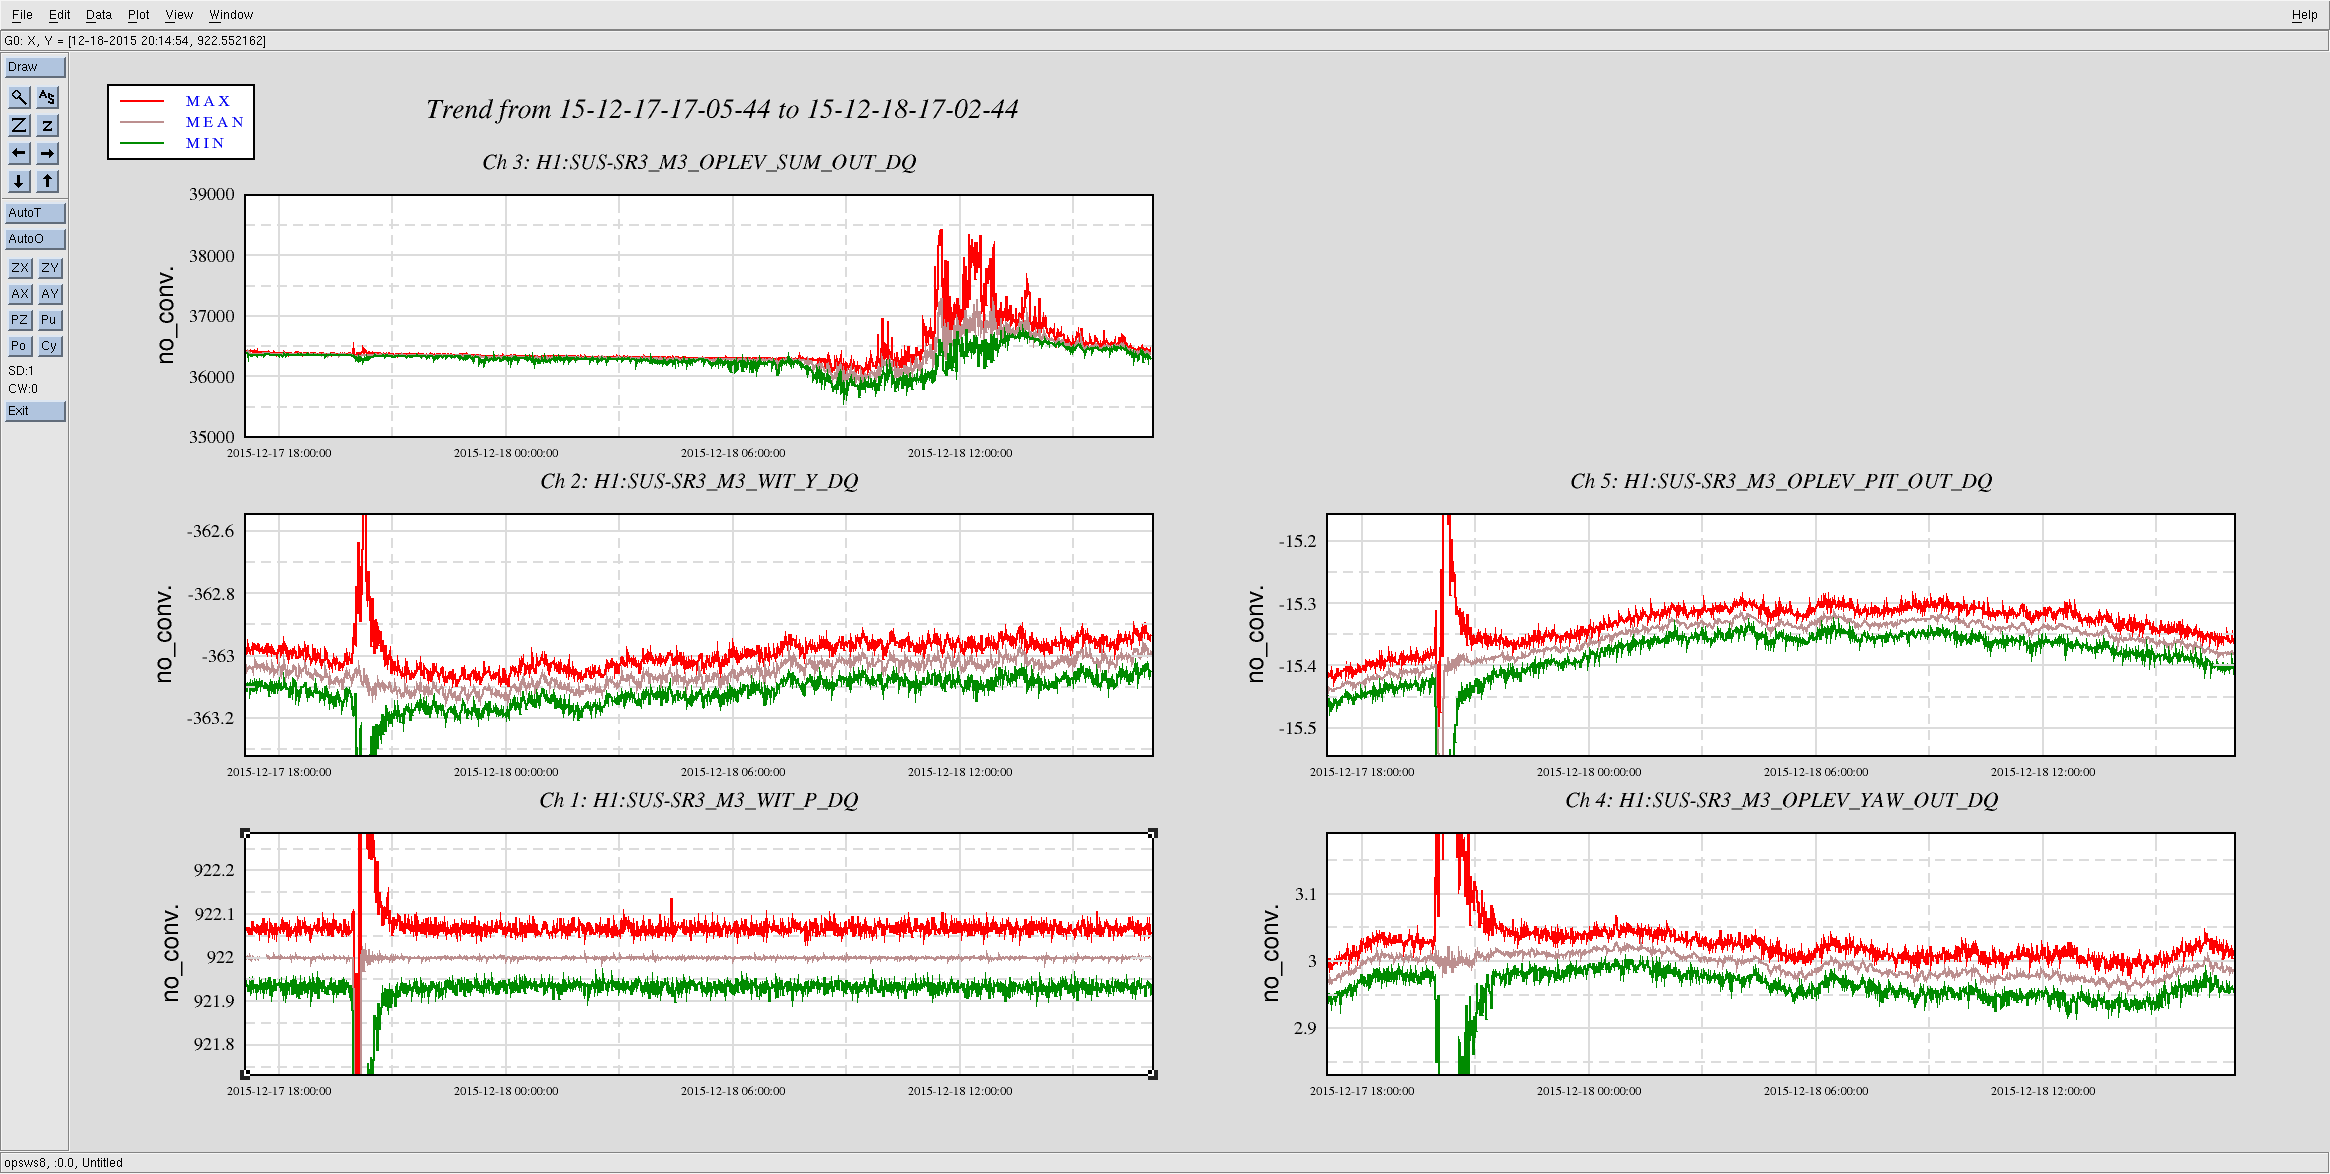
This extra motion is spilling over into other DOFs, mostly RX/RY. The third plot is HEPI IPS (solid) and L4C (dashed) RX, red is sensor correction on, blue is off. RY is similar, but it looks somewhat worse because these measurements were taking when the IFO was locked, so Tidal was running: the X low frequency motion looks really bad on HEPI because of this, RY probably sees some of that.
It's possible this is contributing to the EX ISI ringing up, but the extra RX/RY motion is a little too high in frequency. I've been watching ETMY CPS's today and ETMY X is rung up because of wind. Maybe we have noticed EX ringing up because winds have been mostly north south lately? Or maybe we just can't lock with EY rung up.
The filters are shown in my last plot. Red is the current filter, blue is what the other chambers are running. The gain peaking on red is ~20 at 15 mhz, the gain peaking on blue is ~10 at 30 mhz.


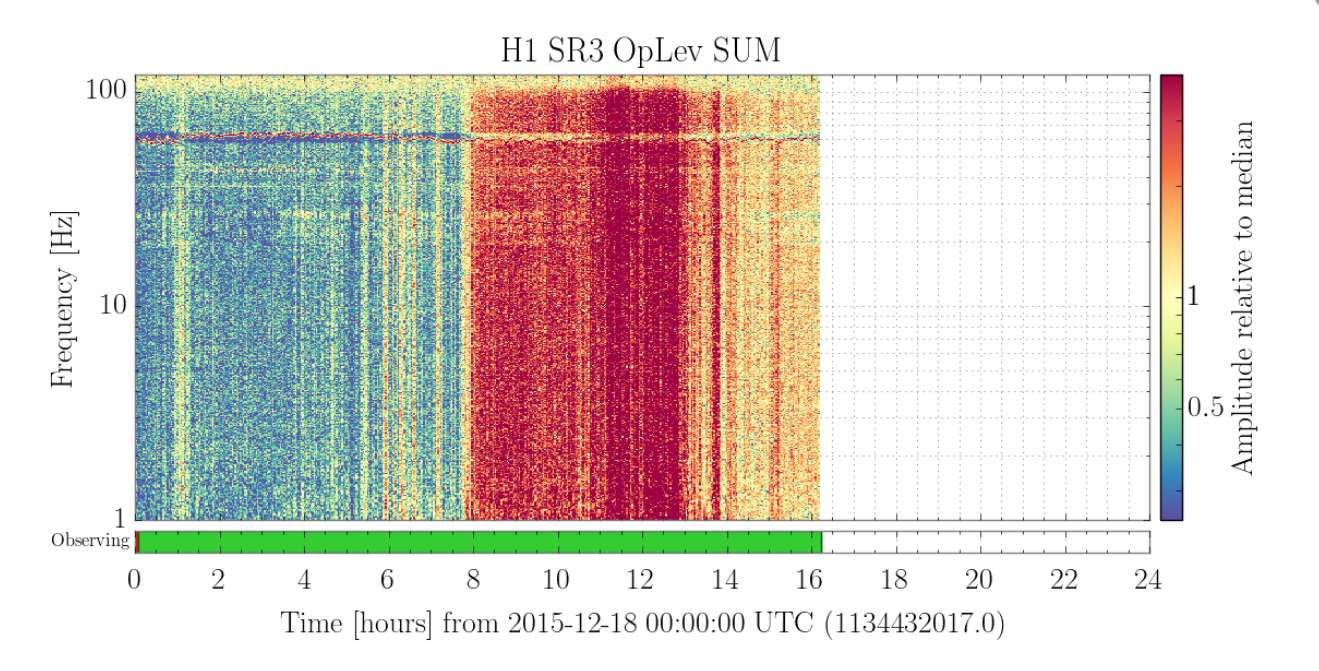

I saw the signal flatted out twice in a row. The lock wasn't broken. Same thing also happened twice during my shift last night. Is this problem becoming worse?
Also Ops computer and two other computers I've tried to logon to are equally VERY VERY SLOW. They're pretty much frozen. There's even a big gap when the verbal alarm was telling me time ("CURRENT TIME ------------- SOMETHING UTC") It took forever just to take a screenshot and attach it to this alog........ Let's hope the we don't lose lock because I don't know how to bring it back up with a frozen computer......
10:18 UTC I stepped out for a bit. Came back and saw a missed call. I don't know how to review the missed call number (sorry these wired phones are ancient technology to me. I will learn next time.). I'm back in the control room now.
The computers are better now.......