keith.riles@LIGO.ORG - posted 21:28, Wednesday 11 November 2015 - last comment - 13:11, Friday 13 November 2015(23334)
A look at the CW injection swept sine measurements
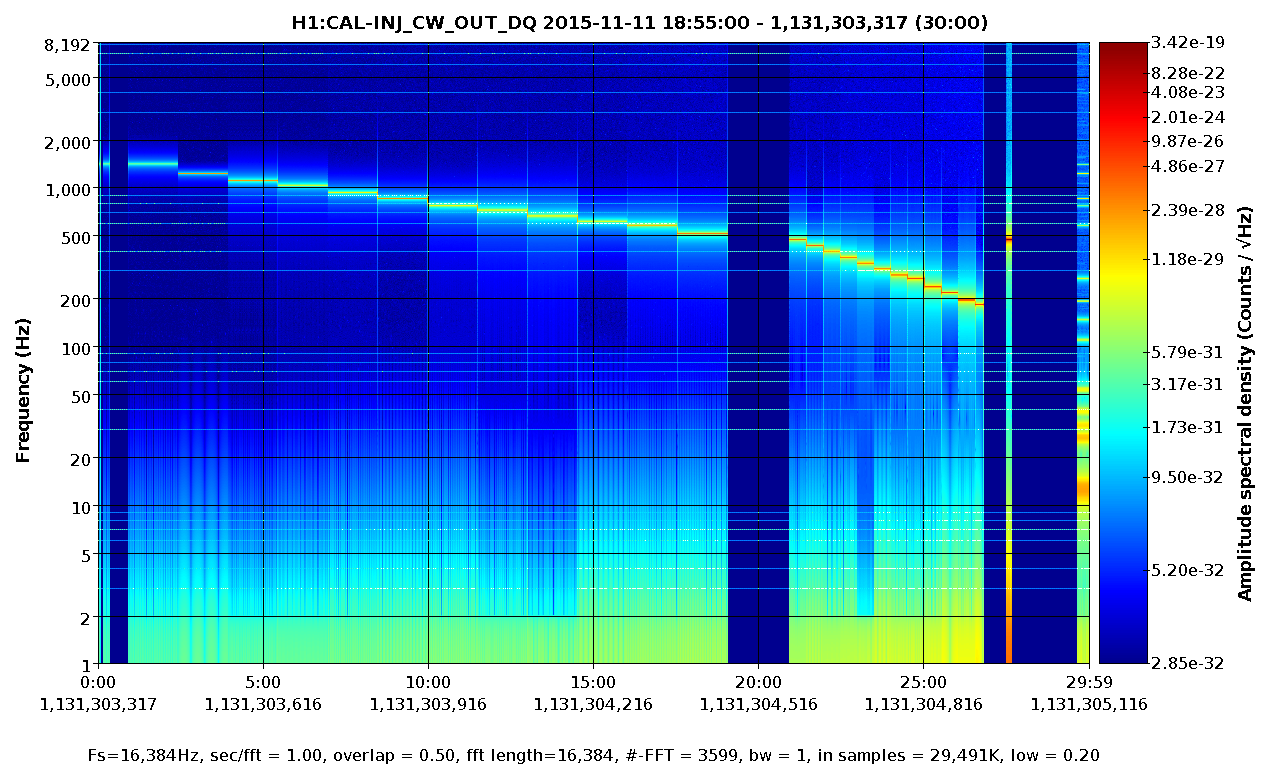
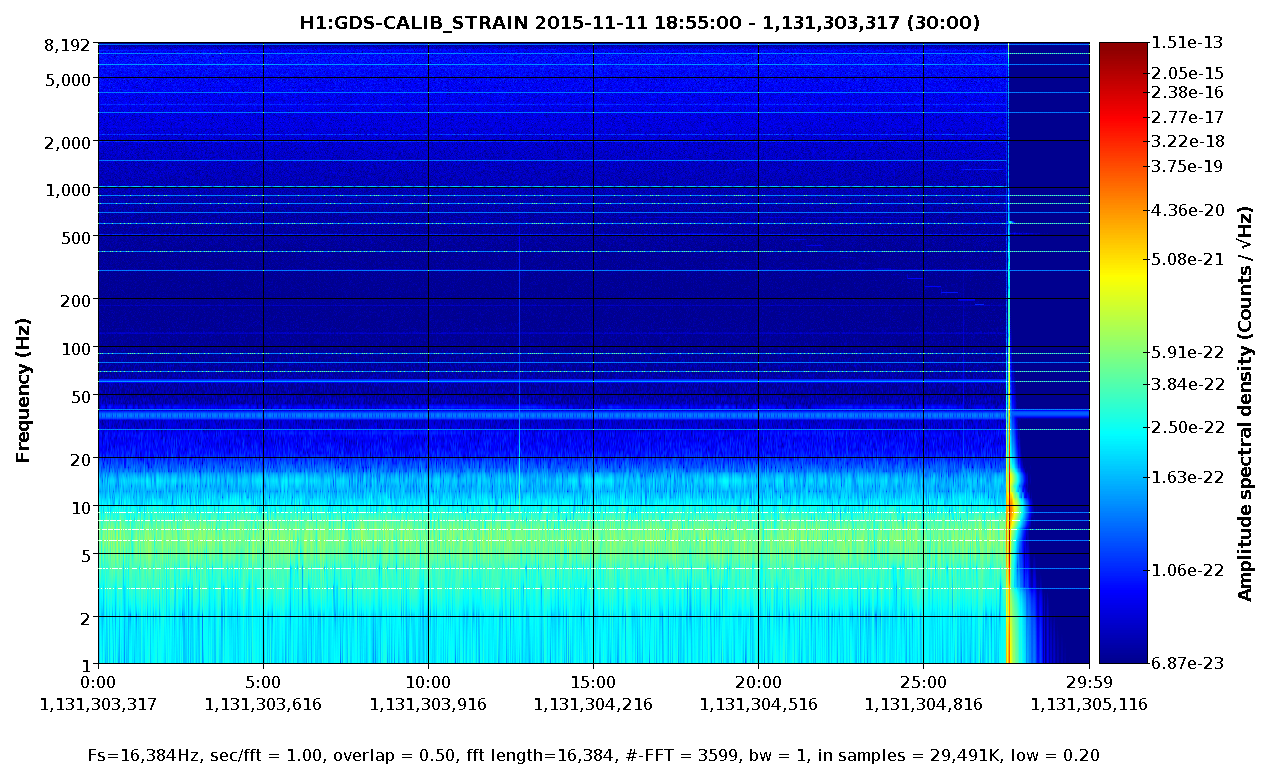
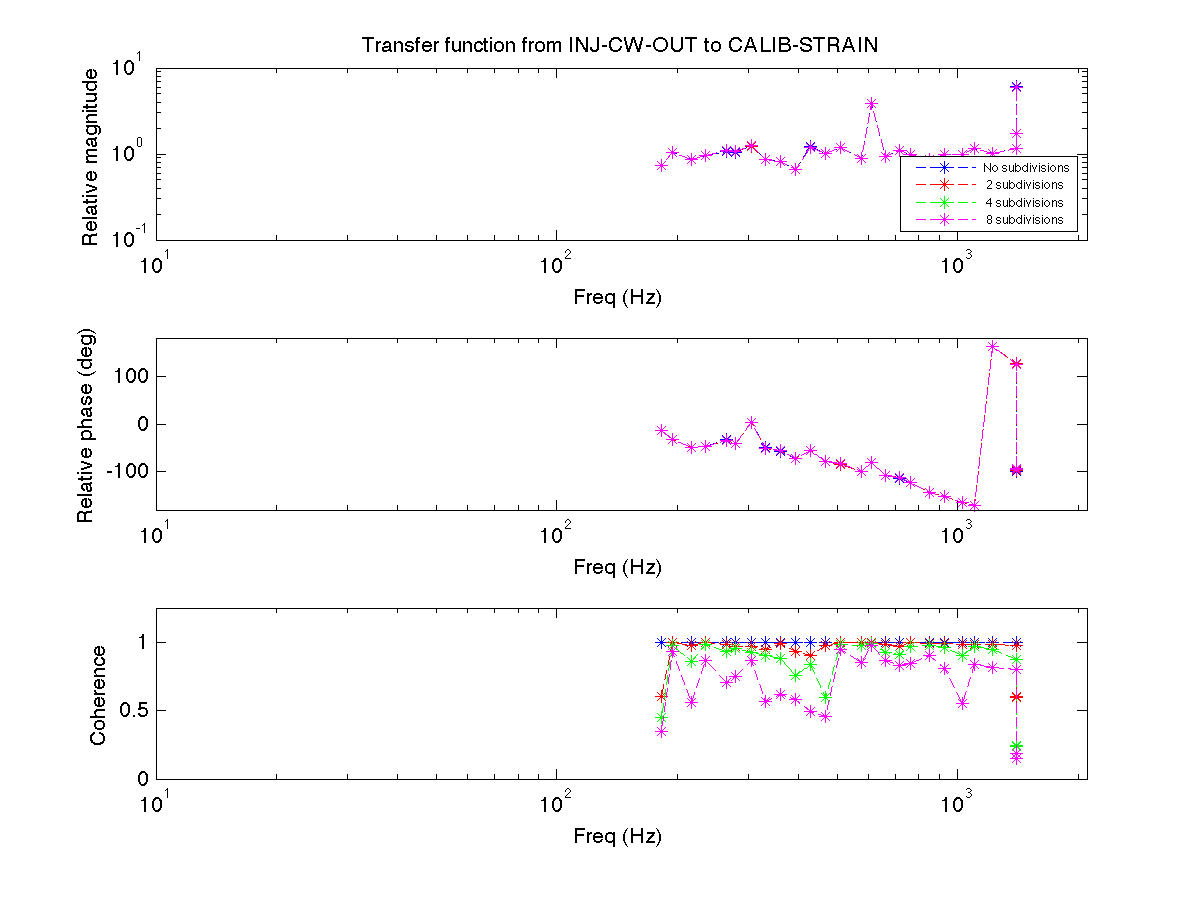
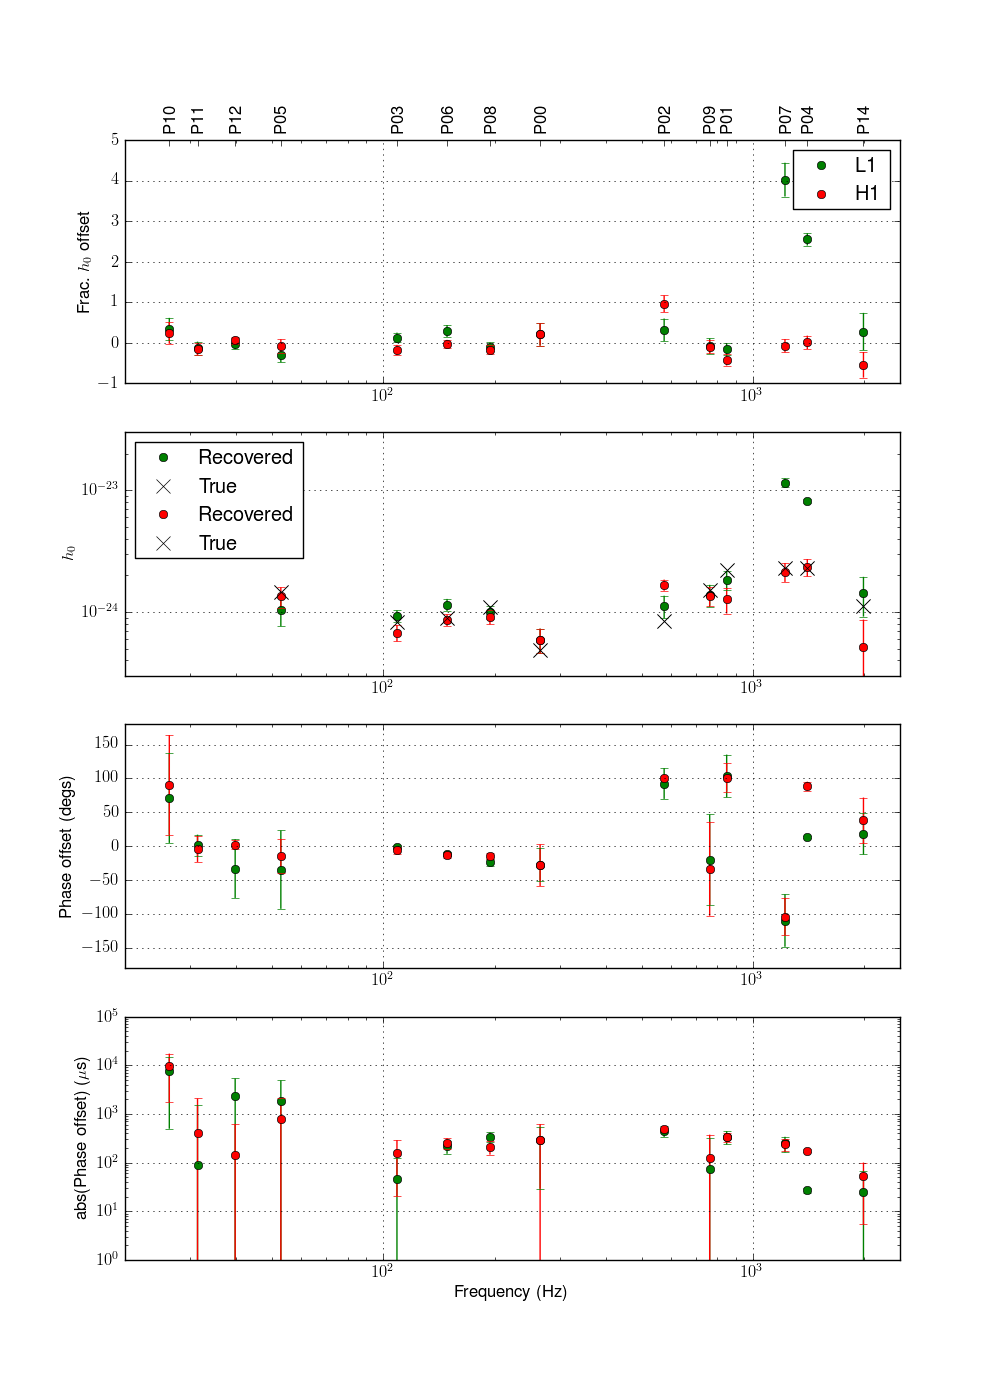
I took a quick look at the swept sine measurements Chris made earlier today, in order
to derive a transfer function from H1:CAL-INJ_CW_OUT to H1:GDS-CALIB_STRAIN,
using the same matlab script written recently to analyze L1 measurements>.

Attached are spectrograms of H1:CAL-INJ_CW_OUT and H1:GDS-CALIB_STRAIN for
the period of the measurements, along with the derived transfer function
(see LLO alog entry above for explanation of graphs). Although there is an
odd bump in magnitude response at 610 Hz (due to compensating for a notch
at a BS 2nd violin harmonic?), things are otherwise smooth between 200 and 1400 Hz,
albeit with phase wrapping at a bit more than 1000 Hz. This measurement seems
at odds with Matt Pitkin's CW hardware injections recoveries (summary plot attached), as is
the case for the recent L1 measurements.

On the one hand, one could wonder if perhaps the swept sine just isn't sampling the frequency range
finely enough to catch everything that affects the particular frequencies where CW injections
are made, especially given the complexity of the inverse actuation filter Jeff posted here.

On the other hand, the swept sine points were chosen to coincide almost exactly with
CW injection frequencies (575 and 849 Hz) for which discrepancies between injection
recovery and the transfer function measurements seem to occur.

Matt has double-checked and triple-checked the phase definitions he uses in
injection recovery. So the discrepancies in phase for pulsar 1 and 2 phase remain
mysteries (for both H1 and L1).

As discussed elsewhere, these lingering discrepancies suggest (to me, anyway) that we
should simplify CW injections either by using PCAL with its considerably simpler IAF
or by dispensing entirely with an IAF in the current ESD injection mode (i.e., rescale
each CW injection amplitude by the point value of the inverse of the measured
actuation function).

Figure 1 - Spectrogram of H1:CAL-INJ_CW_OUT
Figure 2 - Spectrogram of  H1:GDS-CALIB_STRAIN
Figure 3 - Derived transfer function from H1:CAL-INJ_CW_OUT tp H1:GDS-CALIB_STRAIN
Figure 4 - Summary of CW hardware injection recoveries
Images attached to this report
Comments related to this report
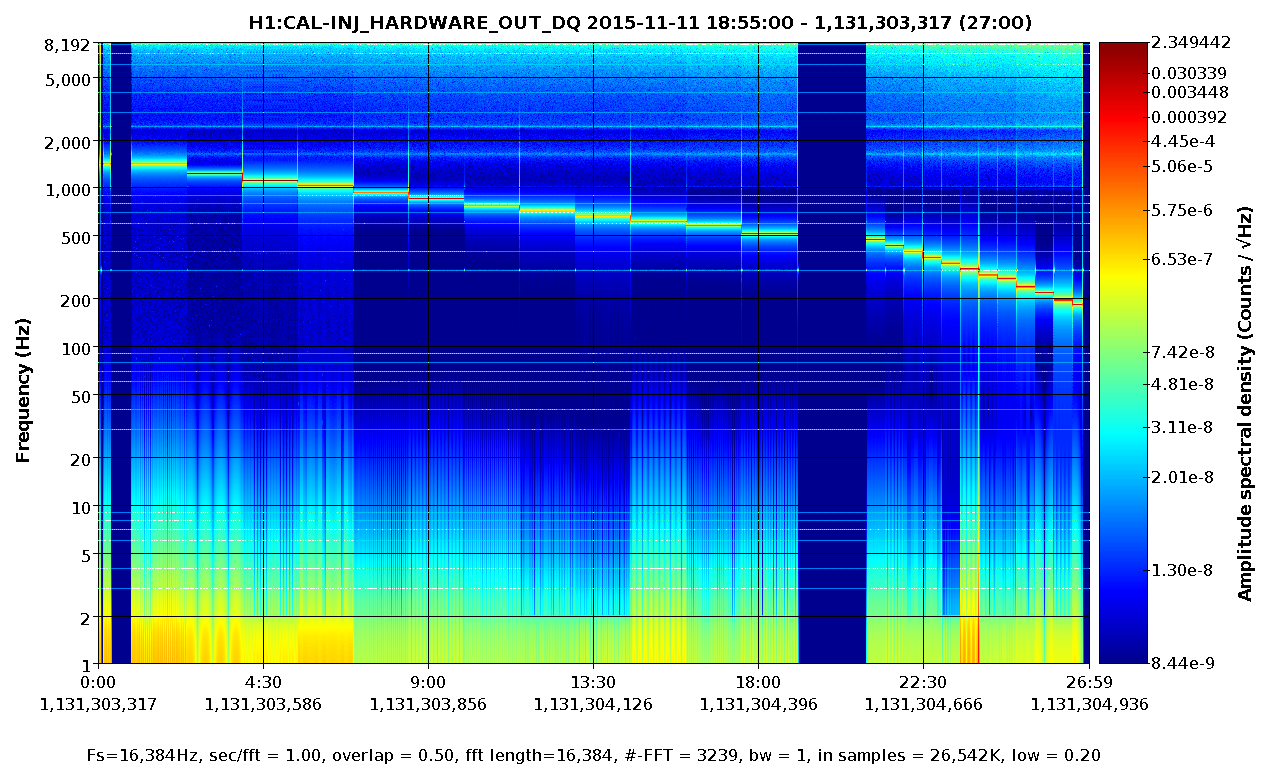
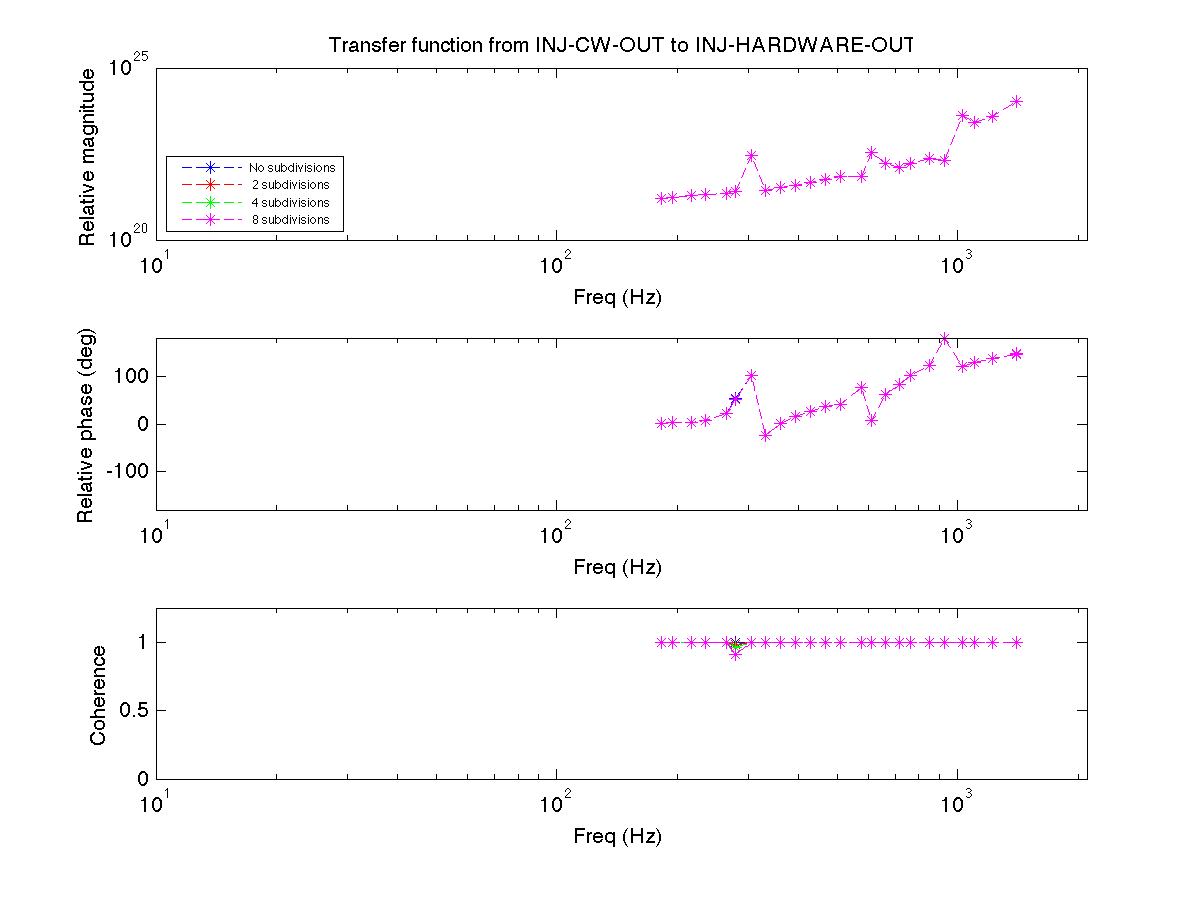
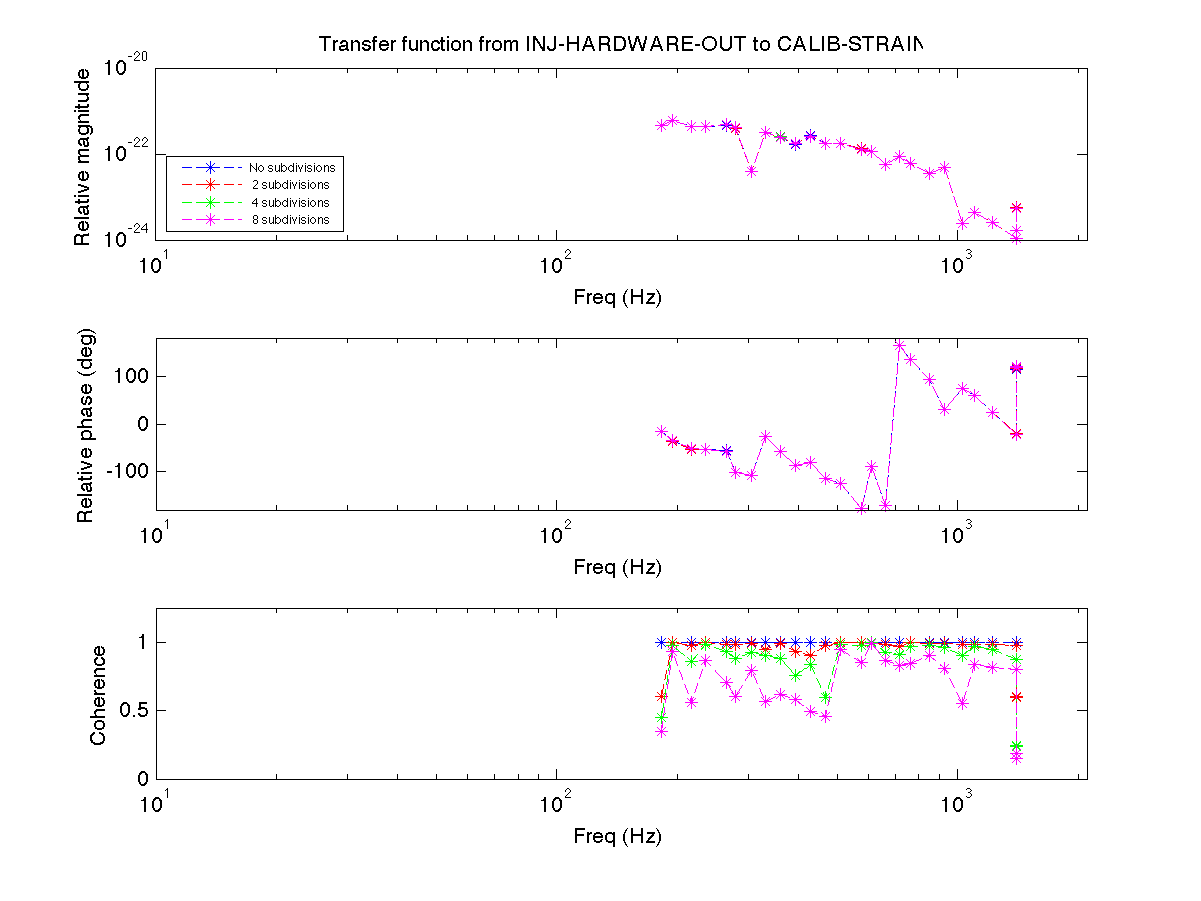
It occurred to me belatedly that looking at the intermediate injection
channel H1:CAL-INJ_HARDWARE_OUT might yield some insight into
the above transfer structure in the 500-1000 Hz range, where
it's hard to reconcile the measurements with CW hardware injections.

Figure 1 shows the spectrogram during the sweep sine for the channel.

Figure 2 shows the derived transfer function from CW_OUT to HARDWARE_OUT,
which should follow the shape of the inverse actuation filter.

Figure 3 shows the transfer function from HARDWARE_OUT to CALIB_STRAIN.

More detailed information on all three transfer function measurements
can be found on these web pages:

H1:CAL-INJ_CW_OUT --> H1:CAL-INJ_HARDWARE_OUT

H1:CAL-INJ_HARDWARE_OUT --> H1:GDS-CALIB_STRAIN

H1:CAL-INJ_CW_OUT --> H!:GDS-CALIB_STRAIN

Bottom line: there is non-trivial structure in the 500-1000 Hz band
that the swept sine may not be capturing adequately to allow reliable
comparison with injection recoveries.

Bottom bottom line: it's time to try moving CW injections to PCAL with
its simpler inverse actuation filter, as tentatively decided at yesterday's
injections team telecon.
Images attached to this comment