kyle.ryan@LIGO.ORG - posted 23:10, Tuesday 08 December 2015 (24065)
~2215 - 2250 hrs.local -> Kyle on site to refuel generator running at Y2-8
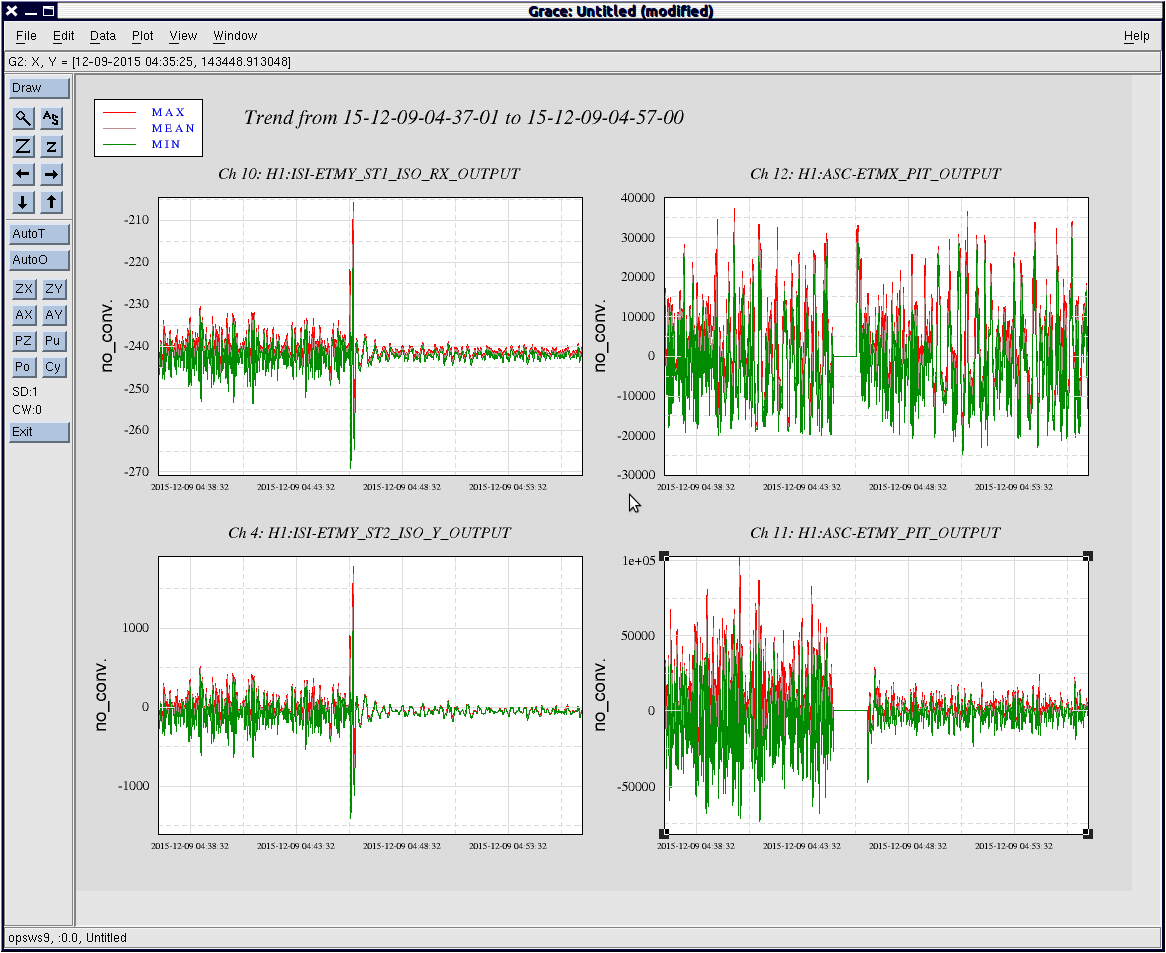
Evan Hall suggested changing ETMY ISI blend filters after a couple lock losses between DRMI and ENGAGE_ASC.
The change from all Quiet_90s to Quiet_90 in X direction, and 45mHz in Y direction was easilly seen on ST1_ISO_RX and ST2_ISO_Y, and the ASC control signal in pitch being sent to the optic, ASC-ETMY_PIT_OUTPUT.
Plot attached shows those channels before and after the blend filter change, and ETMX ASC control signal, to compare.
Current blend filter config. medm is also attached.
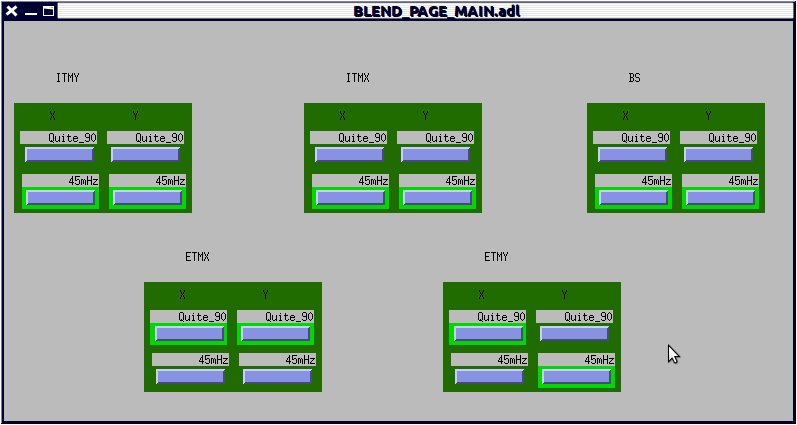
Why are the y blends set different from the X blends?
Over the past month or so, having the 45 mHz blends on EX causes the ISI to ring up in full lock (for example: alog 23674 and comments).
I have edited the ISC_LOCK guardian so that it now turns violin mode damping off before the interferometer reaches nominal low noise. This will hopefully allow us to collect ringdown data on the violin mode fundamentals.
Violin mode damping is still turned on as usual in BOUNCE_VIOLIN_MODE_DAMPING, but it now is turned off in the COIL_DRIVERS state. Thus the modes will still receive a few minutes of damping before DARM is switched to dc readout.
If this behavior needs to be reverted, there is a flag in the main() function of COIL_DRIVERS called self.turnOffViolinDamping which can be set to False.
Violin mode damping in full lock will be re-enabled once sufficient data have been collected.
Are there any observable results from this? For example, does this mean we will now see these on the running power spectrum on nuc3? And is this the reason we now have the red boxes on the violin mode medm on nuc0? I hadn't noticed the latter before, so I was wondering why these were flashing red.
Since turning the damping off, the violin mode fundamentals seem to appear on the DARM FOM at the level of 10−16 m/Hz1/2 or so. Before turning the damping off, they would eventually damp down below 10−18 m/Hz1/2 after a few hours.
I'm guessing this is why the violin mode monitors are red, but I don't know what Nutsinee set the monitor thresholds to.
Also, since writing the above alog I changed the Guardian code for turning off the damping. It is no longer executed inside an if statement; it's just executed directly in the main() function of COIL_DRIVERS.
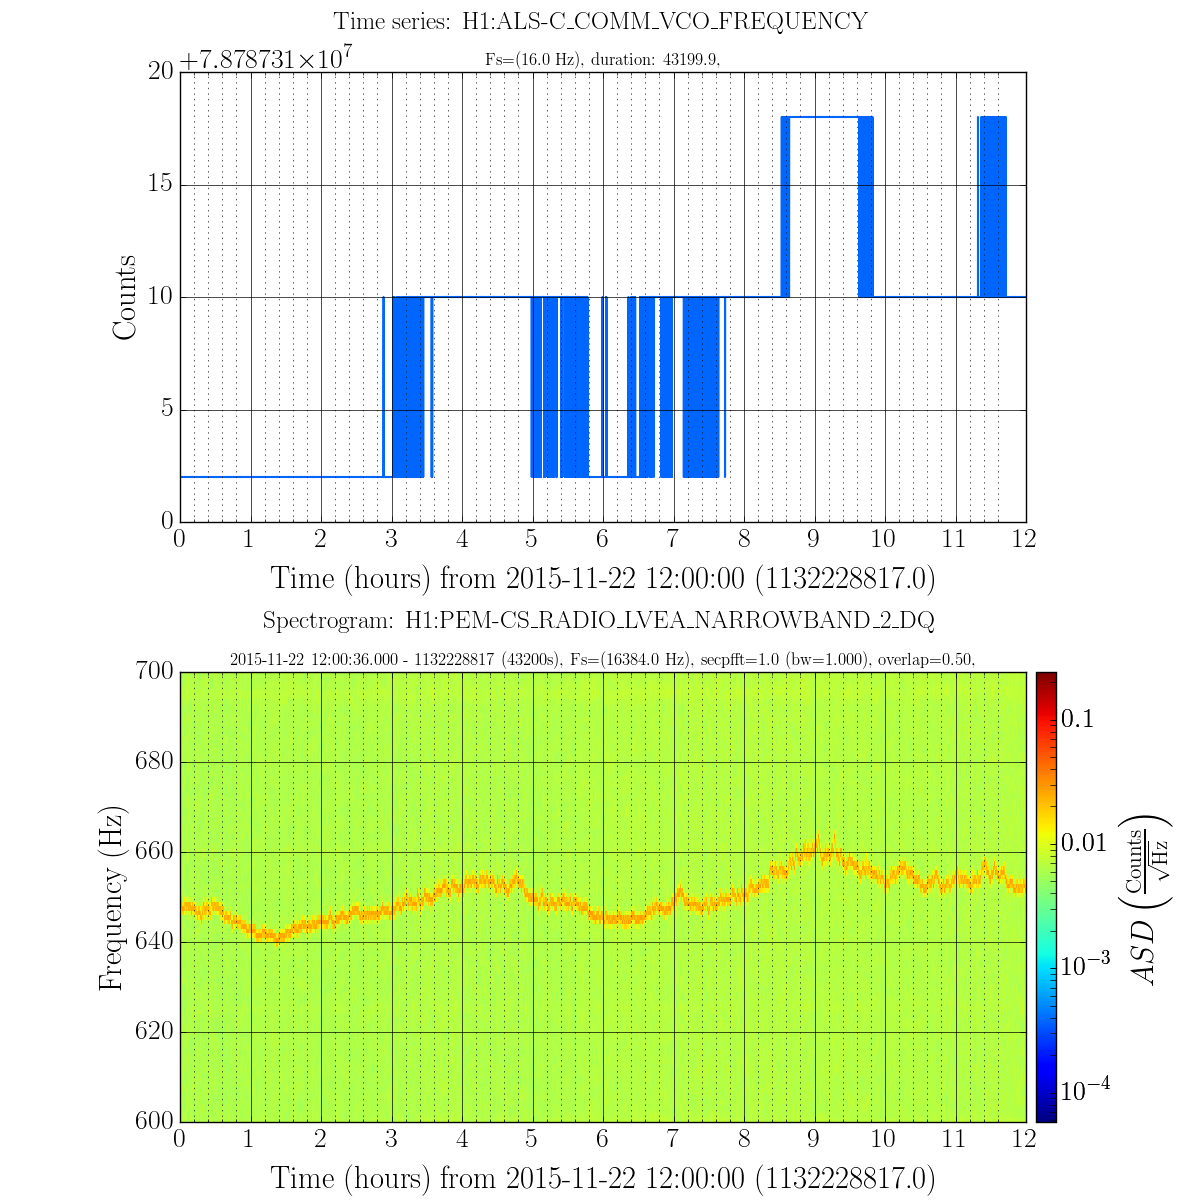
The mystery ~650Hz noise reported here and here also shows up in the PEM rf antenna (in both 9MHz and 45MHz located in CER and LVEA). Further investigation revealed that this peak shows up in the PEM antenna during lock aquisition at the start of the DC Readout Transition step (if it appears at all; it's not present in every lock--more on this later). At the start of this step the ALS COMM VCO is parked at some value.
To determine whether this VCO could be responsible for the ~650Hz noise, the frequency readback of the VCO was compared to the frequency of the mystery peak in the PEM antenna. Attached (figure 1) is a plot of H1:ALS-C-COMM_VCO_FREQUENCY timeseries on top and spectrogram of the PEM 45MHz LVEA antenna on the bottom. The frequency of the peak seems to track with the VCO frequency if you take into account the fact that the VCO frequency readback is digitized into steps of 8Hz (does anyone know why / can we fix this?).
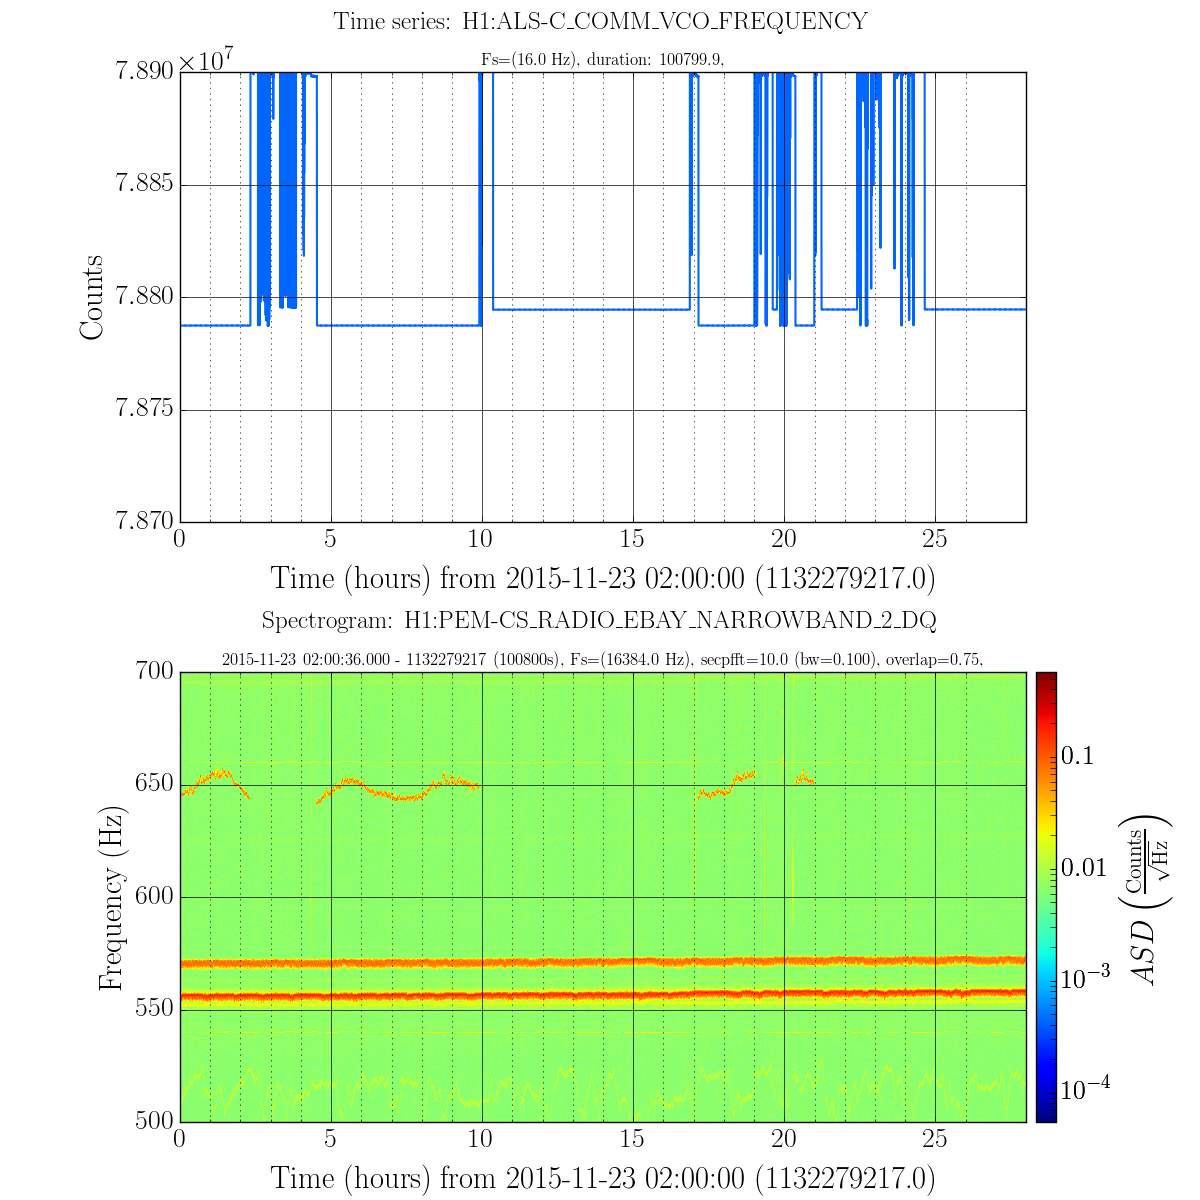
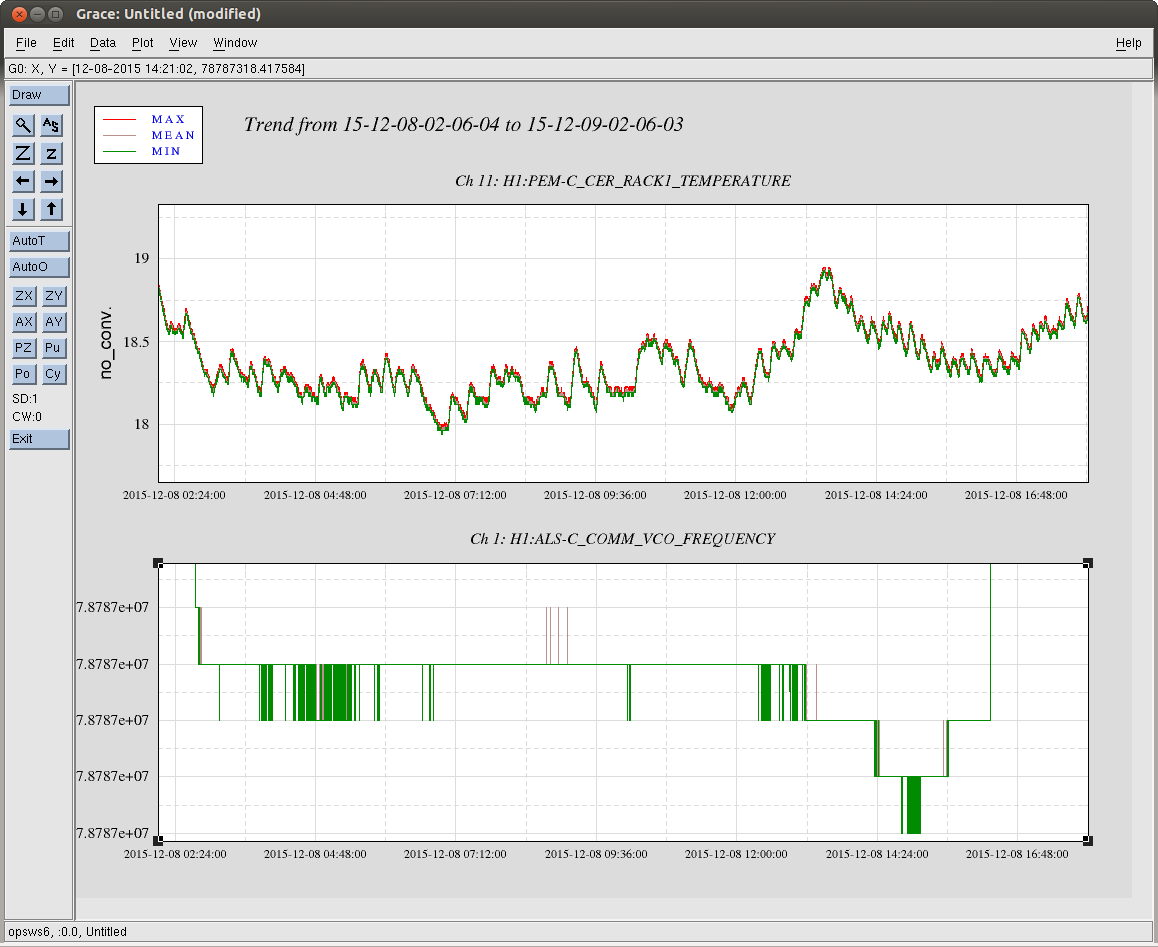
Also, there appears to be 2 different values where the VCO can be parked. Figure 2 has similar plots to figure 1, over a 28hr stretch which contained multiple locks where the peak was sometimes present. In locks where the peak was present, the VCO was set to ~78.7873MHz. For locks where the peak is not there the VCO was set to ~78.7944MHz. These values correspond with two different values of H1:ALS-C_COMM_VCO_TUNEOFS : ~-1.39 and ~1.25, respectively.
To test this, we tried moving the COMM VCO TUNE OFS slider with the IFO locked (before continuing to NLN / Observing). While initially it looked like the peak in the PEM rf channel moved as the slider was moved, the lock broke before we could conclusively tell. The lockloss occurred right as Sheila was moving the slider. We don't know why this should cause a lockloss, so this is a subject for further investigations (it was windy and ground motion-y at the time so it could have been a coincidence).
Also included (figure 3) is a plot of the VCO frequency (again, 8Hz digitization) and the CER Rack temperature. More data is needed, but it looks like the freqency trends down after the temperature rises.
Finally, there is still the question as to why this is showing up in the 9MHz and 45MHz channels (and, ultimately, DARM). As a first check, I compared 9.100230 MHz and harmonics to 78.7873 MHz and harmonics to see if a beat would show up within 600 Hz. Out to 10 harmonics of the VCO frequency the closest they came to each other was 200 kHz--still a mystery.
Jordan, Robert, Sheila
8Hz is the single precision rounding, so somewhere somebody is casting the number to single. Bekhof code?
VCO frequency is about 80MHz, and 8e7=(1+fractional)*2^26 (fractional is about 0.1921, but that's not important).
Single precision number uses 23 bits for fractional. For any number in [2^26, 2^27) range, the least significant bit is 2^-23 * 2^26 = 8.
EPICS values are fine, so this is a problem of DAQ/NDS/DV.
Channels are double-precision in the front end, but stored as single-precision in the frames. Maybe Jordan was getting this data from the frames/NDS2, rather than live, so that's why there's this quantization error?
Ops Eve Shift: 00:01-08:00UTC (16:00-23:59PT)
State of H1: locked in Observe
Help: Jenne, Sheila, Evan
Details:
Site:
We've been having difficulty locking this afternoon (microseism around 0.6 um/sec rms, winds consistently gusting up to 35-40mph at times up to 50mph), the locklosses seem fairly typical of the type that plauge us with high ground motion when we are locked on TR_CARM and ALS_DIFF, see alog 22211
These locklosses seem to be caused by some kind of glitch that happens only while ALS is on DIFF. I had a look at the LLO guardian and talked to Adam, who doesn't think that LLO has this problem. There seem to be three differences in the way that we do this step compared to LLO: they ramp the CARM offset much faster (3 seconds for the whole thing vs 25 seconds here), they don't run a servo to ALS diff from AS45Q durring this step, and I believe that they go to a lower CARM offset before they switch DARM from ALS to AS45Q if I'm interpreting the normalizations correctly.
For now I just sped up the ramp times a good deal, reducing both the 15 second ramp in reduce CARM offset and the 10 second ramp in SWITCH_TO_QPDs with 3 second ramps. This seems to be a bit better, I think that it has worked 3 out of 5 times that we have tried it in the last few hours, which was better than earlier in the day. For now I will leave this in.
There were some testpoints left open on h1sustmsx,y and h1pemey, I have cleared these.
In the past hour a partial fm load of susetmx was done (ETMX_L3_OPLEV_YAW). The filter file for etmx was last modified 29th Oct, so no new filters were in fact loaded. No one in the control room knew why this had happened, so I did a full load to remove the partial load string. I checked that no filter archive file was generated since the source file was not modified.
Rotating pumps and diesel generator will be running continuously until Friday -> I'll be out to refuel the generator tonight.
TITLE: Dec 8 DAY Shift 16:00-00:00UTC (08:00-16:00 PDT), all times posted in UTC
STATE Of H1: Commissioning
SUPPORT: Sheila, Hugh, TJ, Evan, Jenne
LOCK DURATION:
INCOMING OPERATOR: Cheryl
SHIFT SUMMARY: After maintenance day, winds picked up, sometimes in excess of 45 mph. Locking has been tedious and not gotten past ASC part_3.
ACTIVITY LOG:
15:55 Tv crew is on site
16:00 Christina and crew will start at End-Y
16:03 Jeff B out to LVEA. pulling vacuum plumbing for dust monitors along input arm. Mitch will be joining him when he arrives
16:04 Bubba is going to LVEA to inspect the supports on the crane/snorkel lift
16:10 Richard testing phones at out buildings. Will be calling ops to confirm numbers.
16:12 Schofield and Jordan out to CER.
16:21 Jodie 3IFO Storage monitoring
16:21 Gerardo out to LVEA to replace annulus ion pump on Y manifold.
16:25 took IMC down for Hugh to do some Guardian/ISI work HAM2/3 WP5640
16:28 Betsy into LVEA
16:41 Karen called from End-Y to report water on floor under pump in the mechanical room. John is going to investigate.
16:44 Fill out to LVEA to survey for a future cable run
16:45 Cleaning crew donw at Y heading to X
16:46 Richard is done with phones.
16:56 Jodi is done in LVEA
17:00 Joe returning a hose into the LVEA.
17:03 Travis out to LVEA to join Betsy.
17:04 Port-o-let service on site
17:05 GW/EM Test alarm received
17:11 Betsy called from LVEA. HWFS team can begin.
17:11 Richard out to join Fil in LVEA
17:15 Karen called from End-X. Lights not turning on.
17:23 HFD on site.
17:25 Kyle headed to Y-2-8 to start generator
17:35 Fil and Pete pulling a cable or two on the input arm and also around HAM4. WP5644
17:43 John and Bubba to EX and then EY. Water damage will have the lights down at EX until further notice.
17:46 Betsy into LVEA to check on maintenance work progress.
17:56 Hugh headed out to Ends to do weekly HEPI fluid checks.
18:14 re-locked IMC
18:15 Chris out to join crew at End-X
18:15 Alistair arrived on site
18:20 Jason reset the PSL WD
18:28 Hugh back from HEPI checks at End Stations
18:45 Hugh finished doing HEPI fluid checks.
18:52 Hugh into LVEA looking for 3IFO parts
18:56 Gerardo finished with annulus pump. Aux cart will stay on until noon.
18:58 CDS WP5637 executed.
19:04 Coca-Cola on site.
19:05 Hugh back from LVEA
19:24 Bartlett to End-Y to take pictures.
19:40 Cleared L4C saturation accumullators.
19:42 Jodi heading into LVEA to check equipment (scope) for auditor.
20:00 Jeff B doing LVEA sweep.
20:10 Begin Initial Alignment
20:20 Gerardo exits LVEA and turns out lights. Richard headed out for a minute before I move on.
20:23 Begin full Locking sequence.
20:35 Kyle heading back down from Y-2-8 arm.
21:43 switching to 90mHz blends in corner after many failed attempts w/high winds.
21:51 Kyle driving out to Y-2-8 again.
22:02 Switched corner back to 45mHz blends and changed ETMX to 45 on axis and 90 off axis. ETMY has been configured this way the whole time. Wind speeds seem to have decreased slightly at EX.
23:00 after many failed attempts, this has been put in the commissioner’s hands.
Removed and replaced the ion pump for YBM (HVE-LY:75IPBM_II186), this pump had the old style connector which we do not use anymore, so the cable was replaced too.
Aux cart was running until 20:00 utc, started around 17:00 utc to pump out annulus system.
As I posted yesterday (LHO alog 24028) HAM2 and HAM3 were consistently tripping when the Guardian switched the GS13s to High Gain after the completion of the Isolation process. I speculated (like I always do) alot about why this was happening and it was not a problem on the other three HAMs; well actually we aren't switching HAM6 so maybe I need to rethink my space. Anyway, this morning TJ and I investigated what guardian was doing and I have the following observations.
When the switch GS13 gain was disabled (ISOLATION_CONSTANTS['SWITCH_GS13_GAIN'] = False,) the ISI would isolate just fine. The gains could then be switched manually, with the old ISI scripts, or the guardian.
I did not try the manual method of just clicking the filters. Executing the GS13 !HI button on the ISI COMMANDS medm successfully switched the GS13s without tripping the ISI, as it did yesterday. And now here is the really interesting thing:
I had assumed the switching problem was caused by the timing of the switching, just after completing the isolation and the platform is driving to the Target Locations. By disabling the Guardian switching I could switch after it was done and not be a problem; this was the case using the COMMAND HI button.
After getting the ISI isolated with the GS13S still in Low Gain, I changed the GS13 Gain Switch to true and when I loaded this, the Guardian switched the blends and the platform tripped. Looking at the log, it would appear the guardian is not doing anything else other than switching the gain filters. So, at least for HAMs2 & 3, the way the guardian is switching the gain is the problem and not necessarily the timing of the switching.
Maybe if we could get the GS13 switching to do the same as the COMMAND script we would not be searching for why HAM2 & 3 behave differently than HAMs 4 & 5.
TJ & Hugh--WP 5640
This is a copy of SEI log 893.
I installed the new Guardian code at LHO 24 Nov (LHO aLog 23695) and tested it on a few chambers. Yesterday, we had a big EQ which tripped most ISI platforms (LHO alog 24007) and we saw that HAM2 & 3 had difficulty isolating--trouble with the GS13 switch. I'll talk about that separately but that issue led us to investigate more closely this morning (this WP) about the GS13 switching. We worked on HAM3 and LVEA activity tripped HAM4 ISI allowing us to confirm observations there too.
In SEI log 862 Hugo itemizes the modifications:
[1]The GS13 gains are switched at the following points of the guardian sequence:
a) Switch GS13s to low gain at the end of the damping process
b) Switch GS13s to high gain at the end of the isolating process
c) Switch GS13s to low gain at the beginning of the de-isolating process
2) automate the feedforward path on/off switch:
d) Turn ON the feedforward switches at the end of the isolation process
e) Turn OFF the feedforward switches at the beginning of the de-isolating process
And this is just what is done. However, the process of the way the guardian works or Hugo's particular implementation of this, and my acceptance of Hugo's verbiage above causes difficulties.
1c and 2e should be included immediately after watchdog trip, they do not switch:
If the ISI trips rather than being explicitly deisolated, the FF path is never turned OFF, and, the GS13s are not switched to low gain until after DAMPING step is complete.
1a should be done before doing anything, not at the end of damping. I'm not sure where to do this but 1a should really only be processed when coming up from a FE restart especially if the above is satisfied but otherwise should be executed as soon as possible. If things work right, the GS13s being in low gain will be the safe.snap state and will start low.
Problems--1) the FF path is basically never turned off. It is not turned off in the up process (it should not need to be) and should be turned off as soon as the Watchdog Trips.
2) The GS13s need to move to low gain in the Watchdog trip process, otherwise, the watchdog is trying to be cleared while the GS13s are still in high and are tripping more. We want to get the platform damping again as soon as possible and the watchdog will successfully untrip sooner with the GS13s in low gain.
My apologies to Hugo and all for not explicitly expressing the need to have the switching done during trip condition although I assumed de-isolation was a consequence of tripping. It is not. And also for seeing the "Switch GS13s to low gain at the end of the damping process" and not reading that close enough.
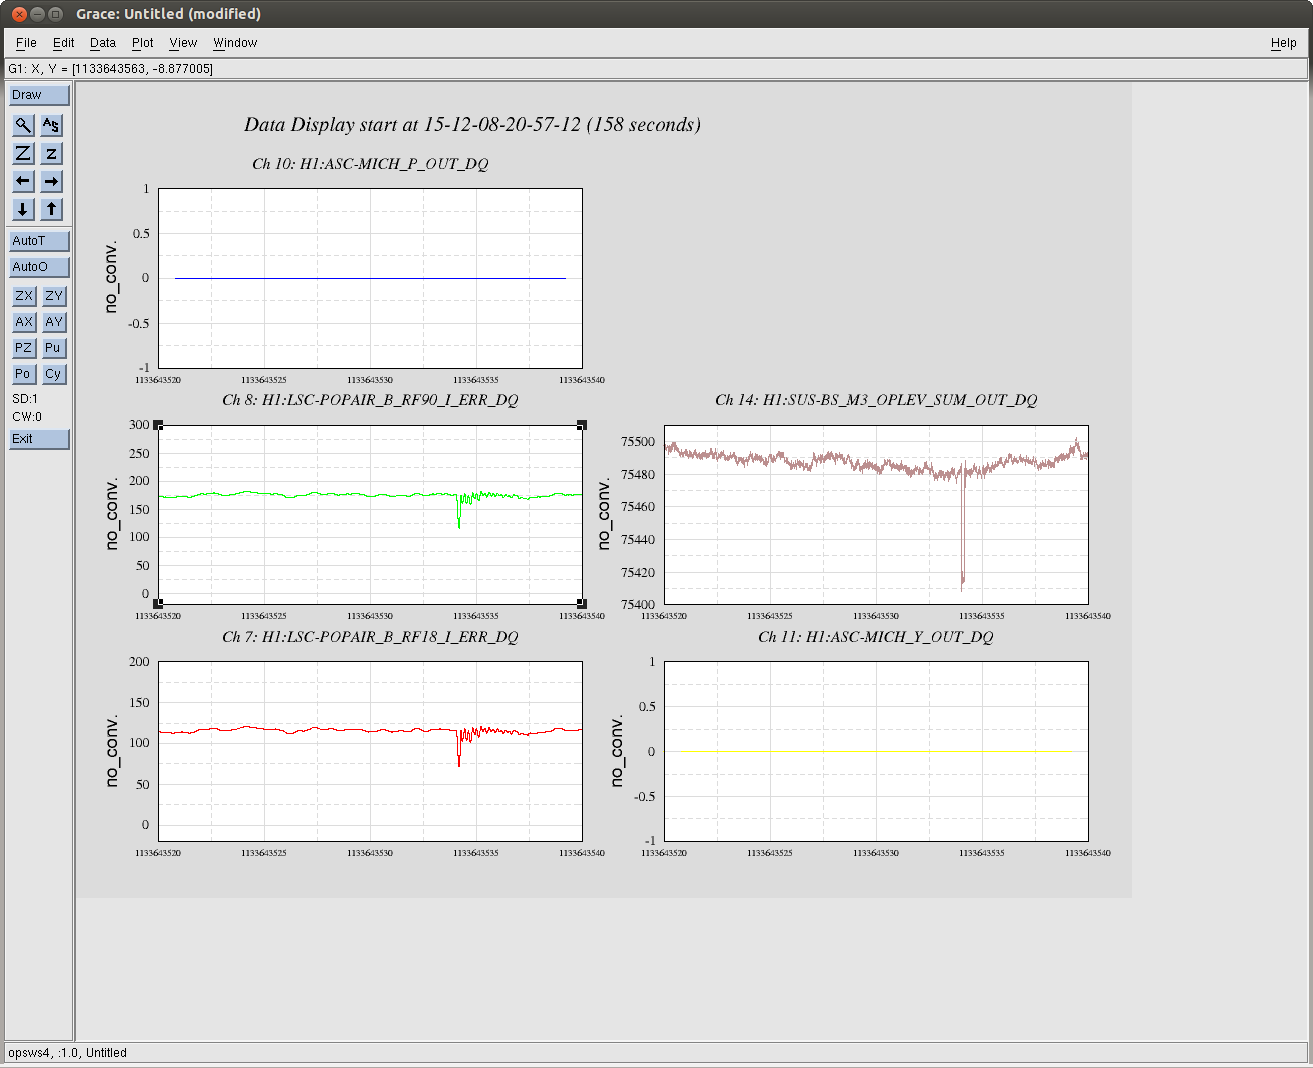
From time to time we see some big glitches when DRMI is locking, and it seems likely that some of the time these things cause locklossess. We sometimes wonder if this is a problem with a glitchy osem, especially when we are having difficulty locking.
Here is an example of this happening, DRMI survives. In this case at least it was the BS oplev glitching, as you can see the sum drops at the same time that there are drops in the DRMI build ups.
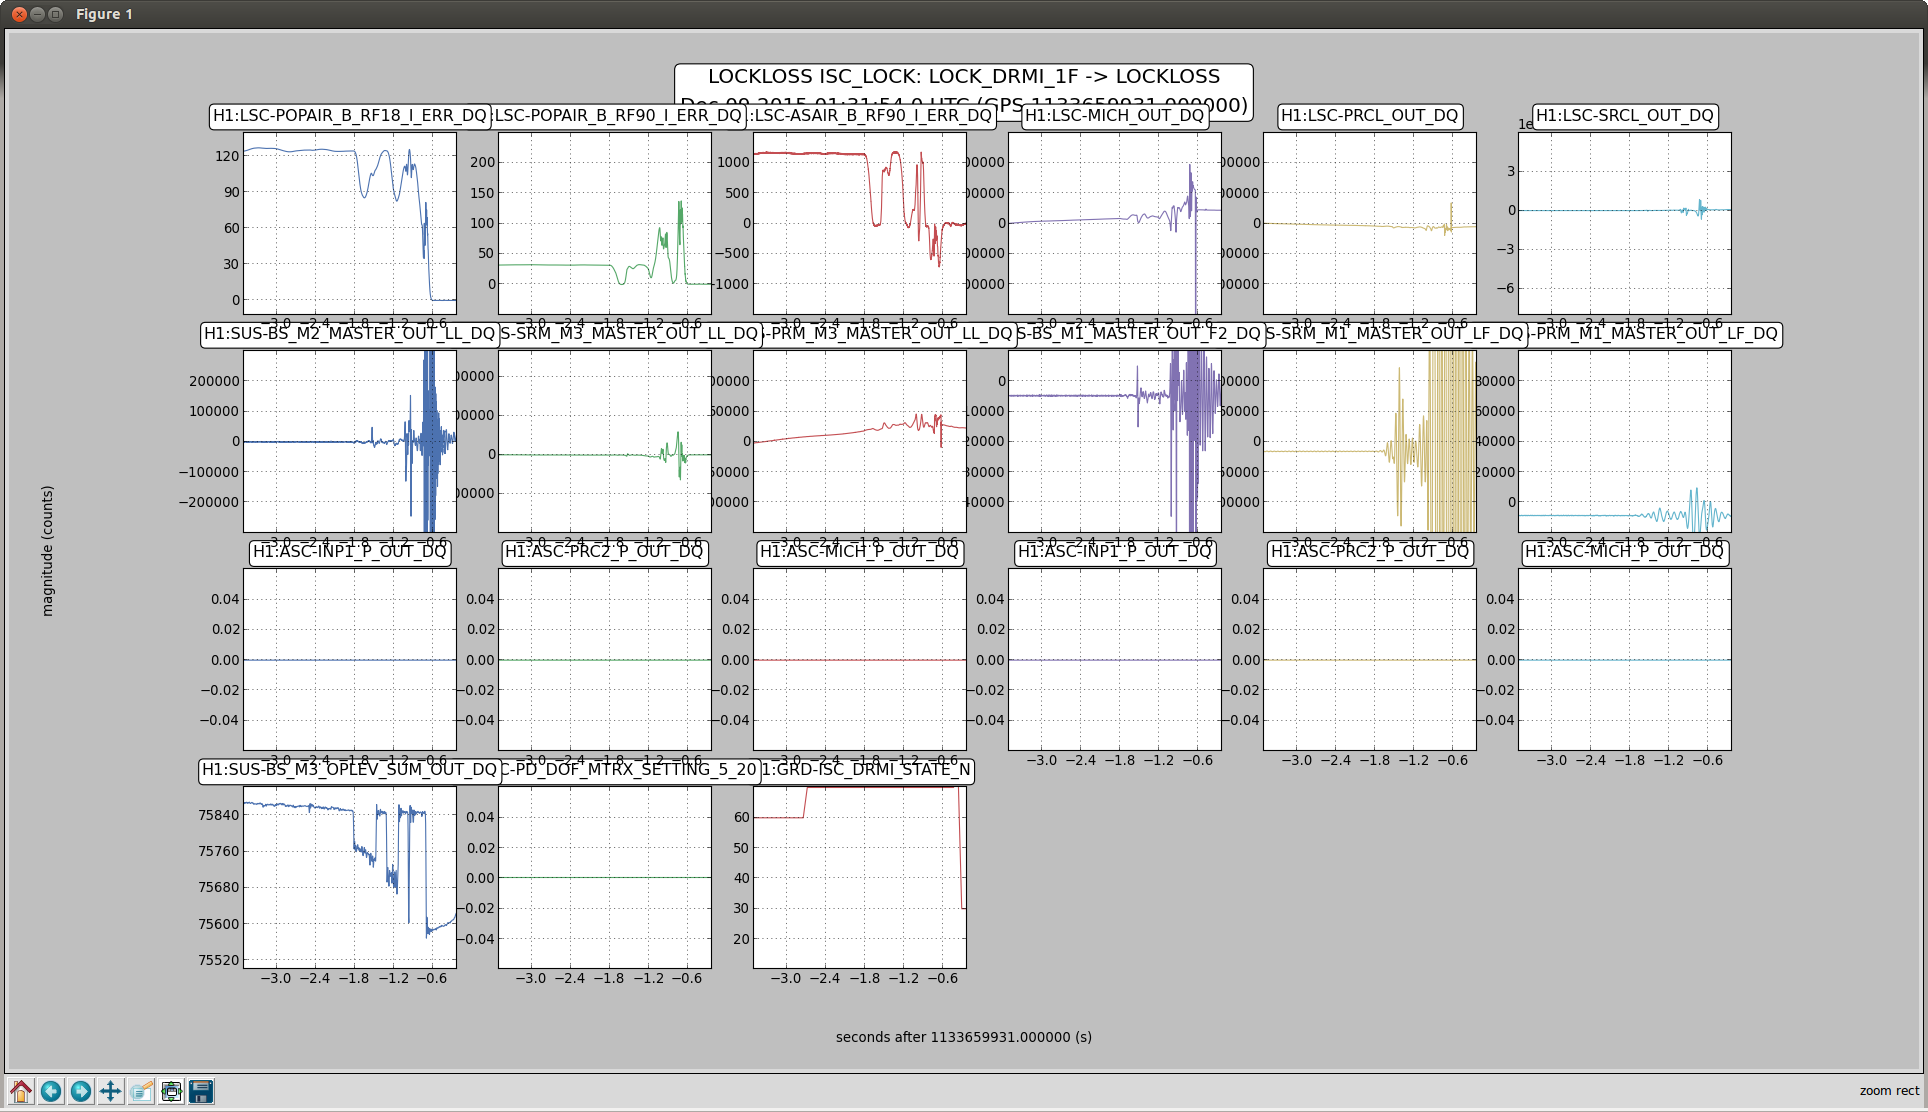
Here is another example, where it seems like the BS oplev glitch (bottom left) caused DRMI to loose lock. If these glitches are becoming more frequent, it might be good to see if we can do something about it.
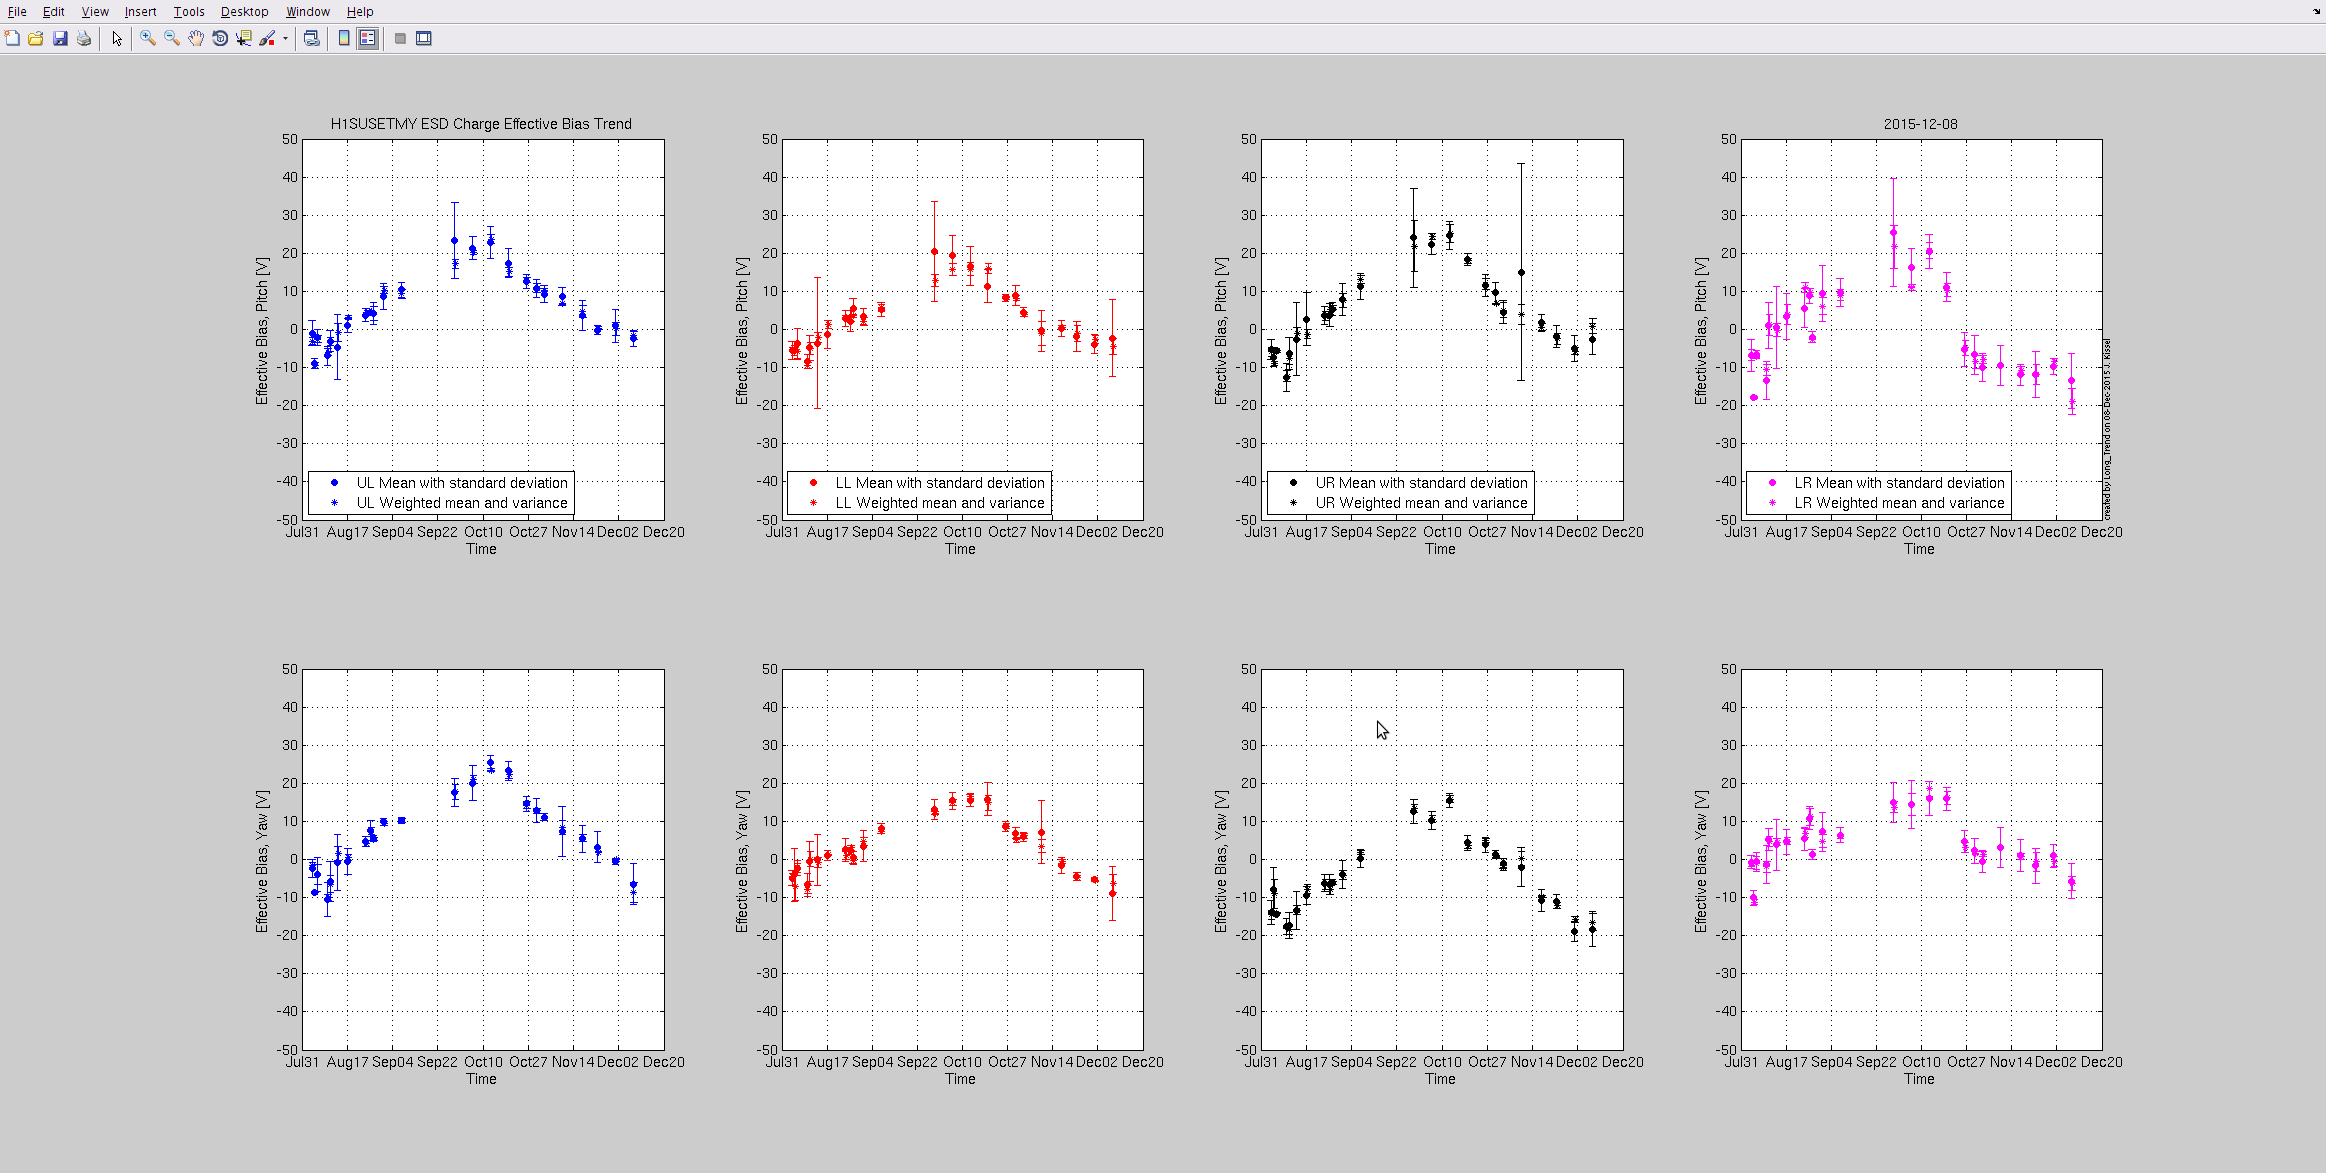
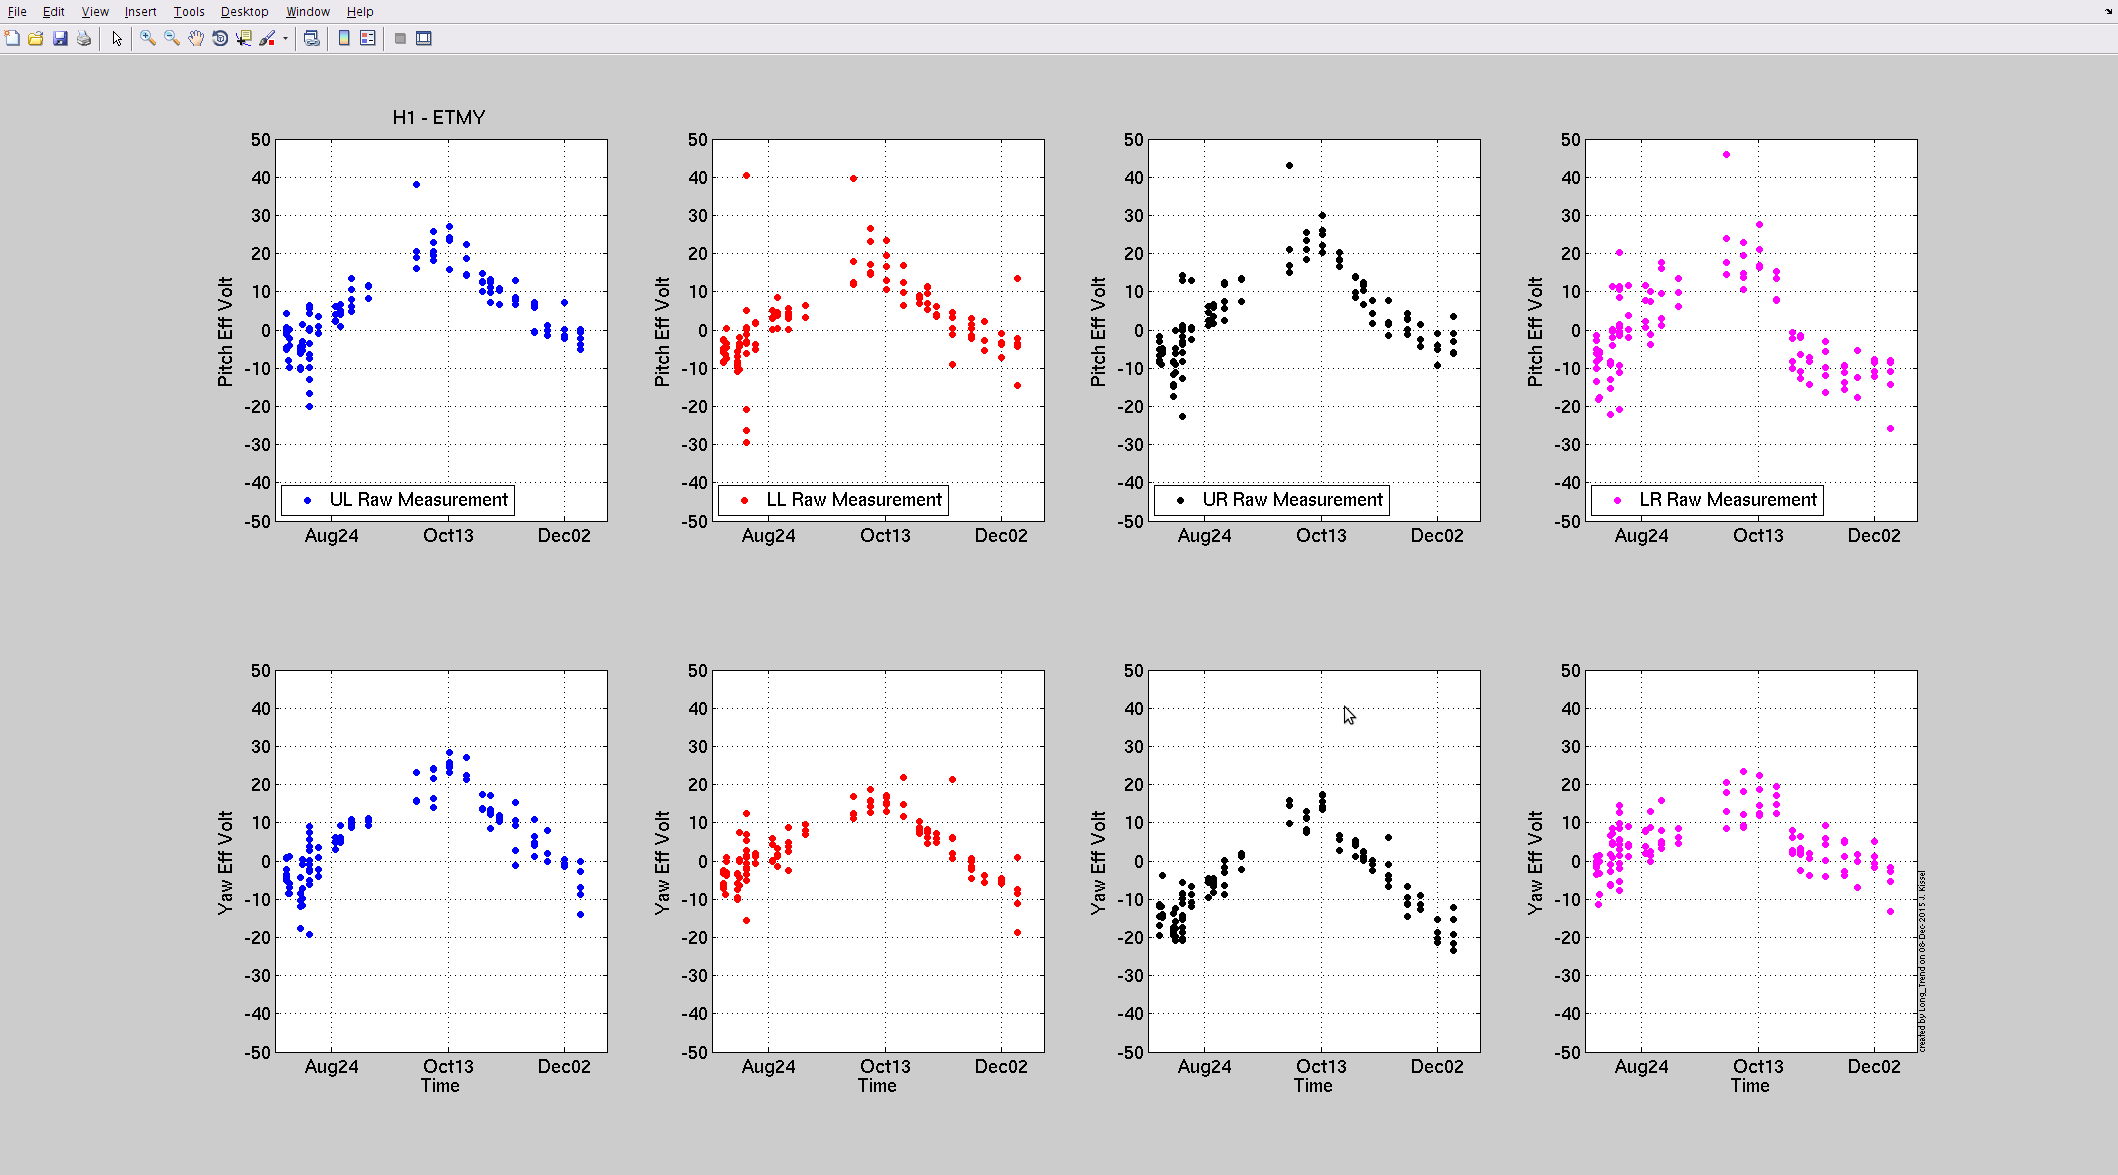
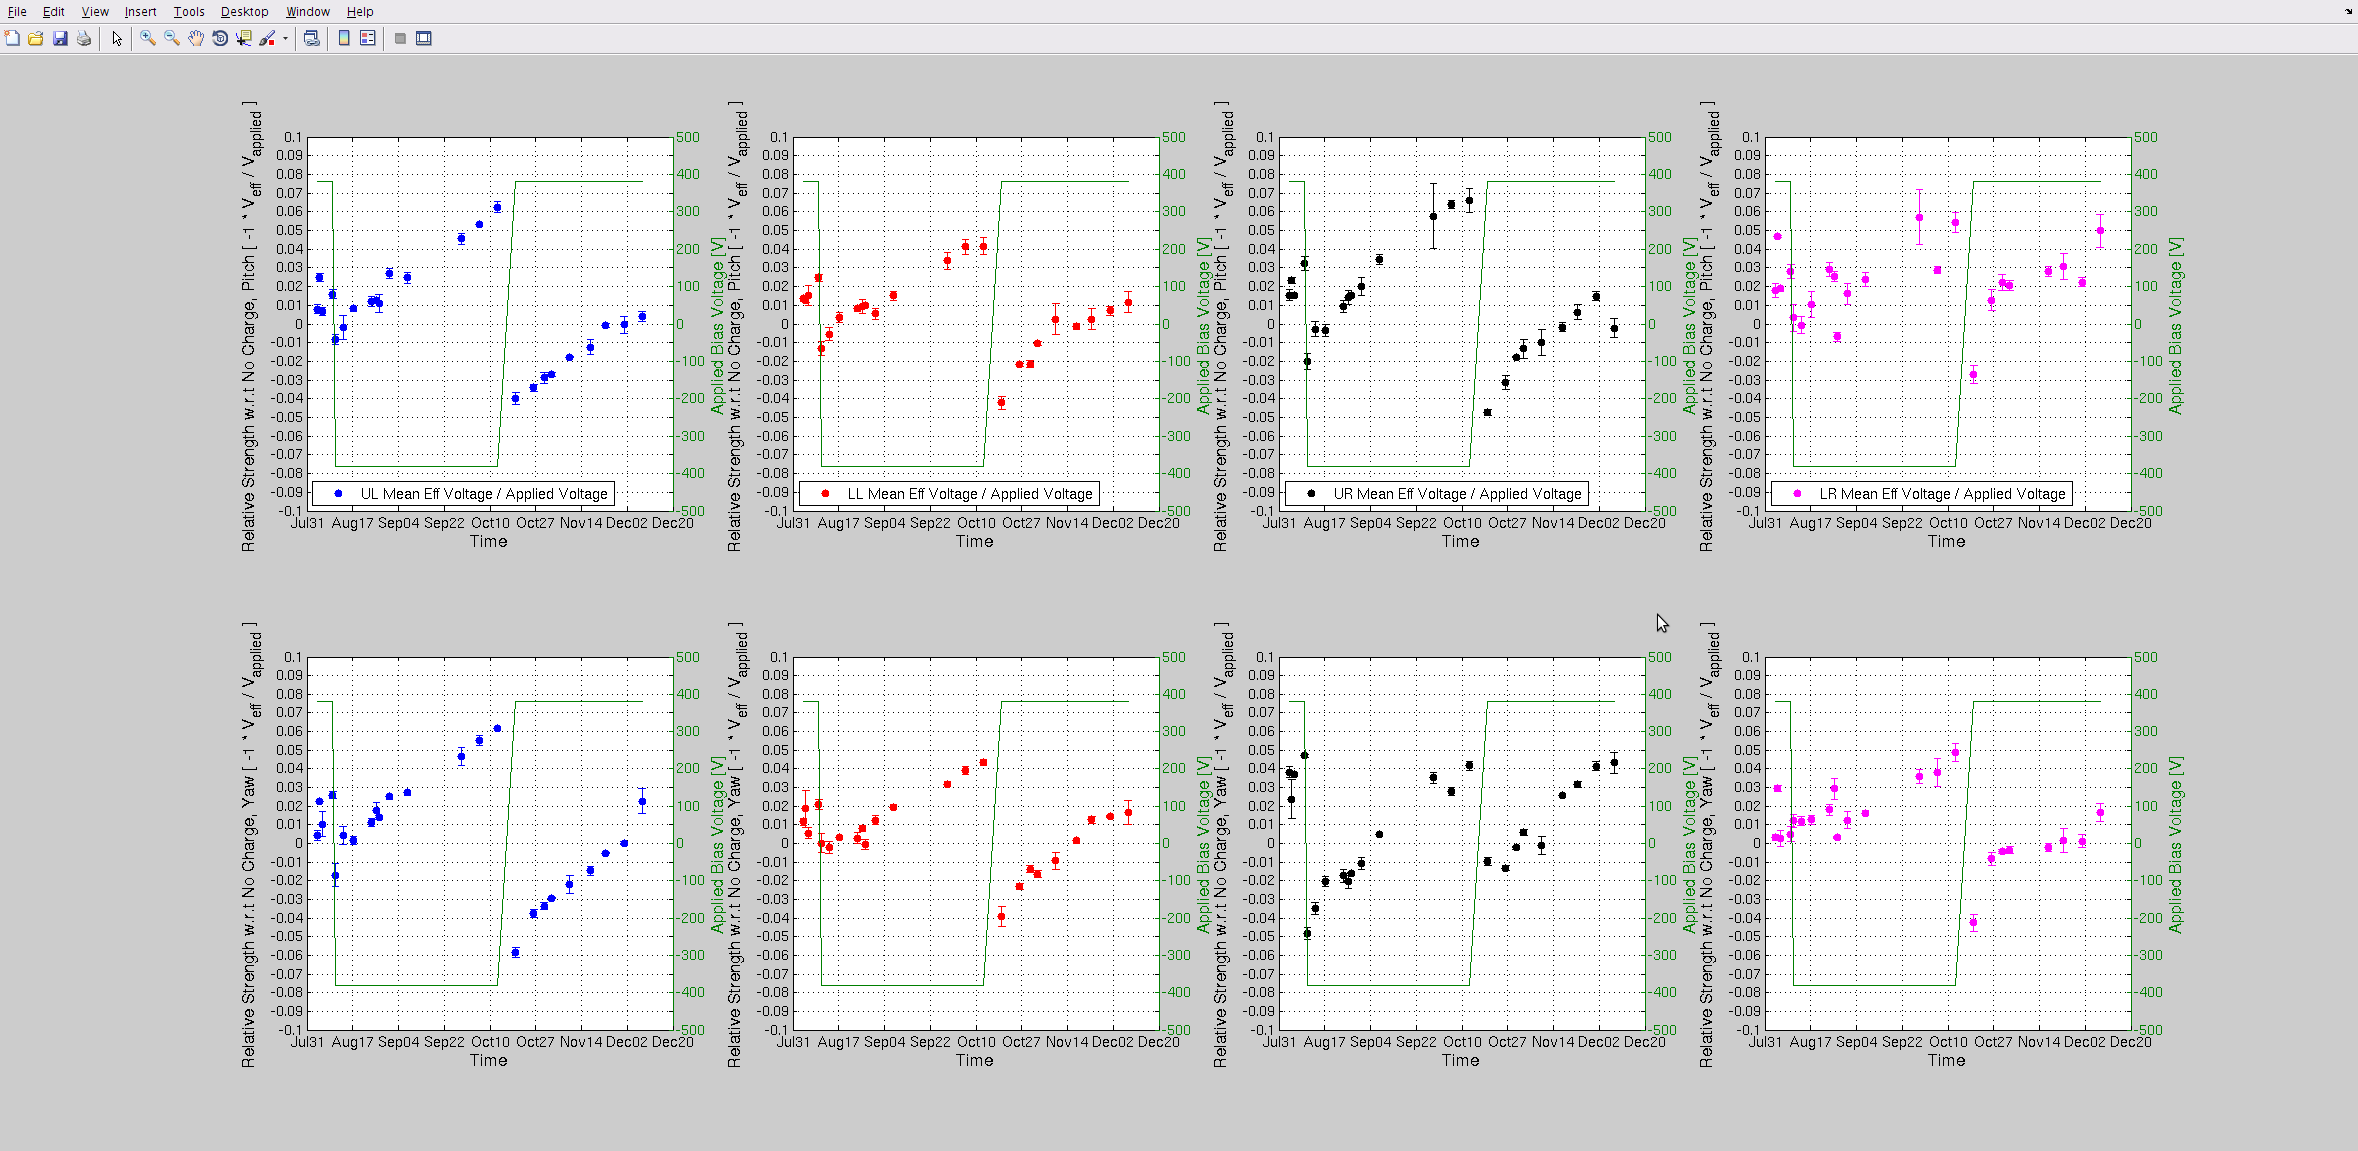
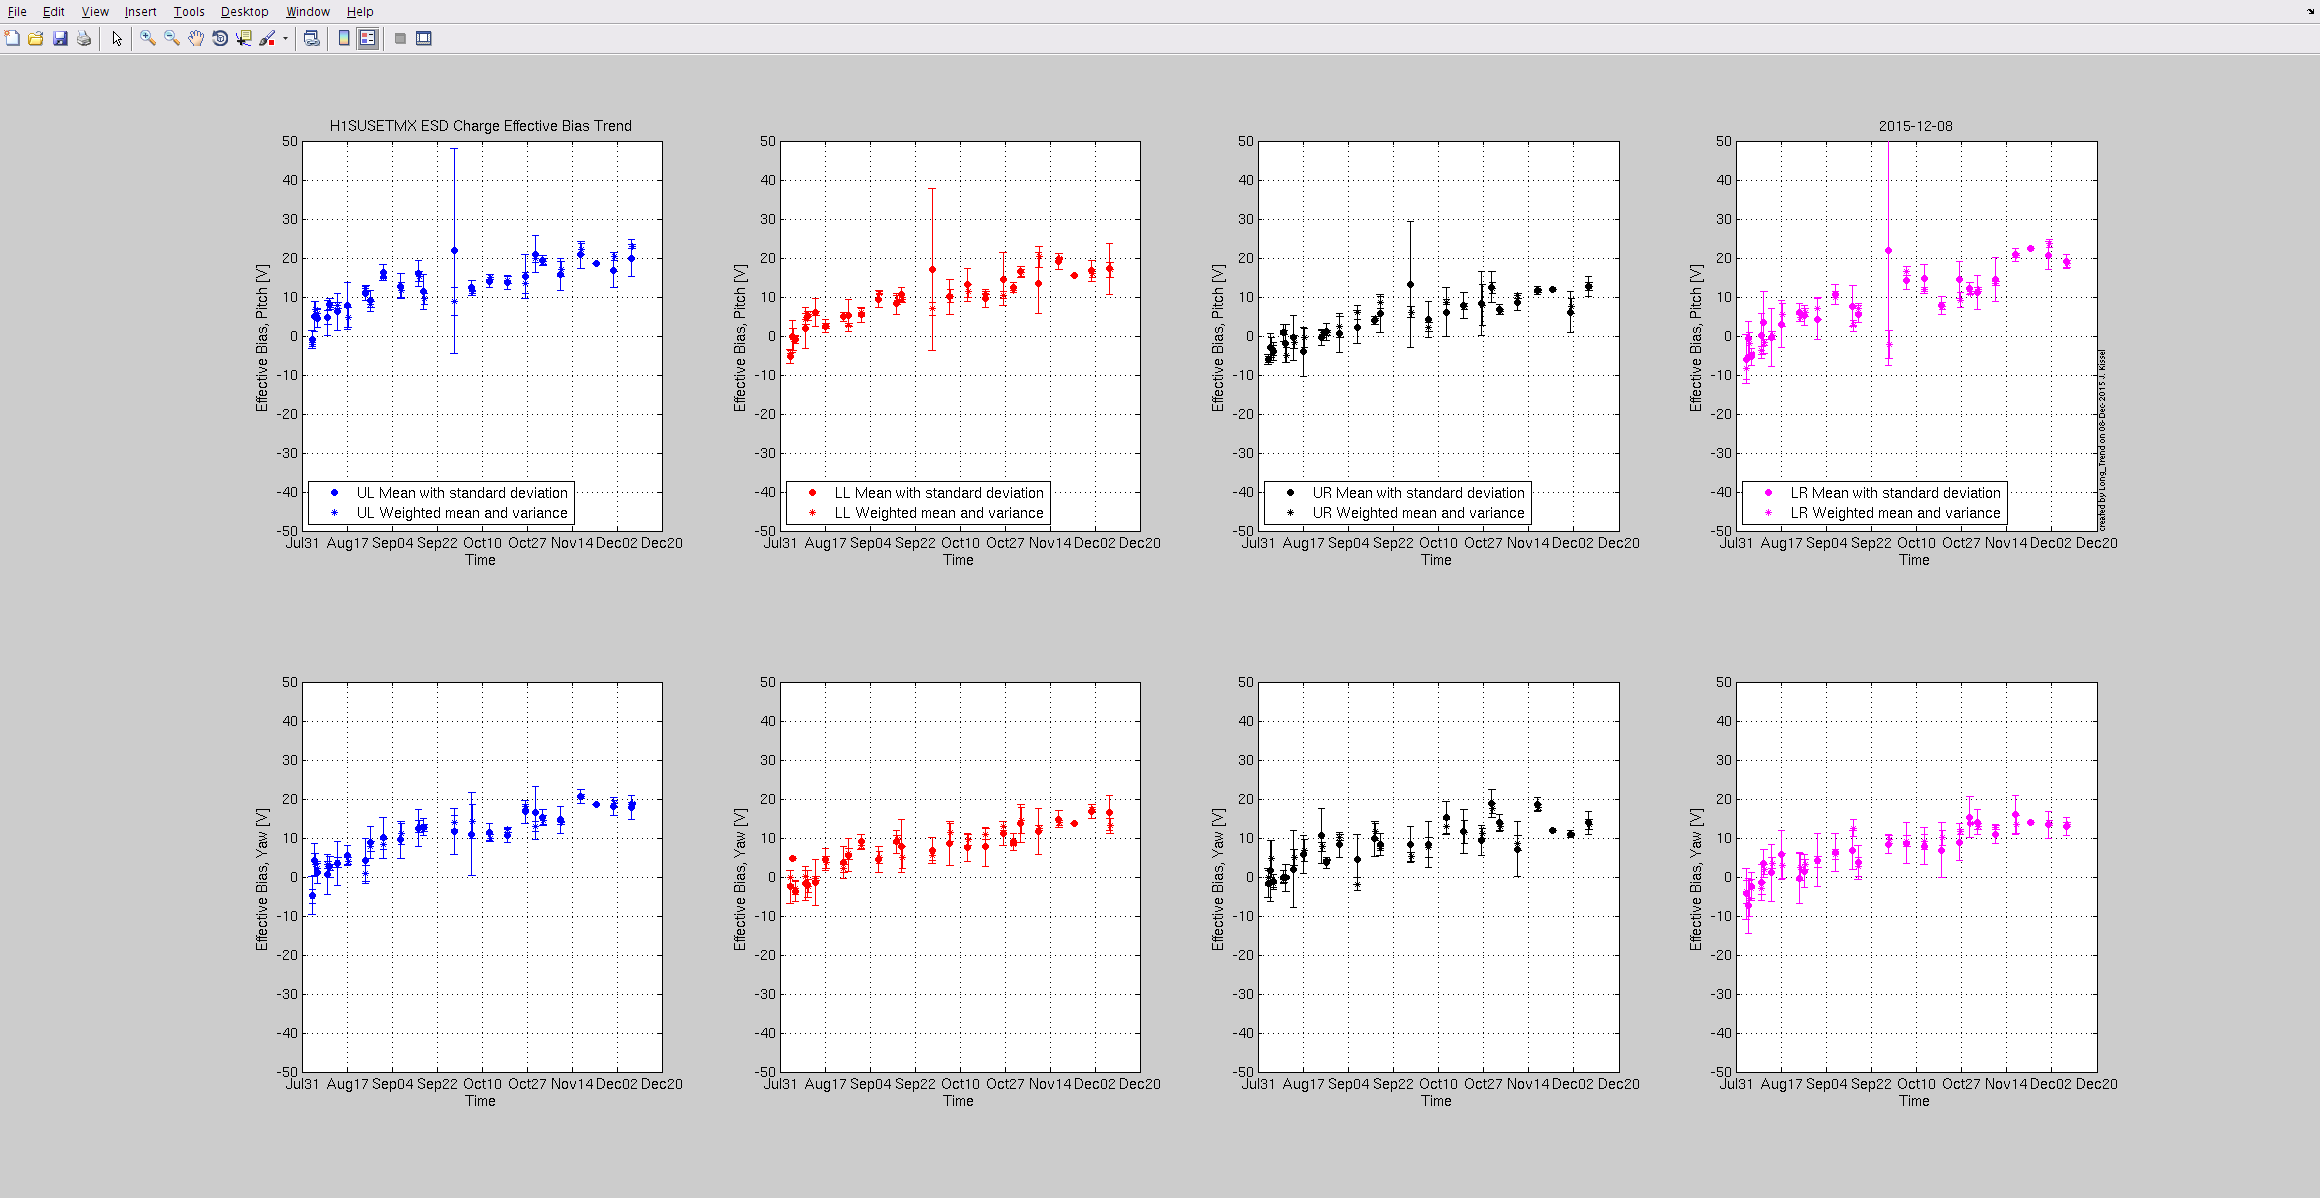
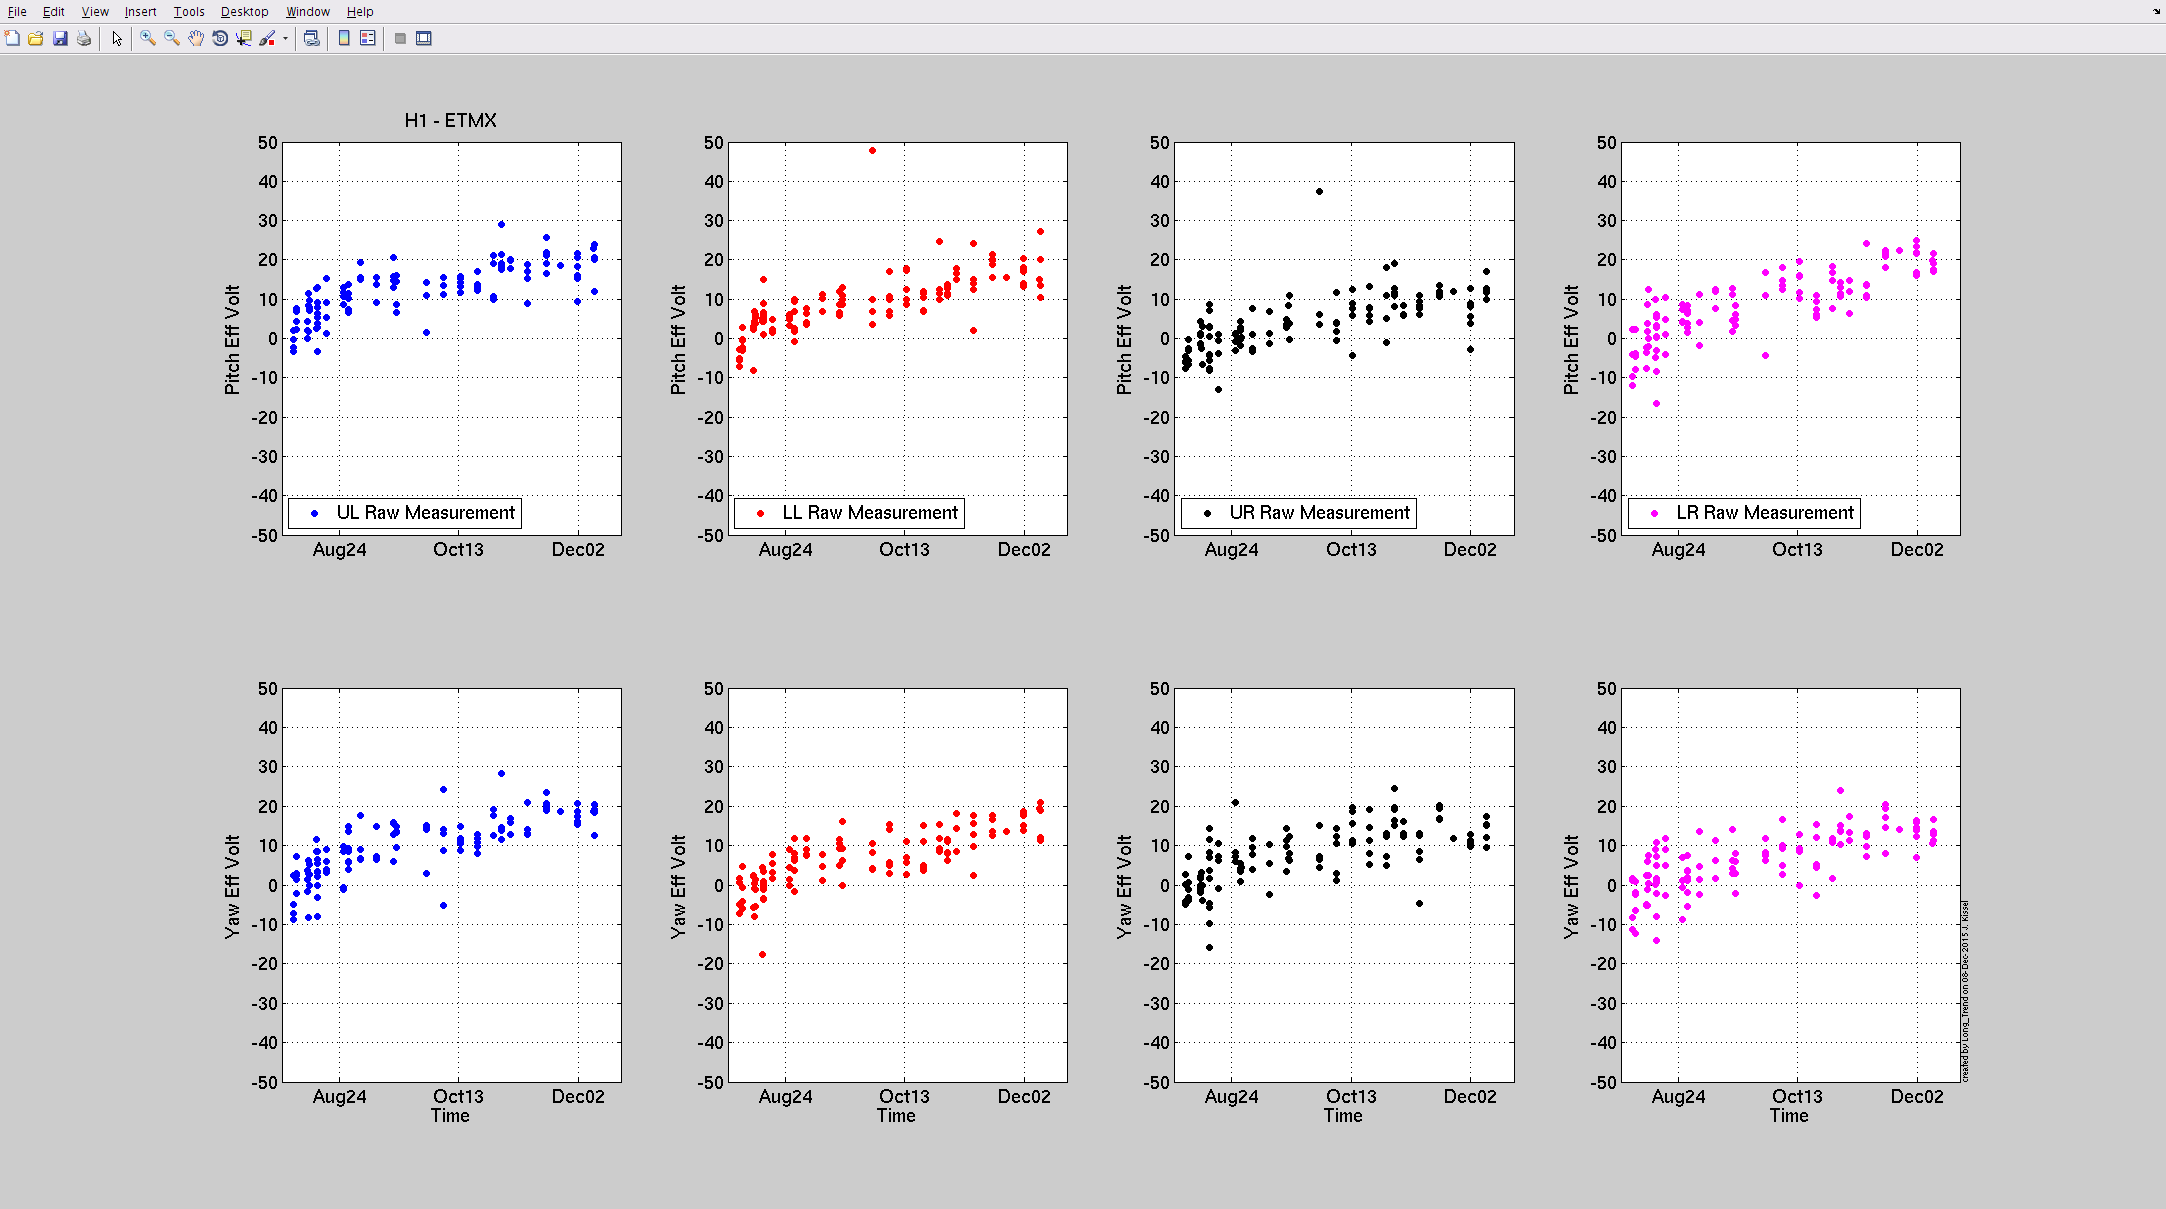
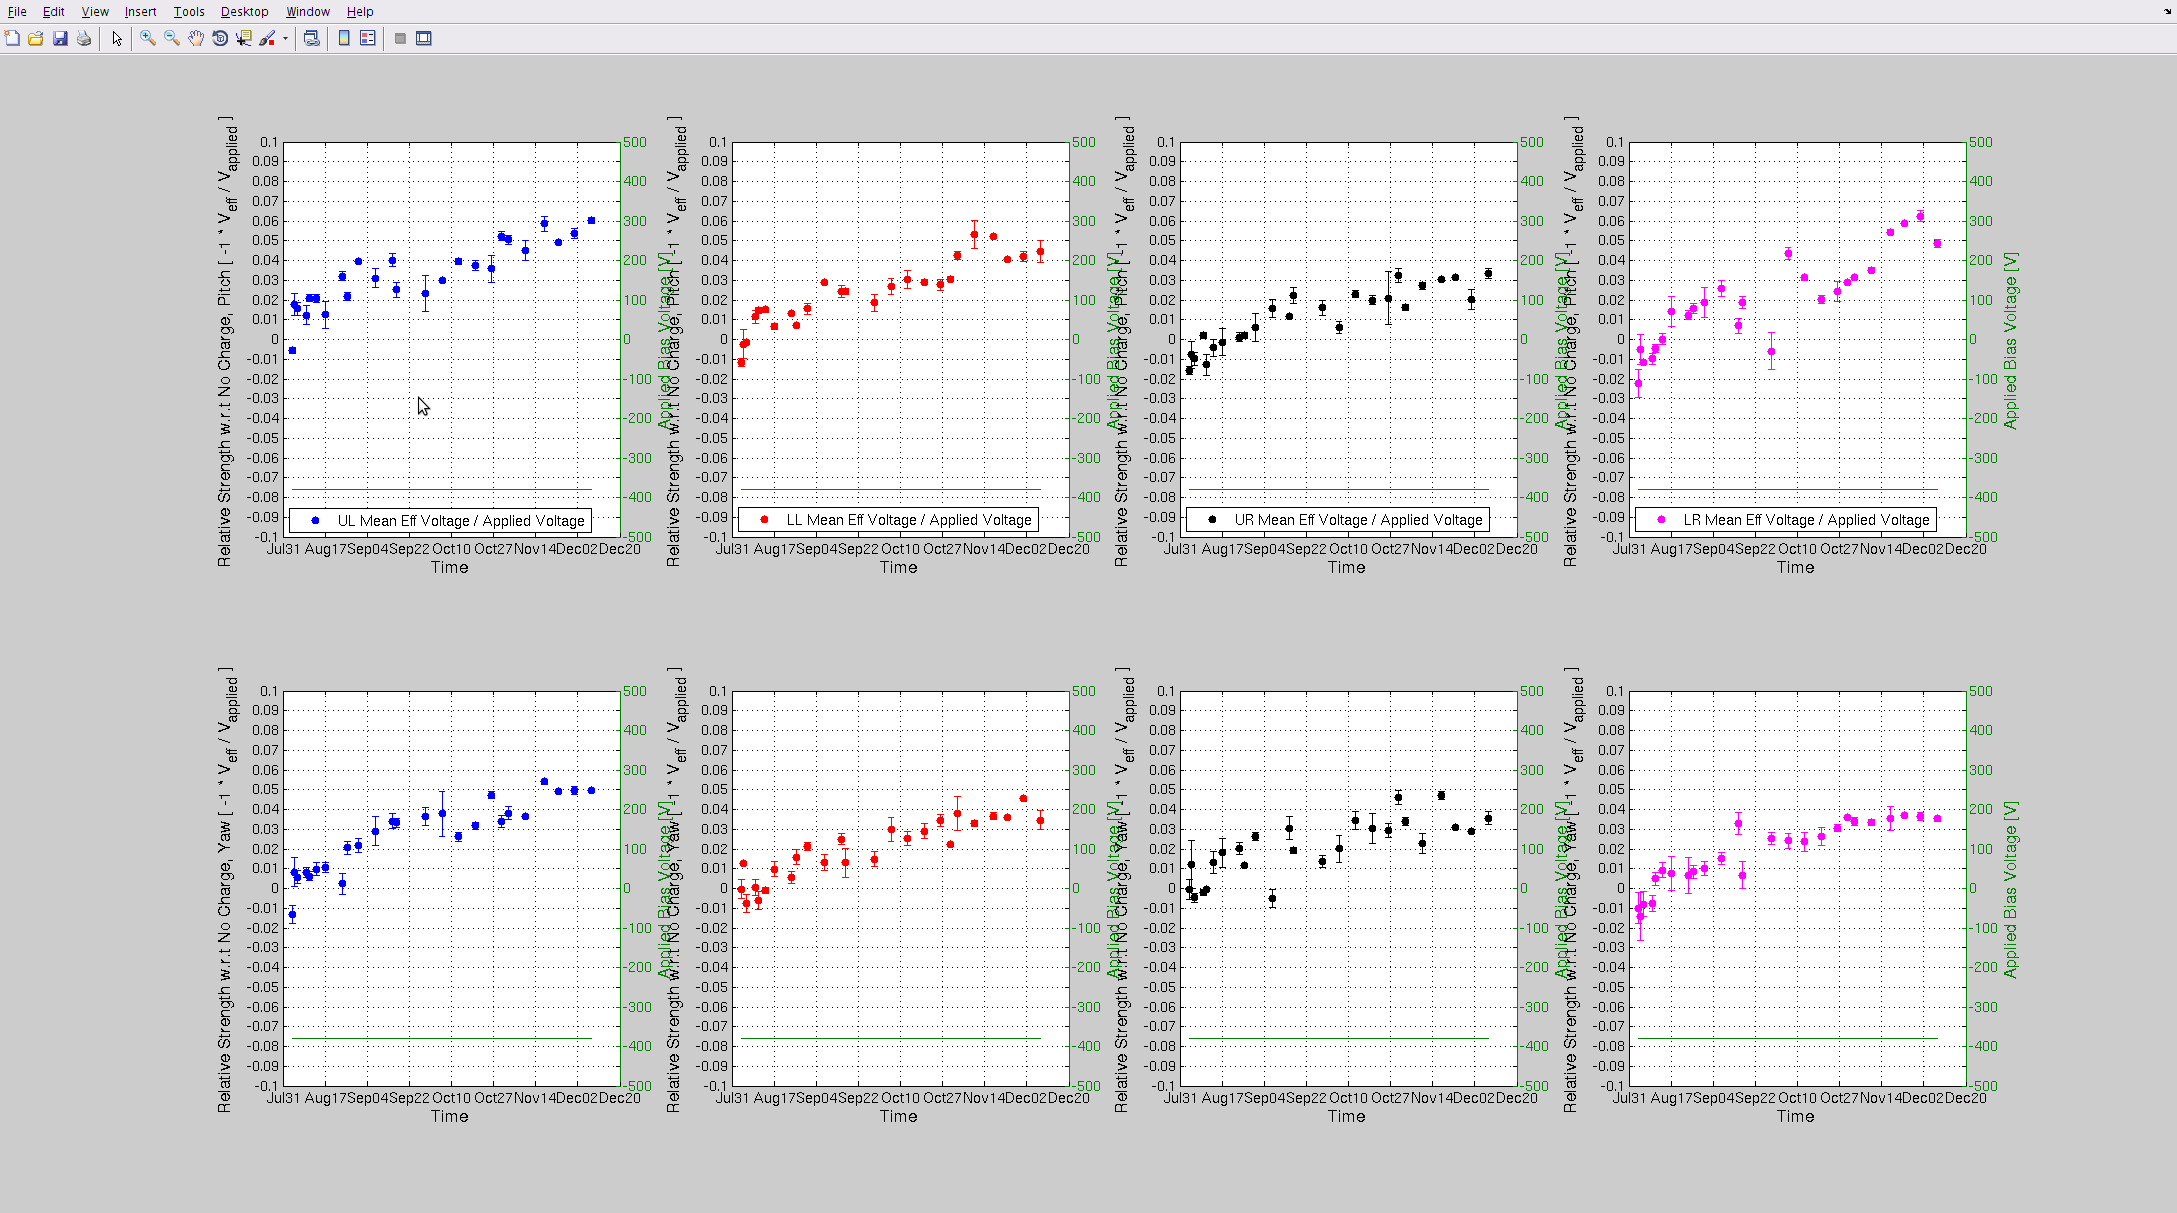
Attached are this week's charge measurements - as usal, they are plotted on the long trend of many months worth of data. Trends look as expected - very slow trend away from zero - no major surprises.
- Duty Cycle 83.9% (that includes downtime for Tuesday maintenance)
- Range at 75-80Mpc
- only 1 lock loss (aside from maintenance), caused by 4.5 earthquake in Oklahoma
- For around 6 hours before maintenance started, noise in 10-50Hz region rung up in DARM, also found in PSL ISS and ISI channels
- Also around this time, lots of glitches in 10-20 Hz region, caught by Hveto, but these end while the above noise continued. Cause of both of these phenomena are unknown.
- On Wednesday, a tractor was used to plow snow, for some of the time it showed up in CS seismometer 10-30 Hz BLRMS, and dropped range by ~5Mpc.
- No BBH/BNS searches run for any of these 3 days
analog video server restarted
Richard, Jim, Dave:
the h0video IOC was restarted on h0epics2 to re-establish connection to the Knox video matrix switch.
Added channel to DAQ broadcaster [WP5642]
Ryan F, Dave:
the hardware injection ODC channel for EX was added to the DMT broadcaster machine. Only h1broadcast0 was restarted, not the full DAQ.
DMT QFS server connection to QLogic switches [WP5643]
Dan, Carlos:
h1dmtfs0 was disconnected from its SATABOY and routed instead to the two DAQ QLogic switches in the MSR. This required running two longer multimode fiber optics cables from the X2200 to the switches. This is a temporary configuration to allow Dan to perform tests on the SATABOY which is showing errors.
Power cdsfs0 down to add hard drives [WP5637]
Jim, Carlos:
cdsfs0 (NFS server or /ligo) was powered down to install two 2TB HDD into spare SATA slots. Total downtime was < 5mins and all NFS clients reconnected.
CW hardware injection stopped and started
TJ, Dave:
The psinject process on h1hwinj1 was killed. This tested that monit correctly restarted the process (pass) and that the operator station's verbal alarm could be acknowledged to stop it announcing (failed). We may test this again later when TJ has new code.
h1pemmx trivial filter change to test daqsvn updates
Dave:
I made a trivial change to H1PEMMX.txt (added comment line at end) and loaded this into h1pemmx. This will test the periodic commit of these changes to DAQSVN. Change was made at 11:51:23 PST
H1 12/3 - 12/6 Detchar Data Quality Shift Report Summary. Full shift report here: https://wiki.ligo.org/DetChar/DataQuality/DQShiftLHO20151203
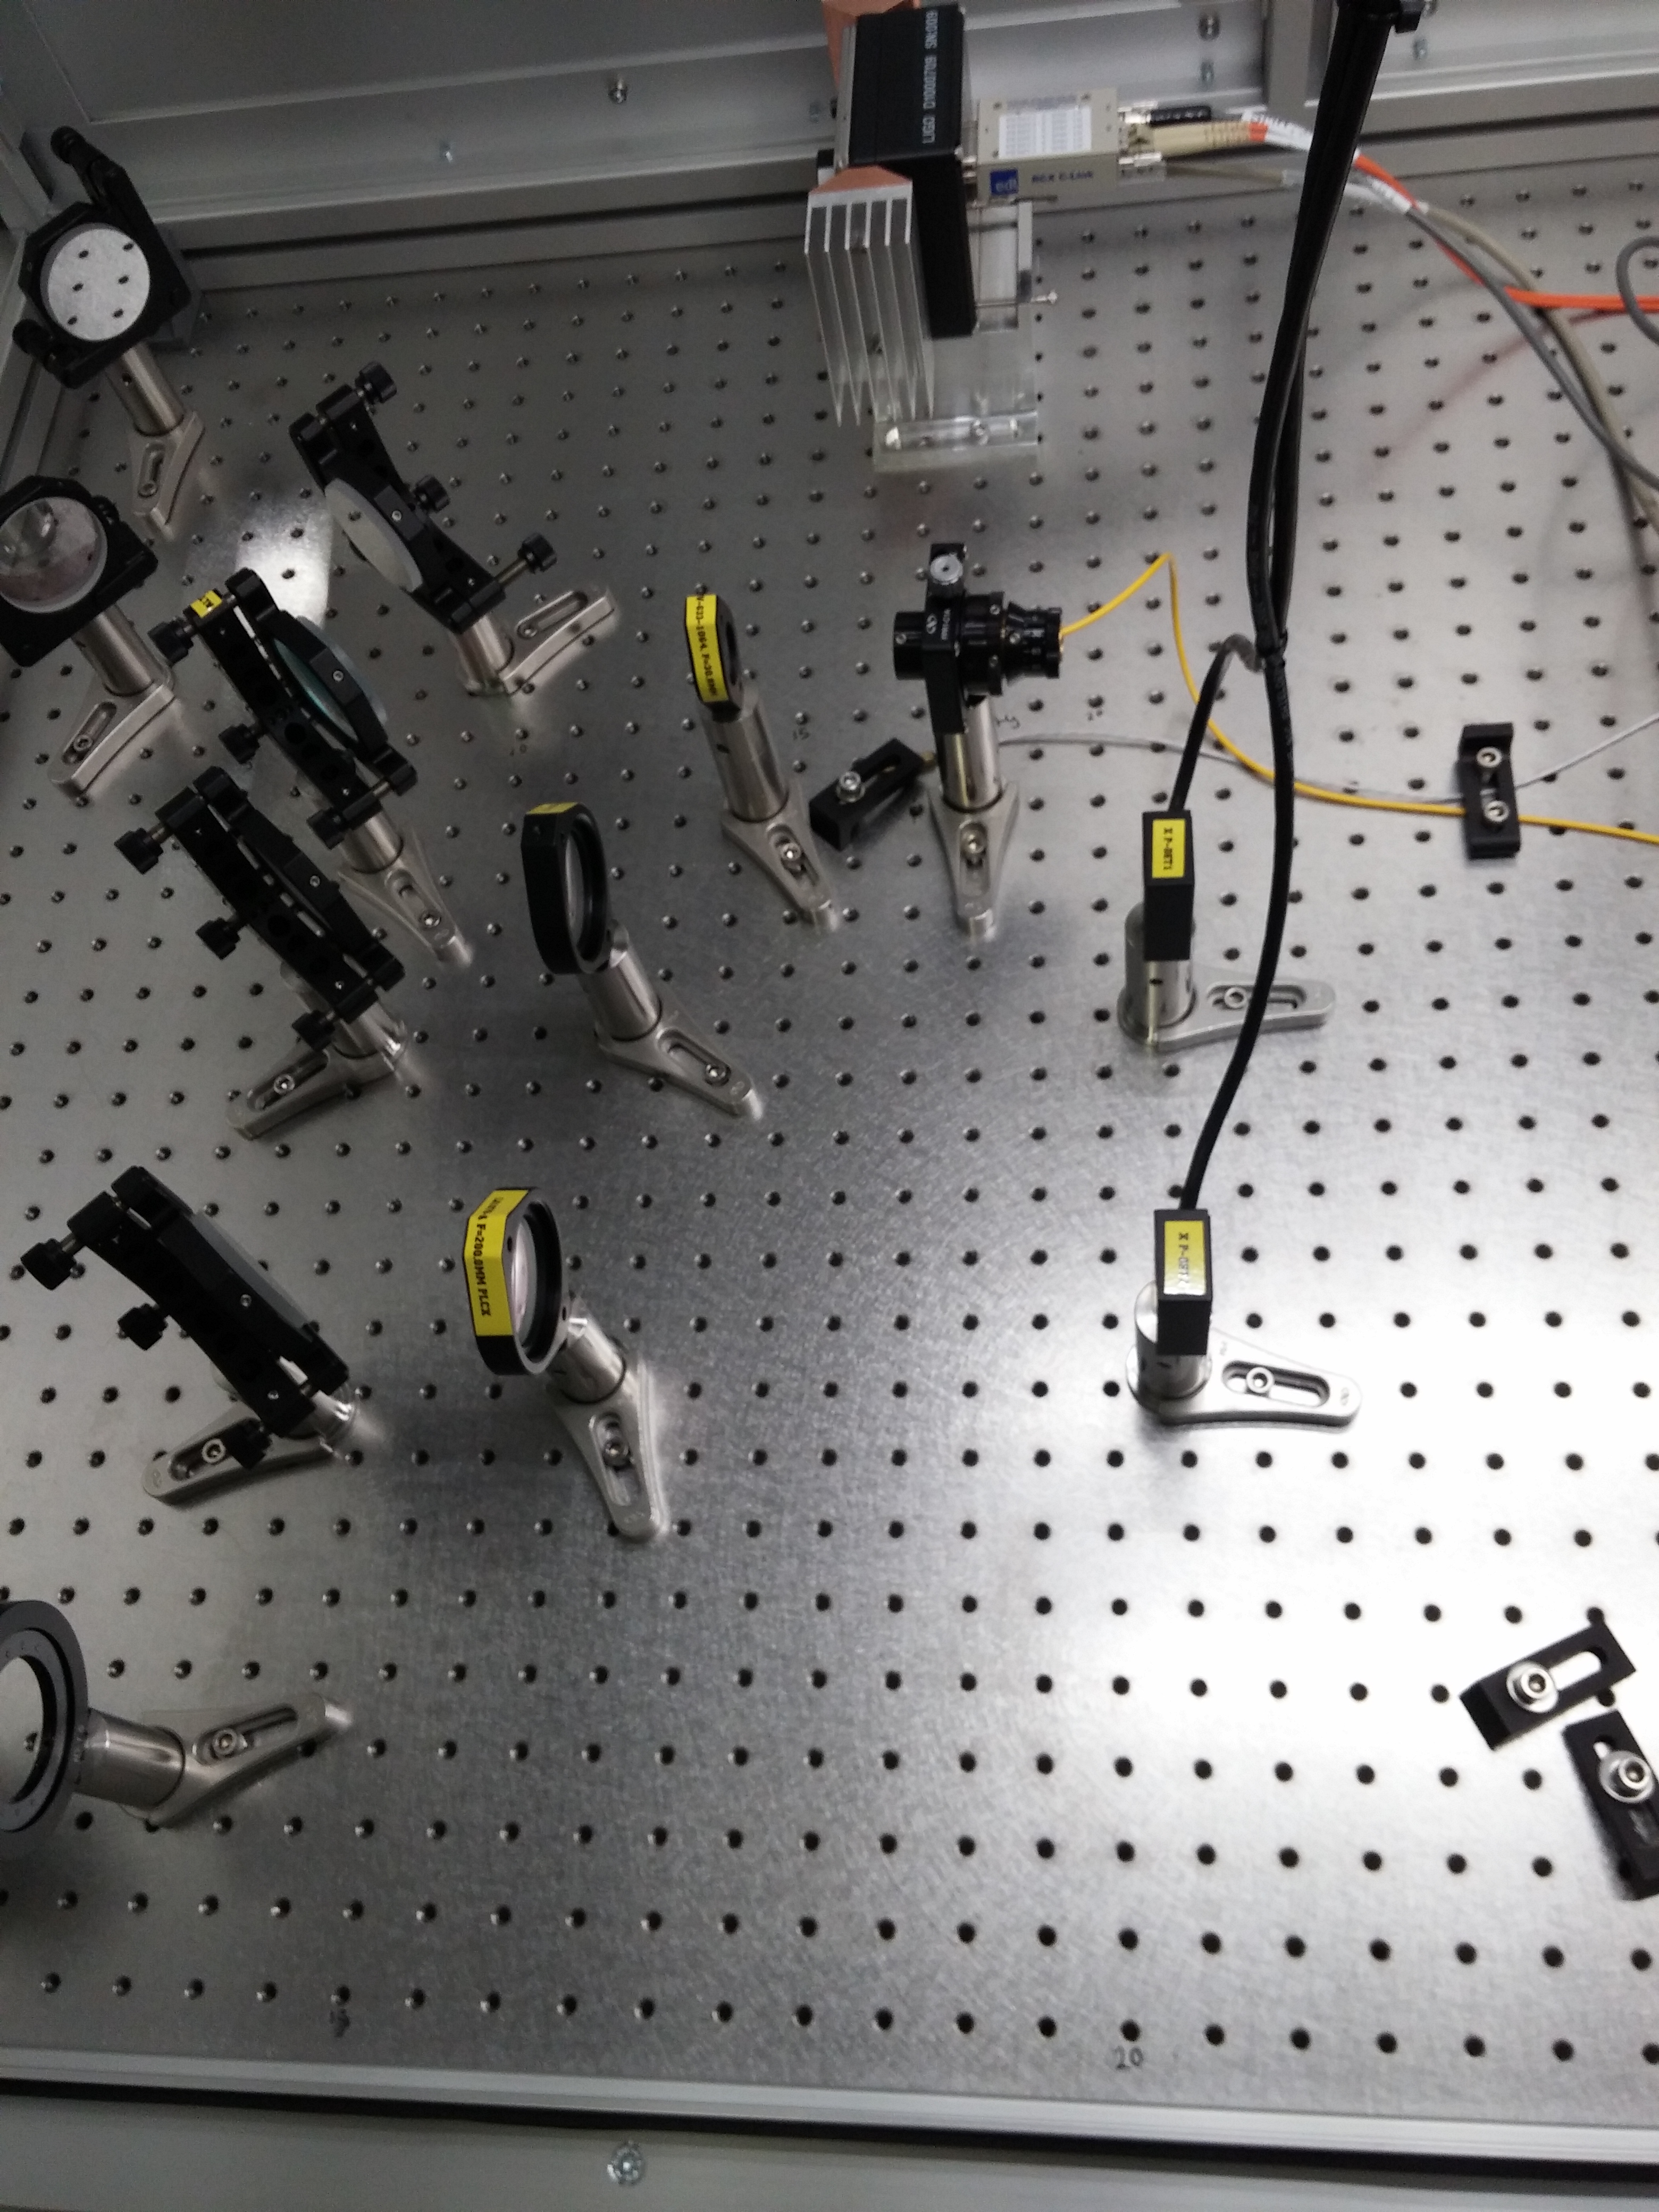
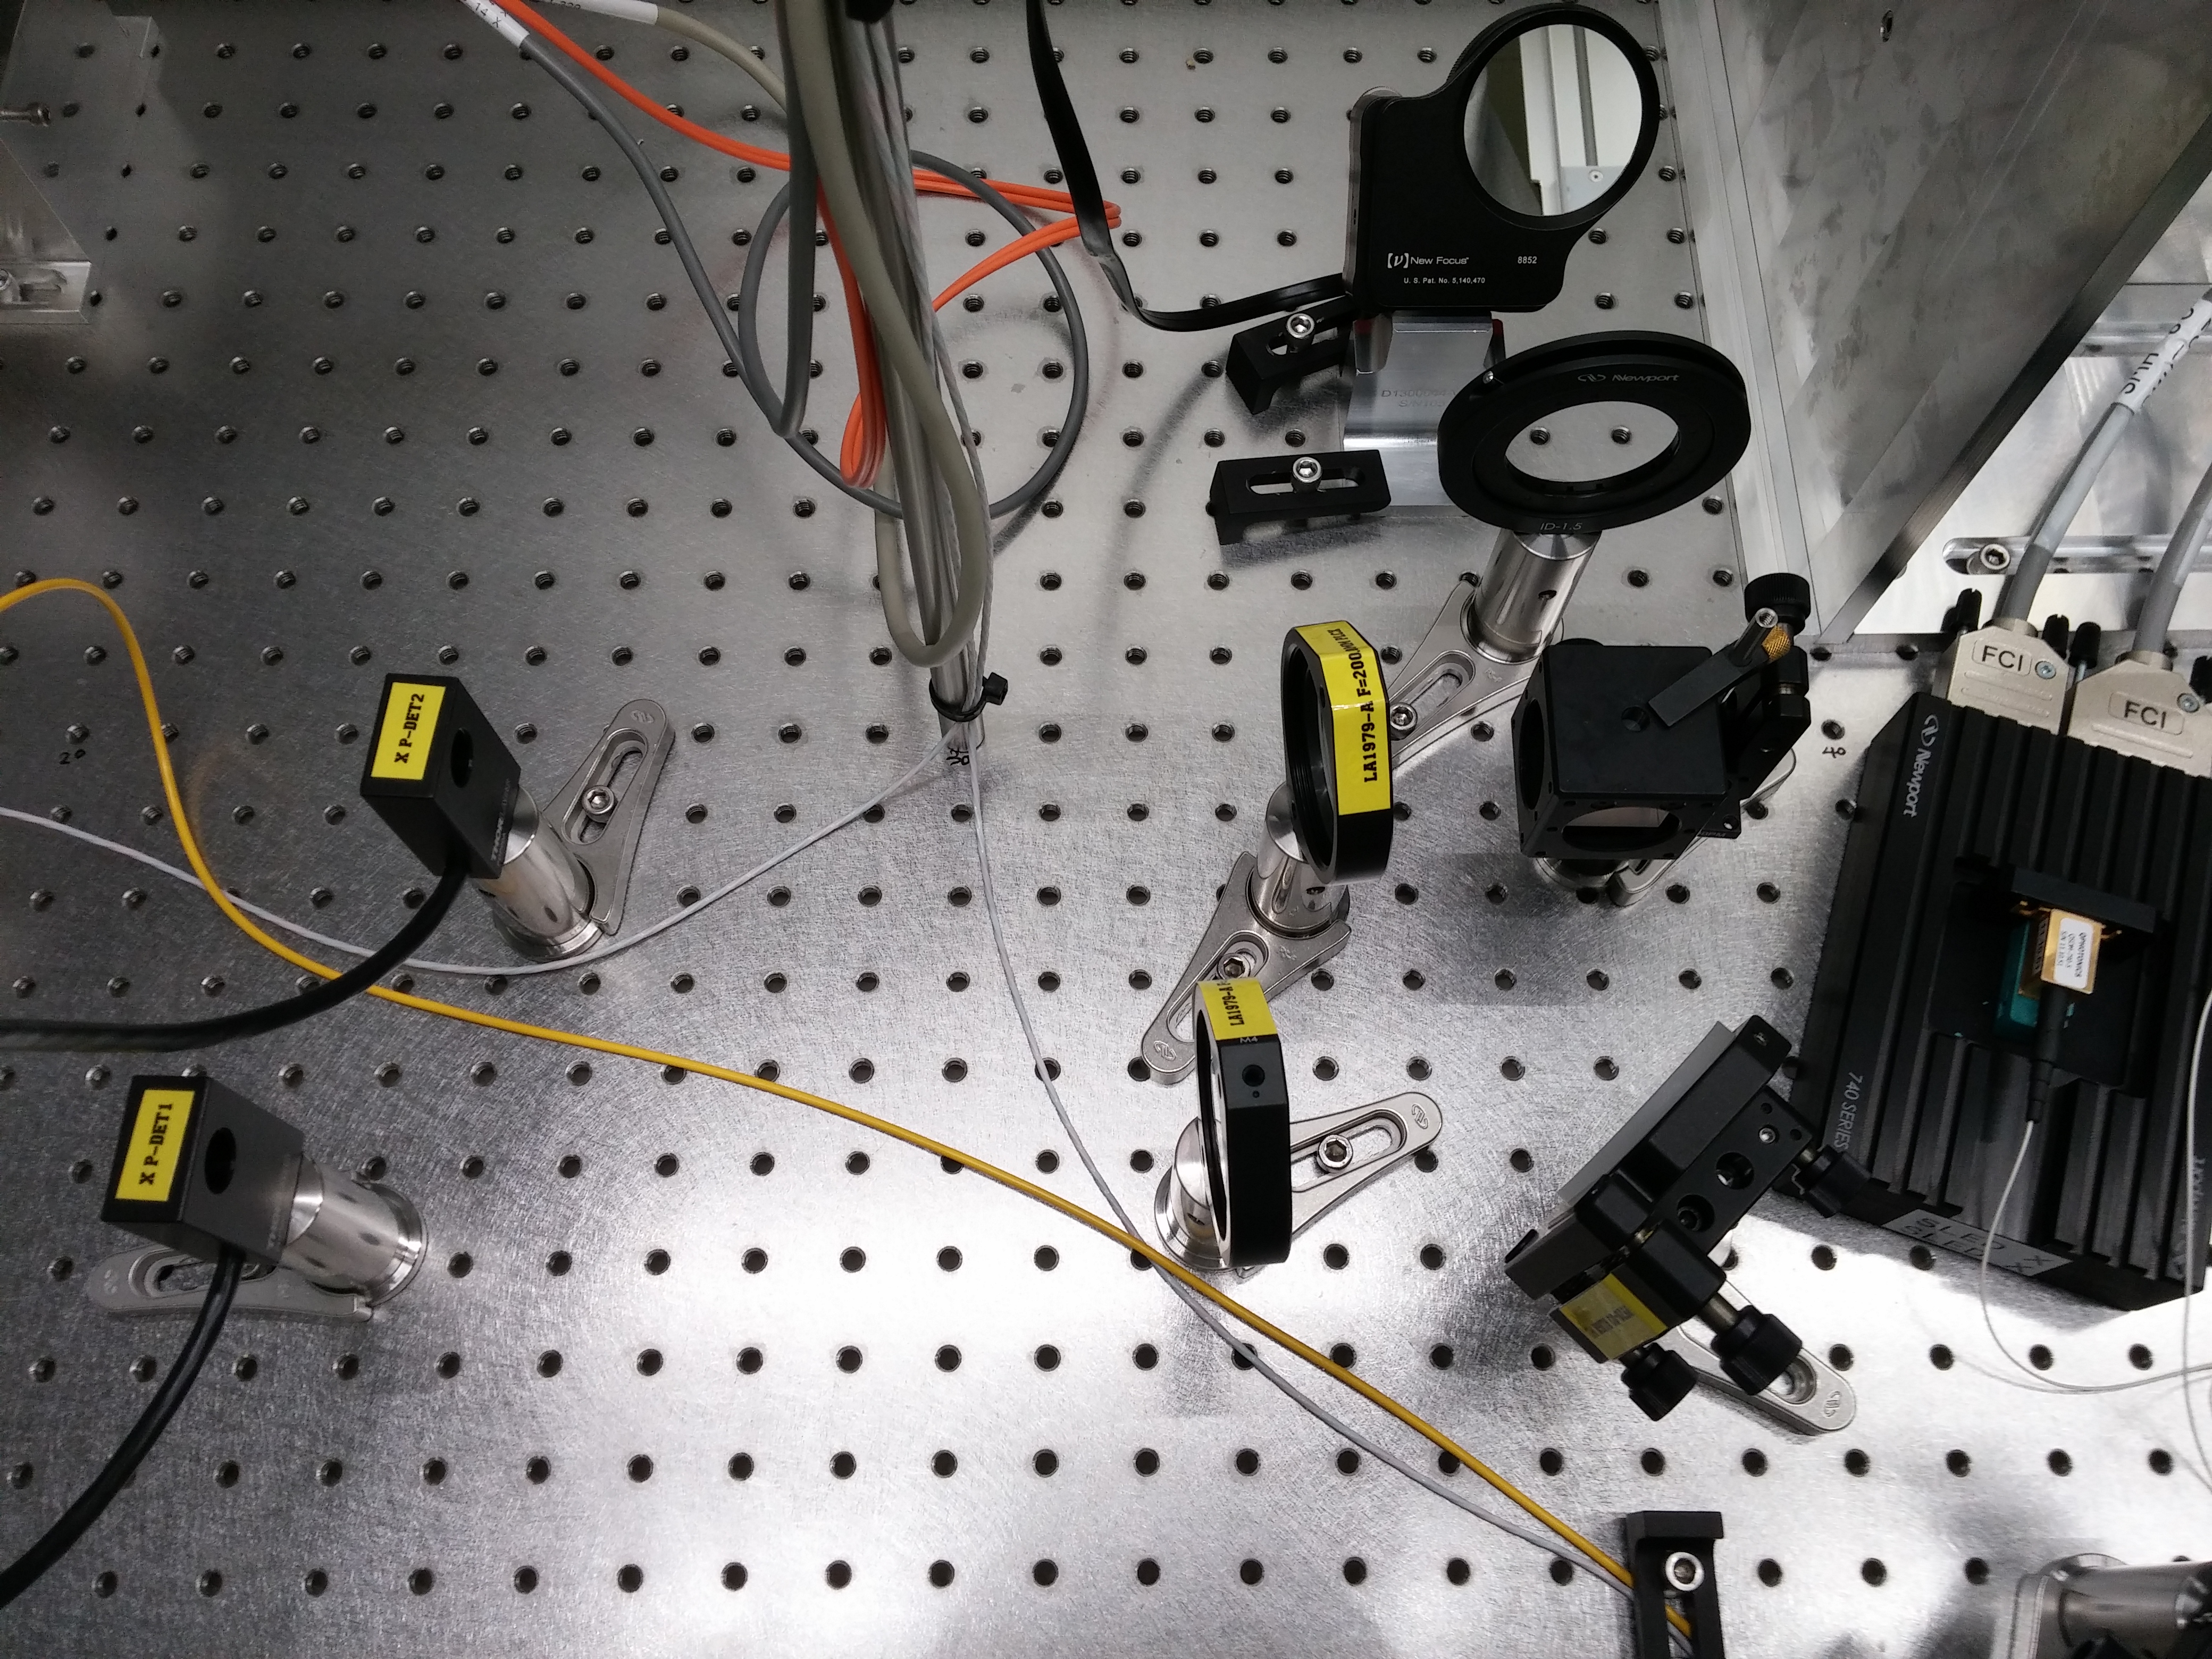
J. Oberling, N. Kijbunchoo, B. Weaver
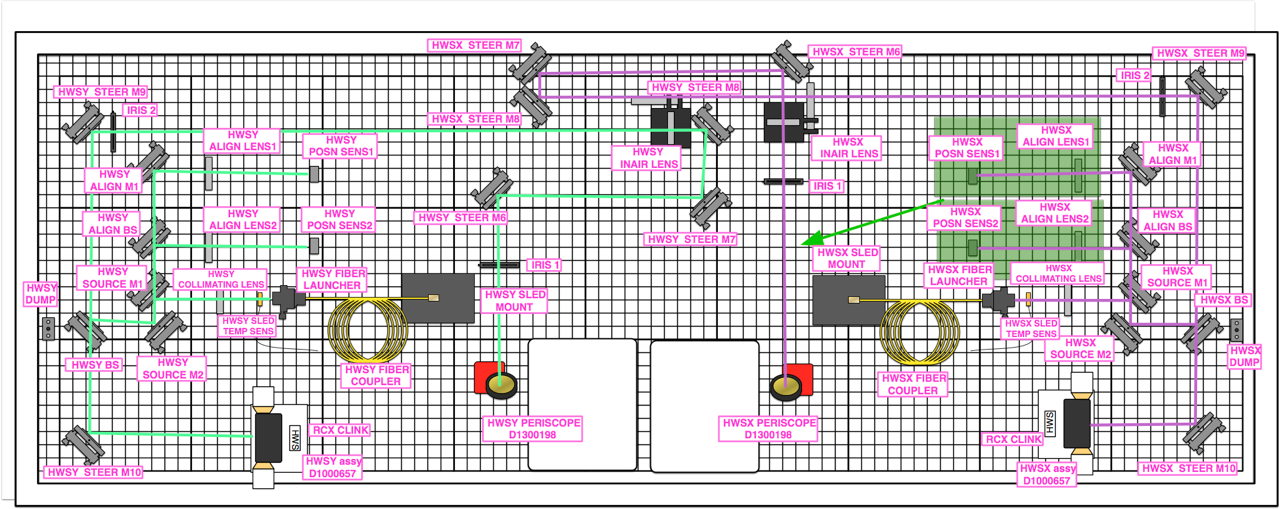
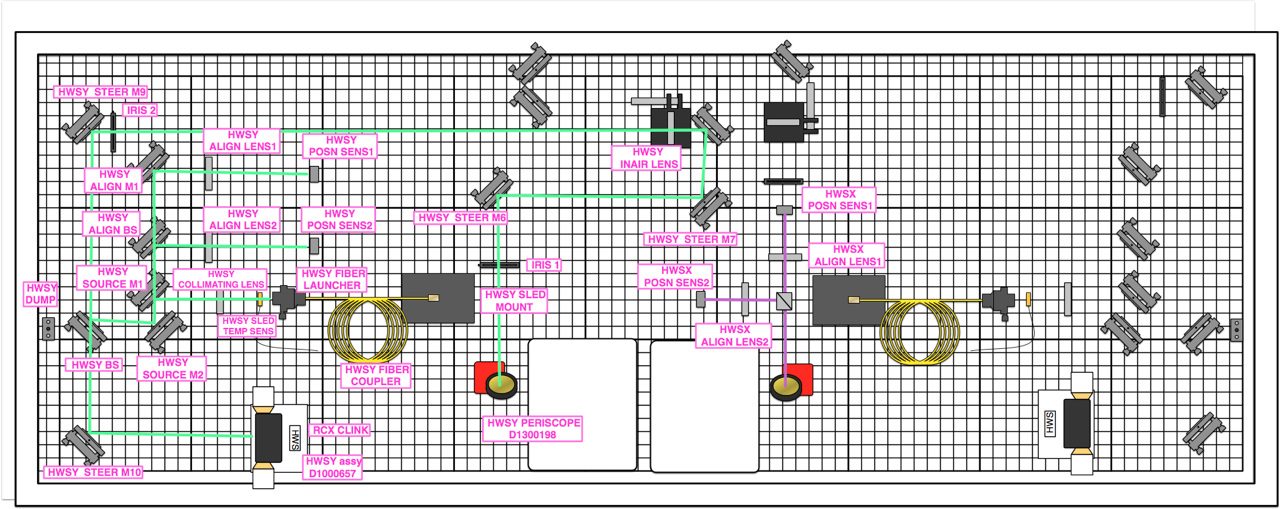
This morning we installed the PBS in the HWSx path. The 2 attched .png files show the desired before and after configuration of the HWSx beam path. Unfortunately we did not have enough room to install the transmitted path as shown in the picture, so we moved HWSX_ALIGN_M1 and installed the lens and detector parallel to the reflected path (see before and after photos). As it stands right now, HWSX_POSN_SENS2 is measuring the beam reflected from the PBS (s-pol (perpindicular)) and HWSX_POSN_SENS1 is measuring the beam transmitted by the PBS (p-pol (parallel)). All optics are turned slightly to prevent back reflections from getting back into the IFO. A short summary of our procedure:
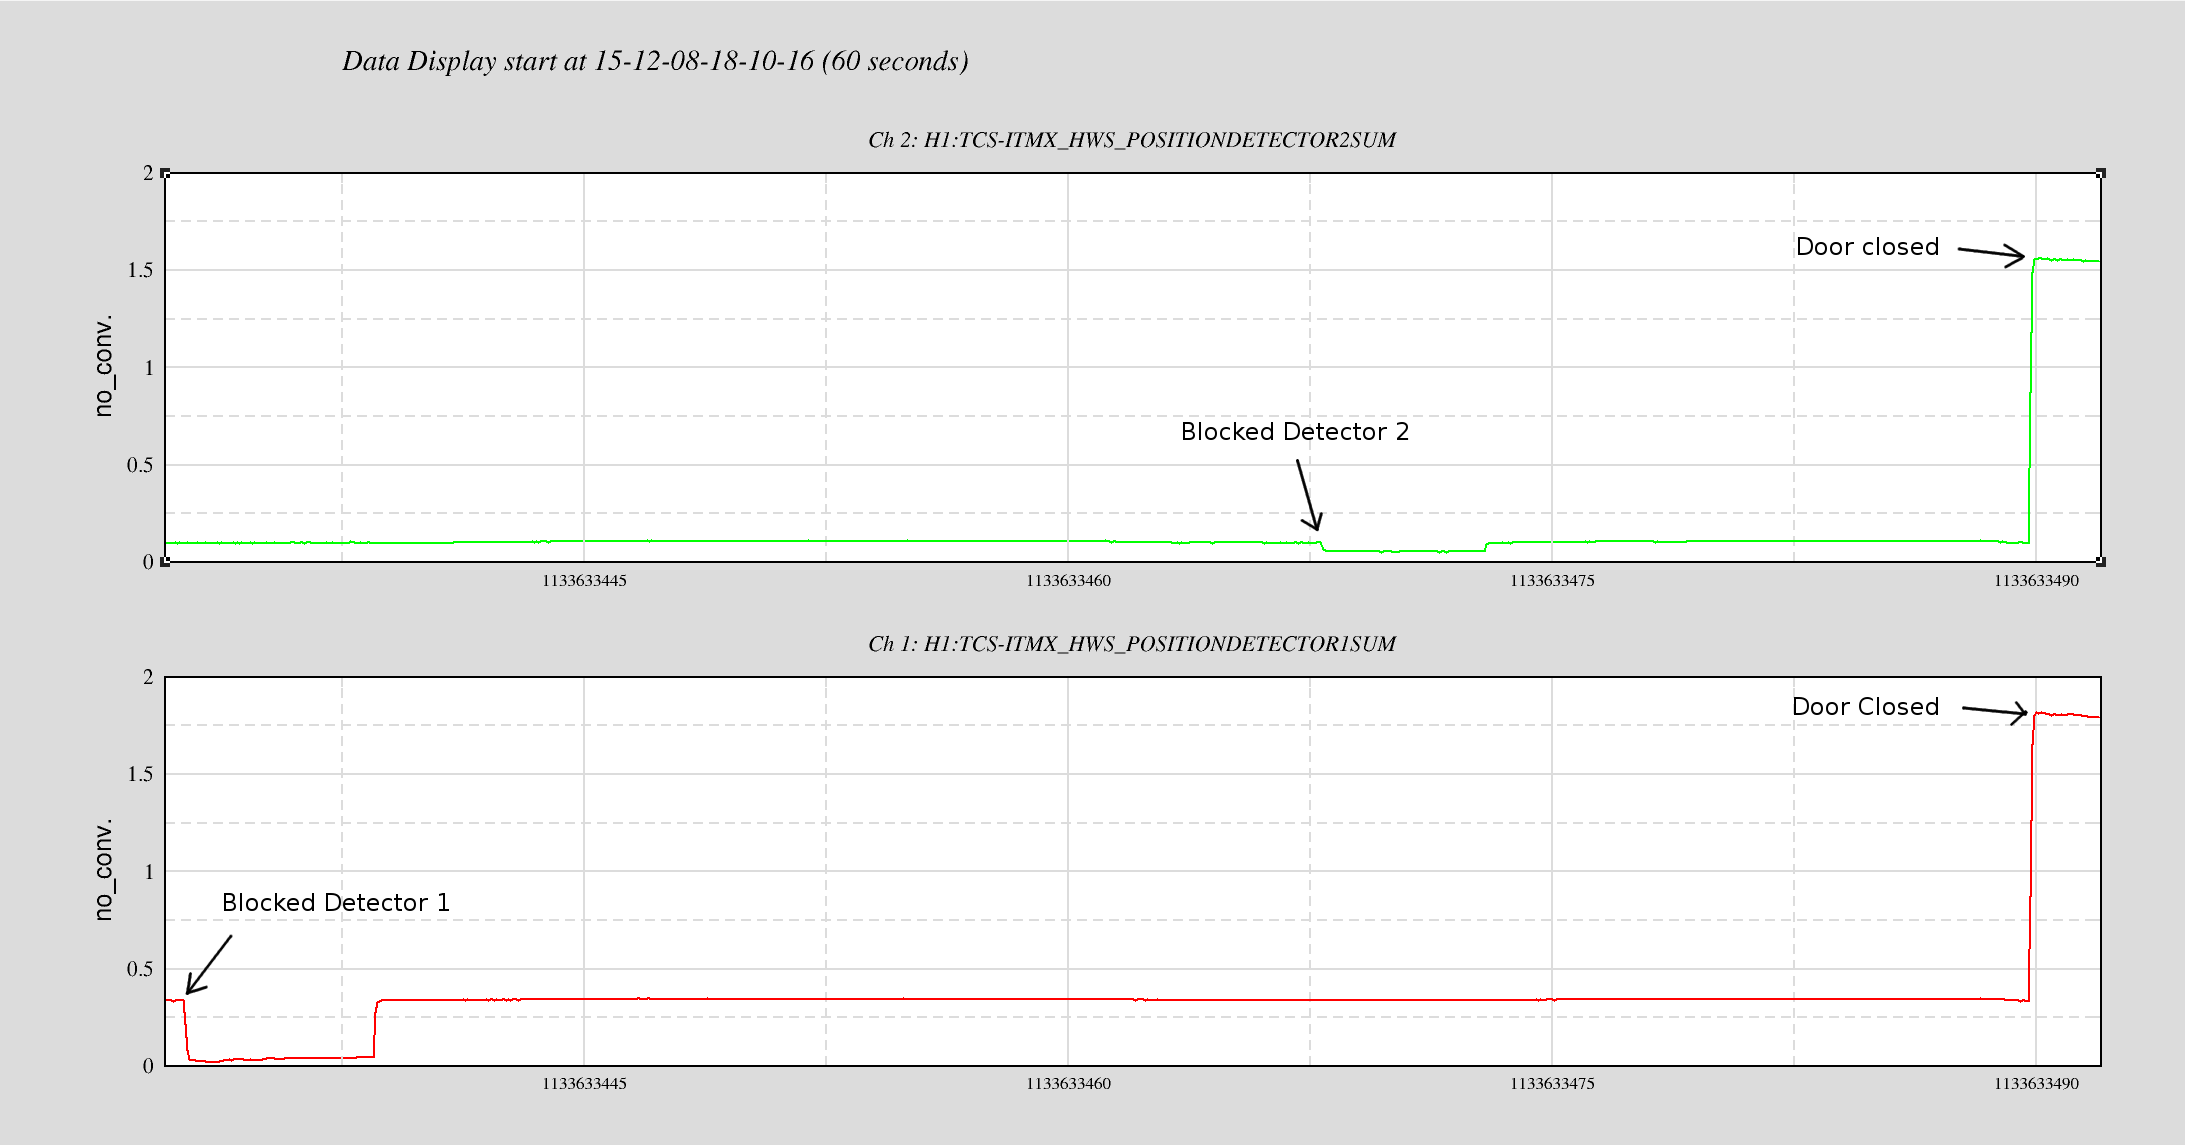
Nutsinee noted the times we blocked each detector and will post that in a follow up comment to this alog. This completes WP 5627.

Here's the time we blocked each detecter:
Detector1 blocked: 18:10:15 - 18:10:21 PST (GPS 1133633432 - 1133633438)
Detector2 blocked: 18:10:50 - 18:10:55 PST (GPS 1133633467 - 1133633472)