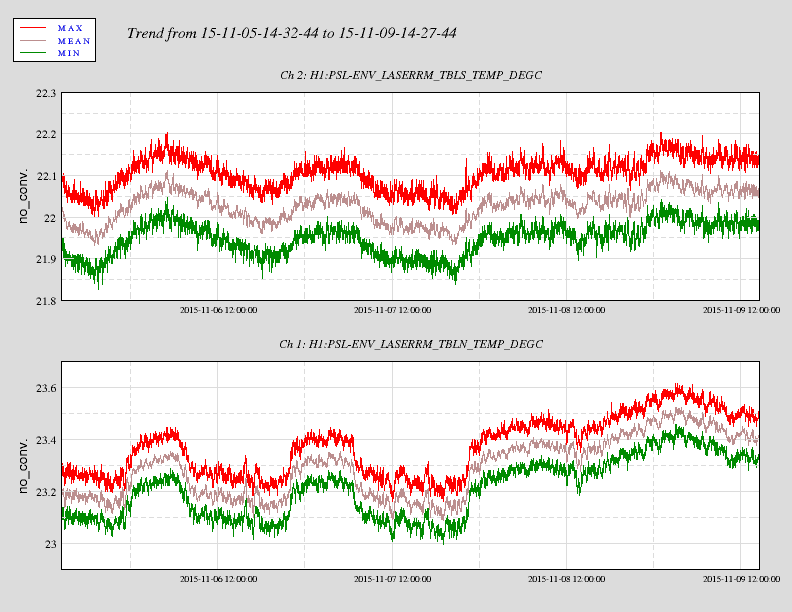
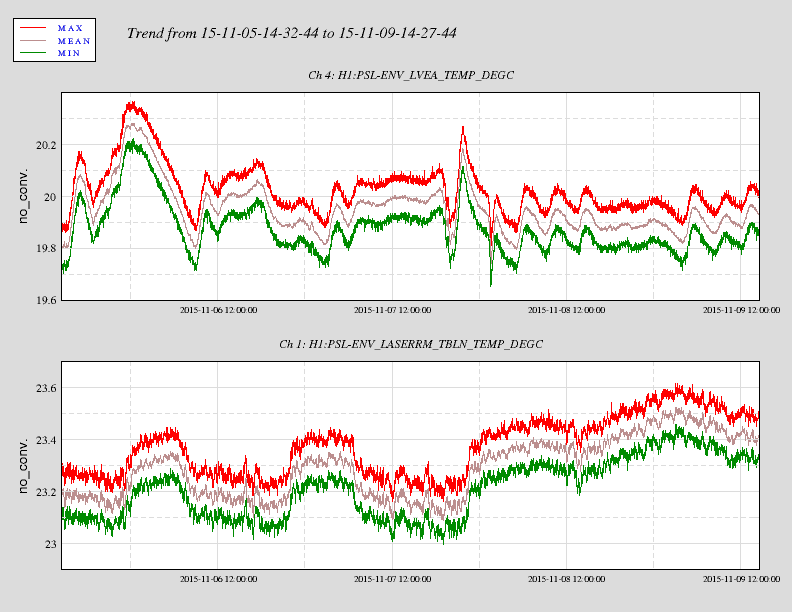
peter.king@LIGO.ORG - posted 06:42, Monday 09 November 2015 - last comment - 06:59, Monday 09 November 2015(23238)
H1 PSL temperatures
The past 4 days of temperatures in the PSL Laser Room, and the LVEA as seen by the PSL temperature sensors.
Nothing appears to be out of the ordinary.
Images attached to this report
Comments related to this report
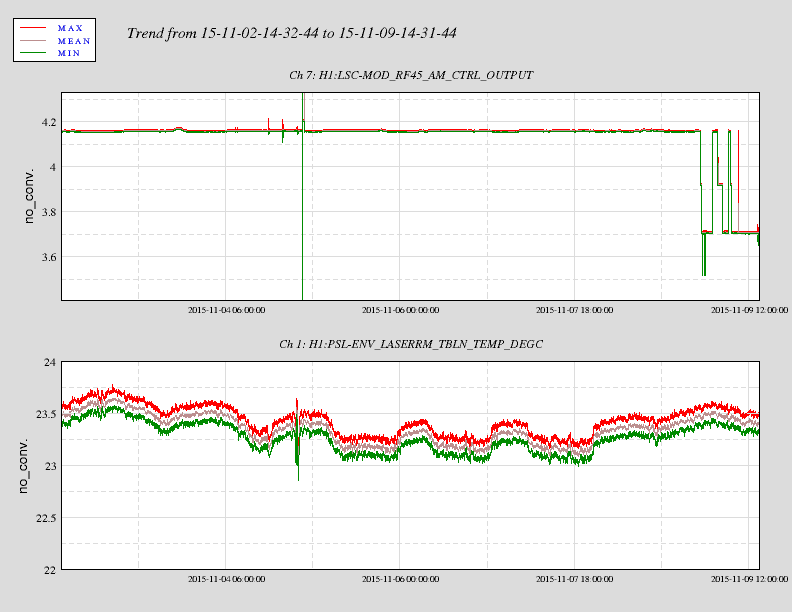
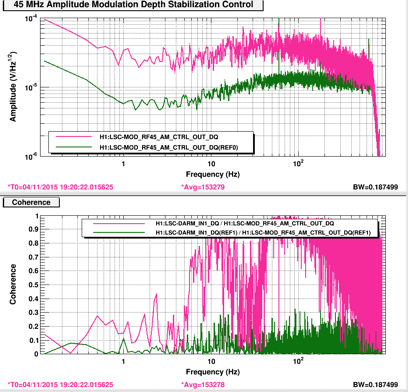
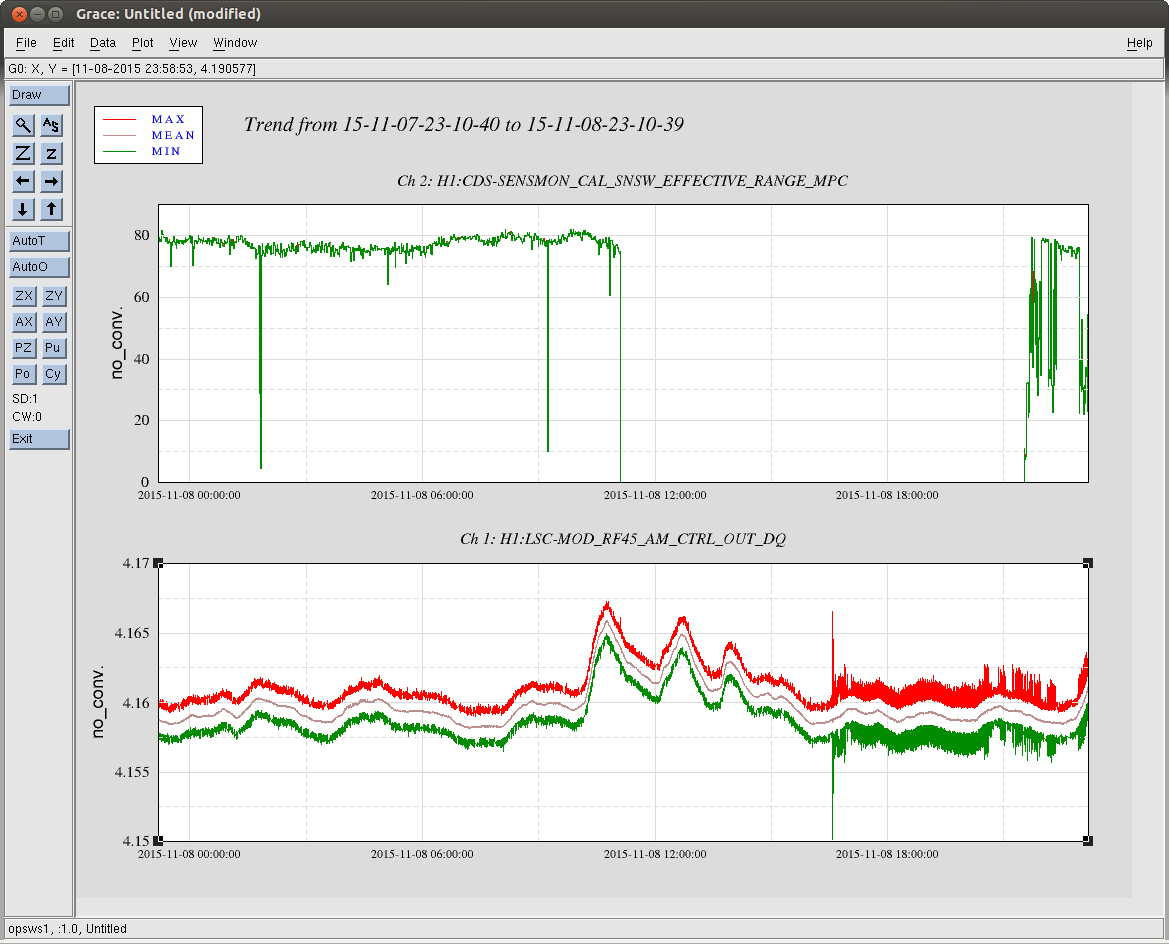
Plot of room temperature and RF45AM signal.  Does not appear to be a room temperature issue as there
are periods when the room temperature is just as high but there is no observed glitching in the RF45AM
signal.
Images attached to this comment