What was done:
-
RF AM measurement unit (D0900891) installation.
-
Taping down 45MHz cable from the ISC ract to the EOM driver.
-
Rephasing
1. RF AM measurement (D0900891) unit installation
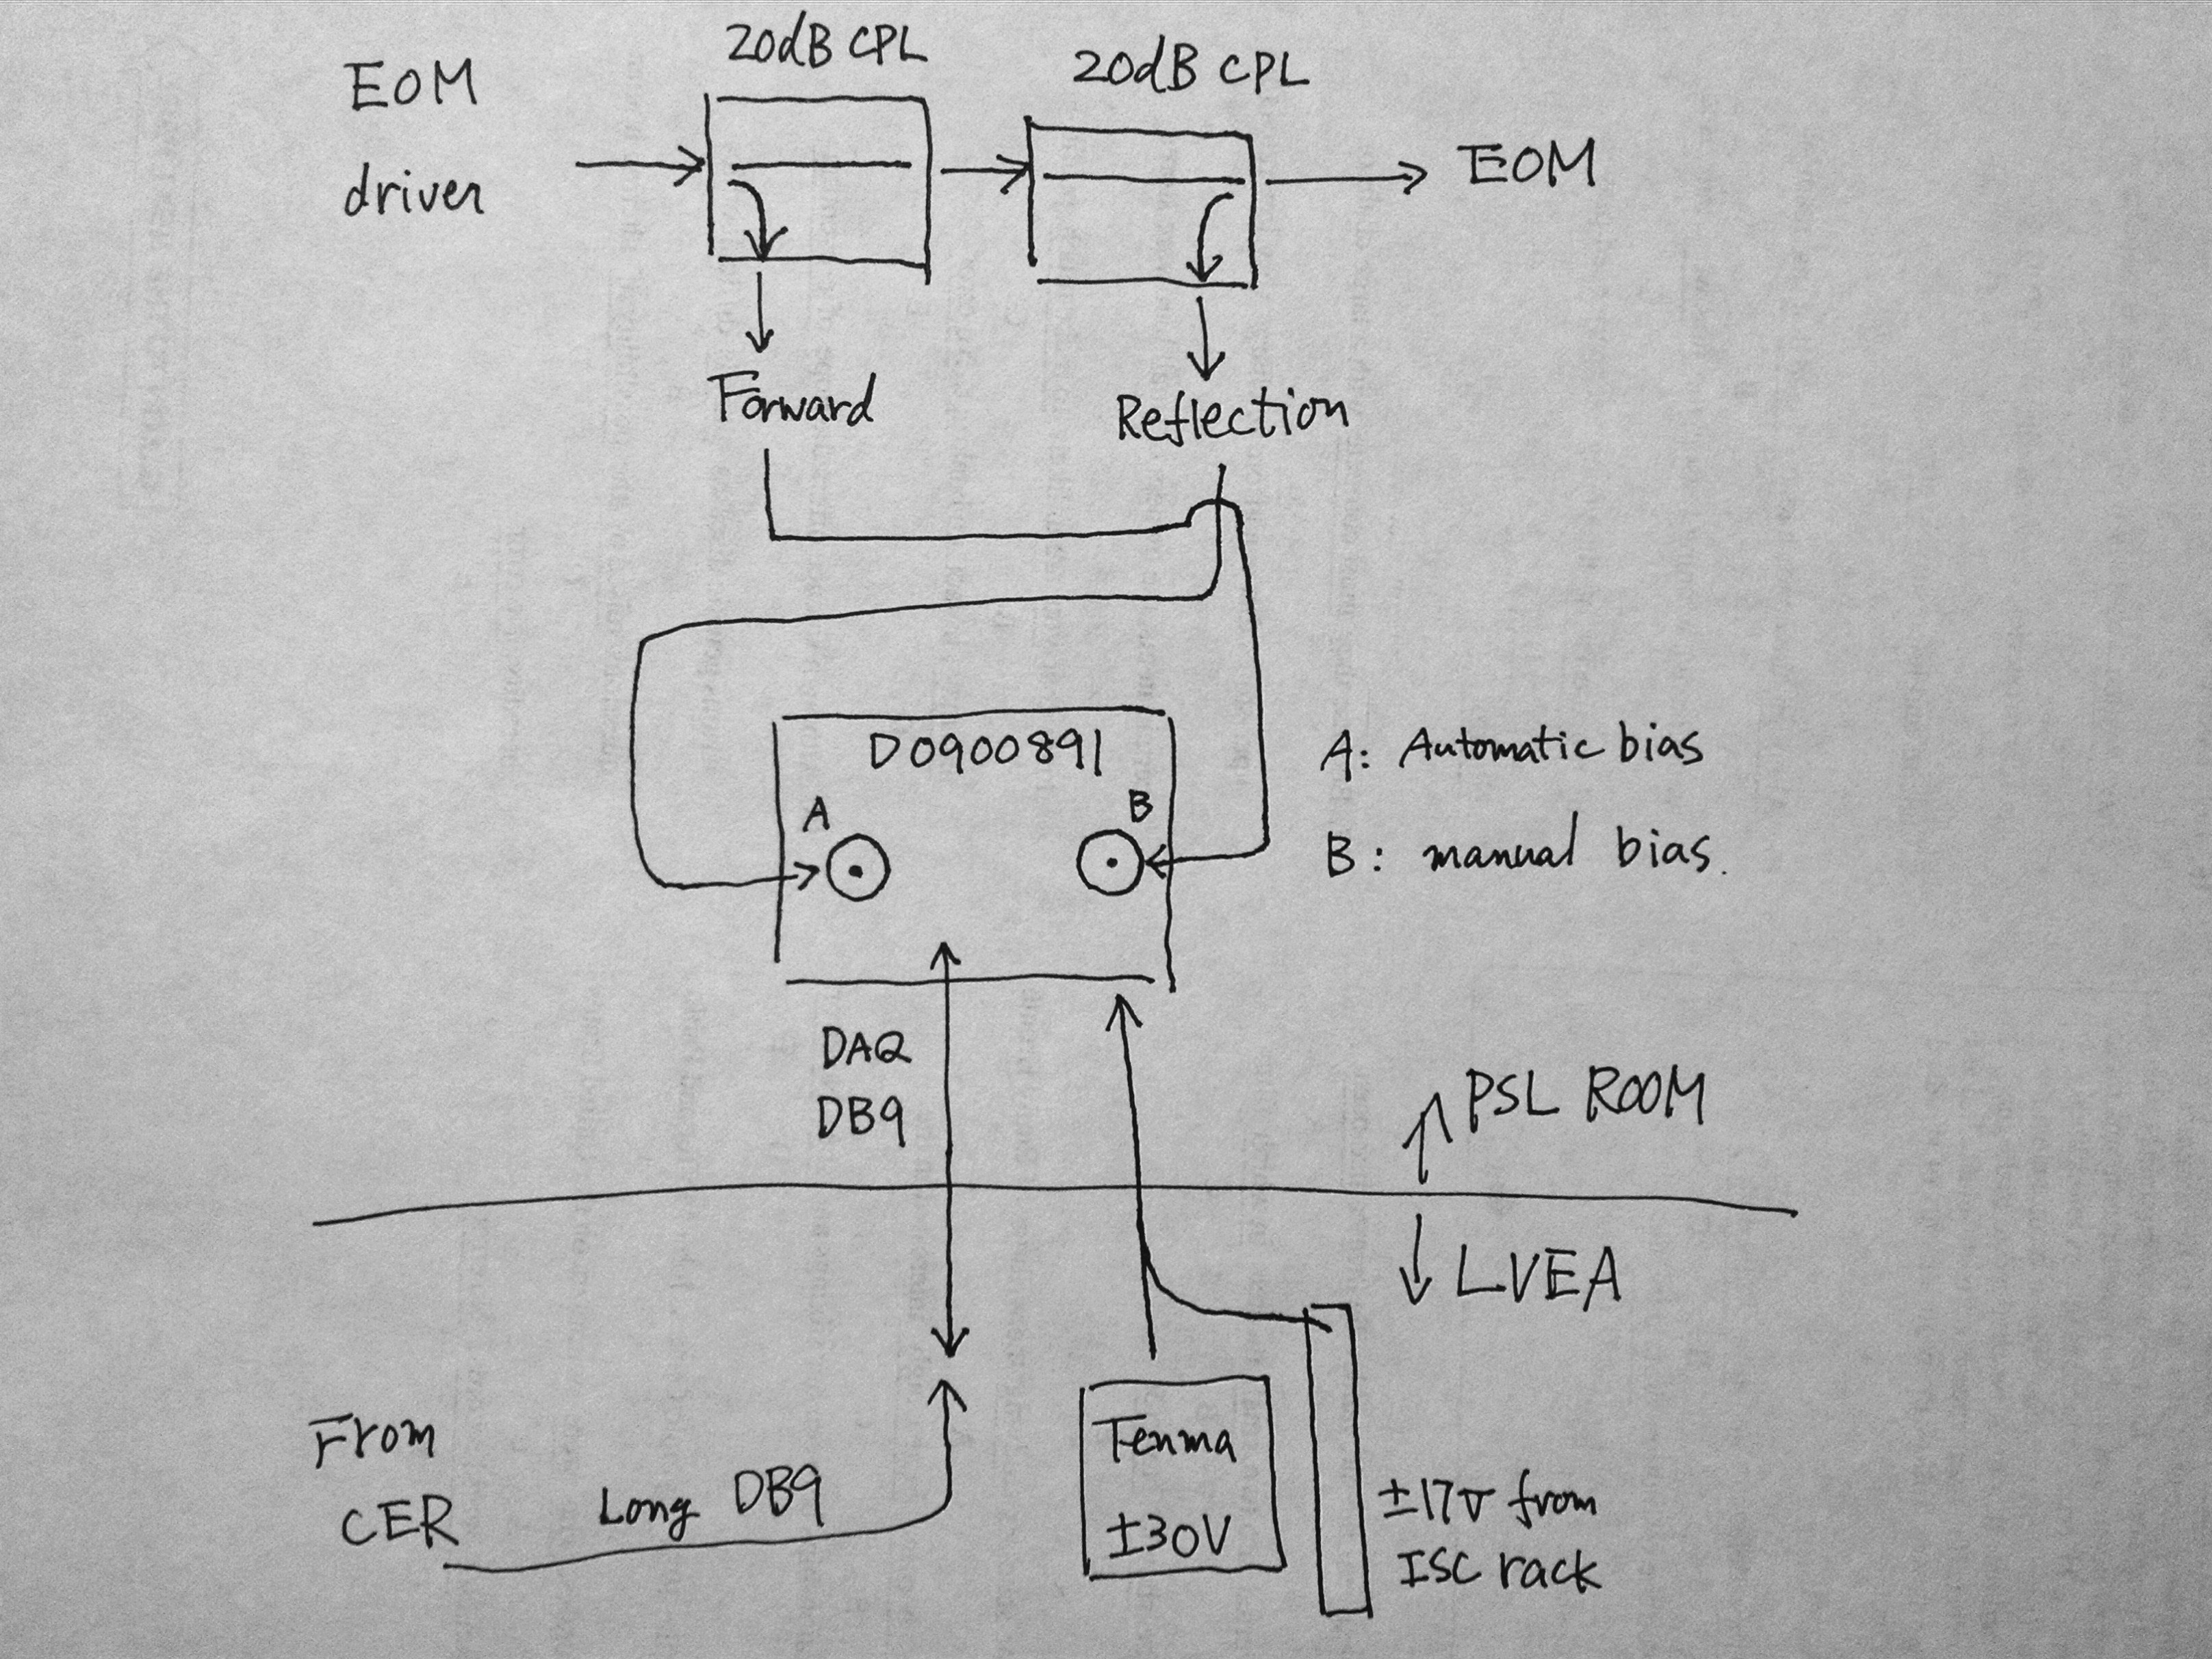
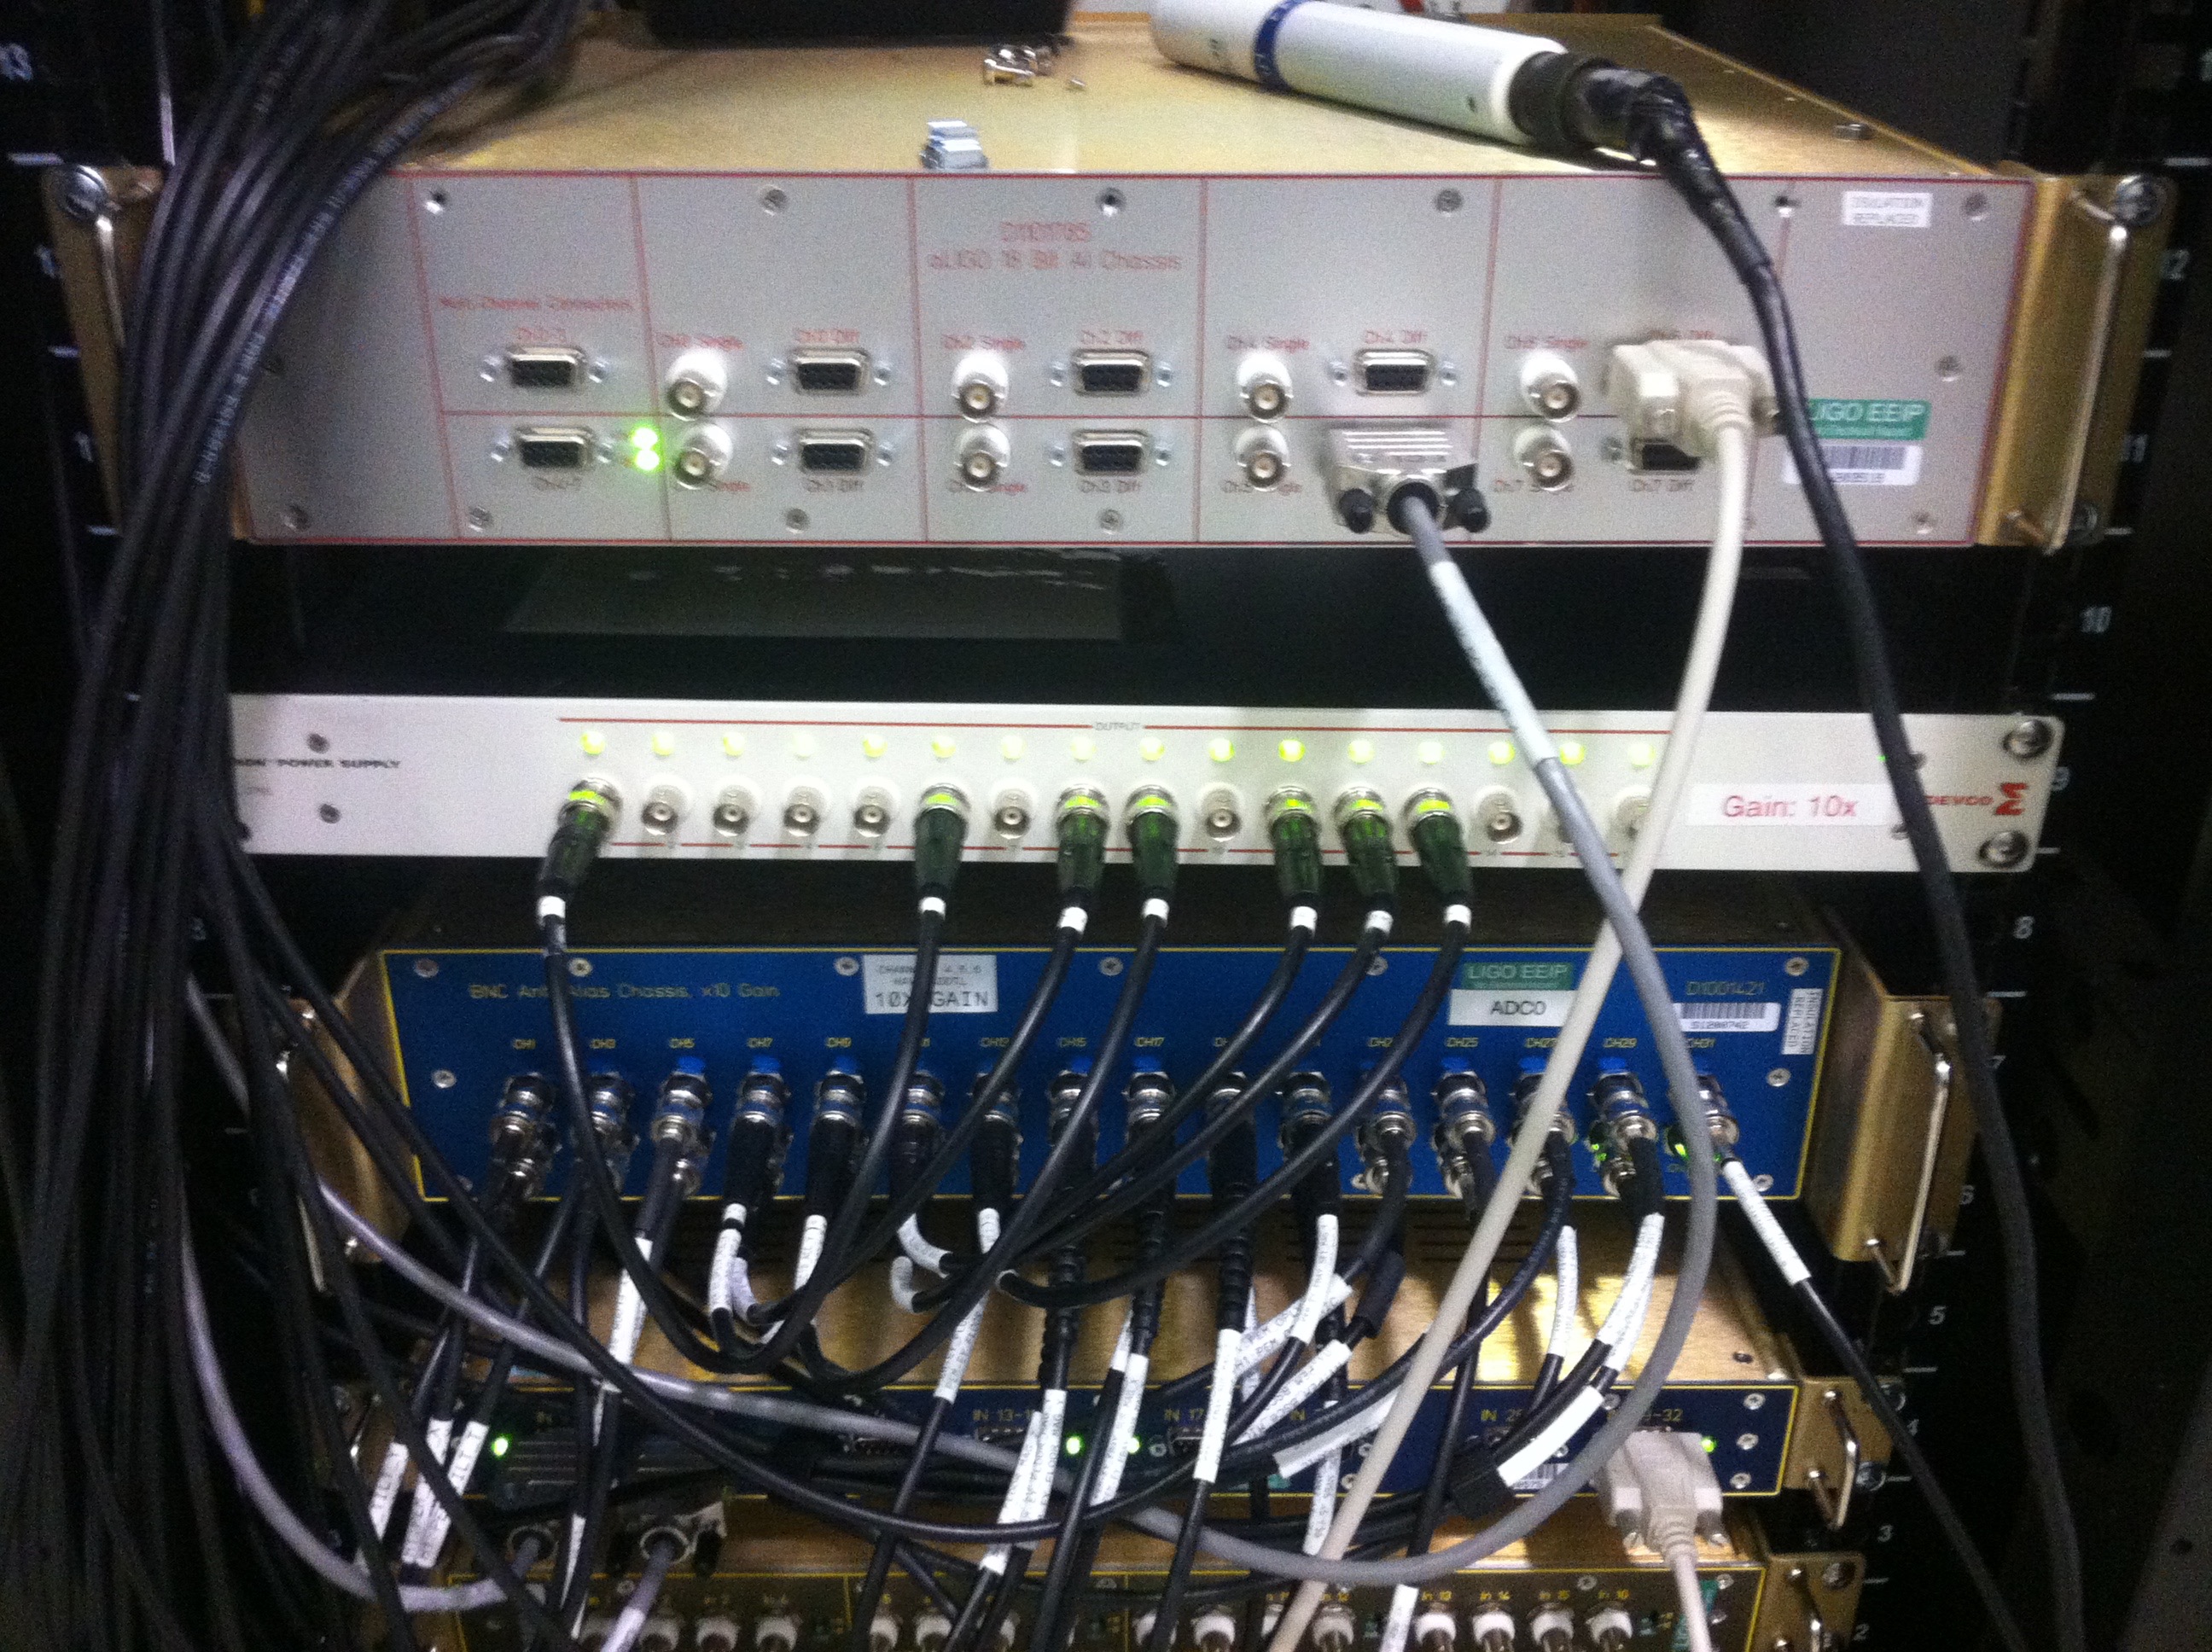
To better diagnose the problem, we inserted RF AM measurement unit (D0900891) between the EOM driver and the EOM.
For connection cartoon, see the first attachment.
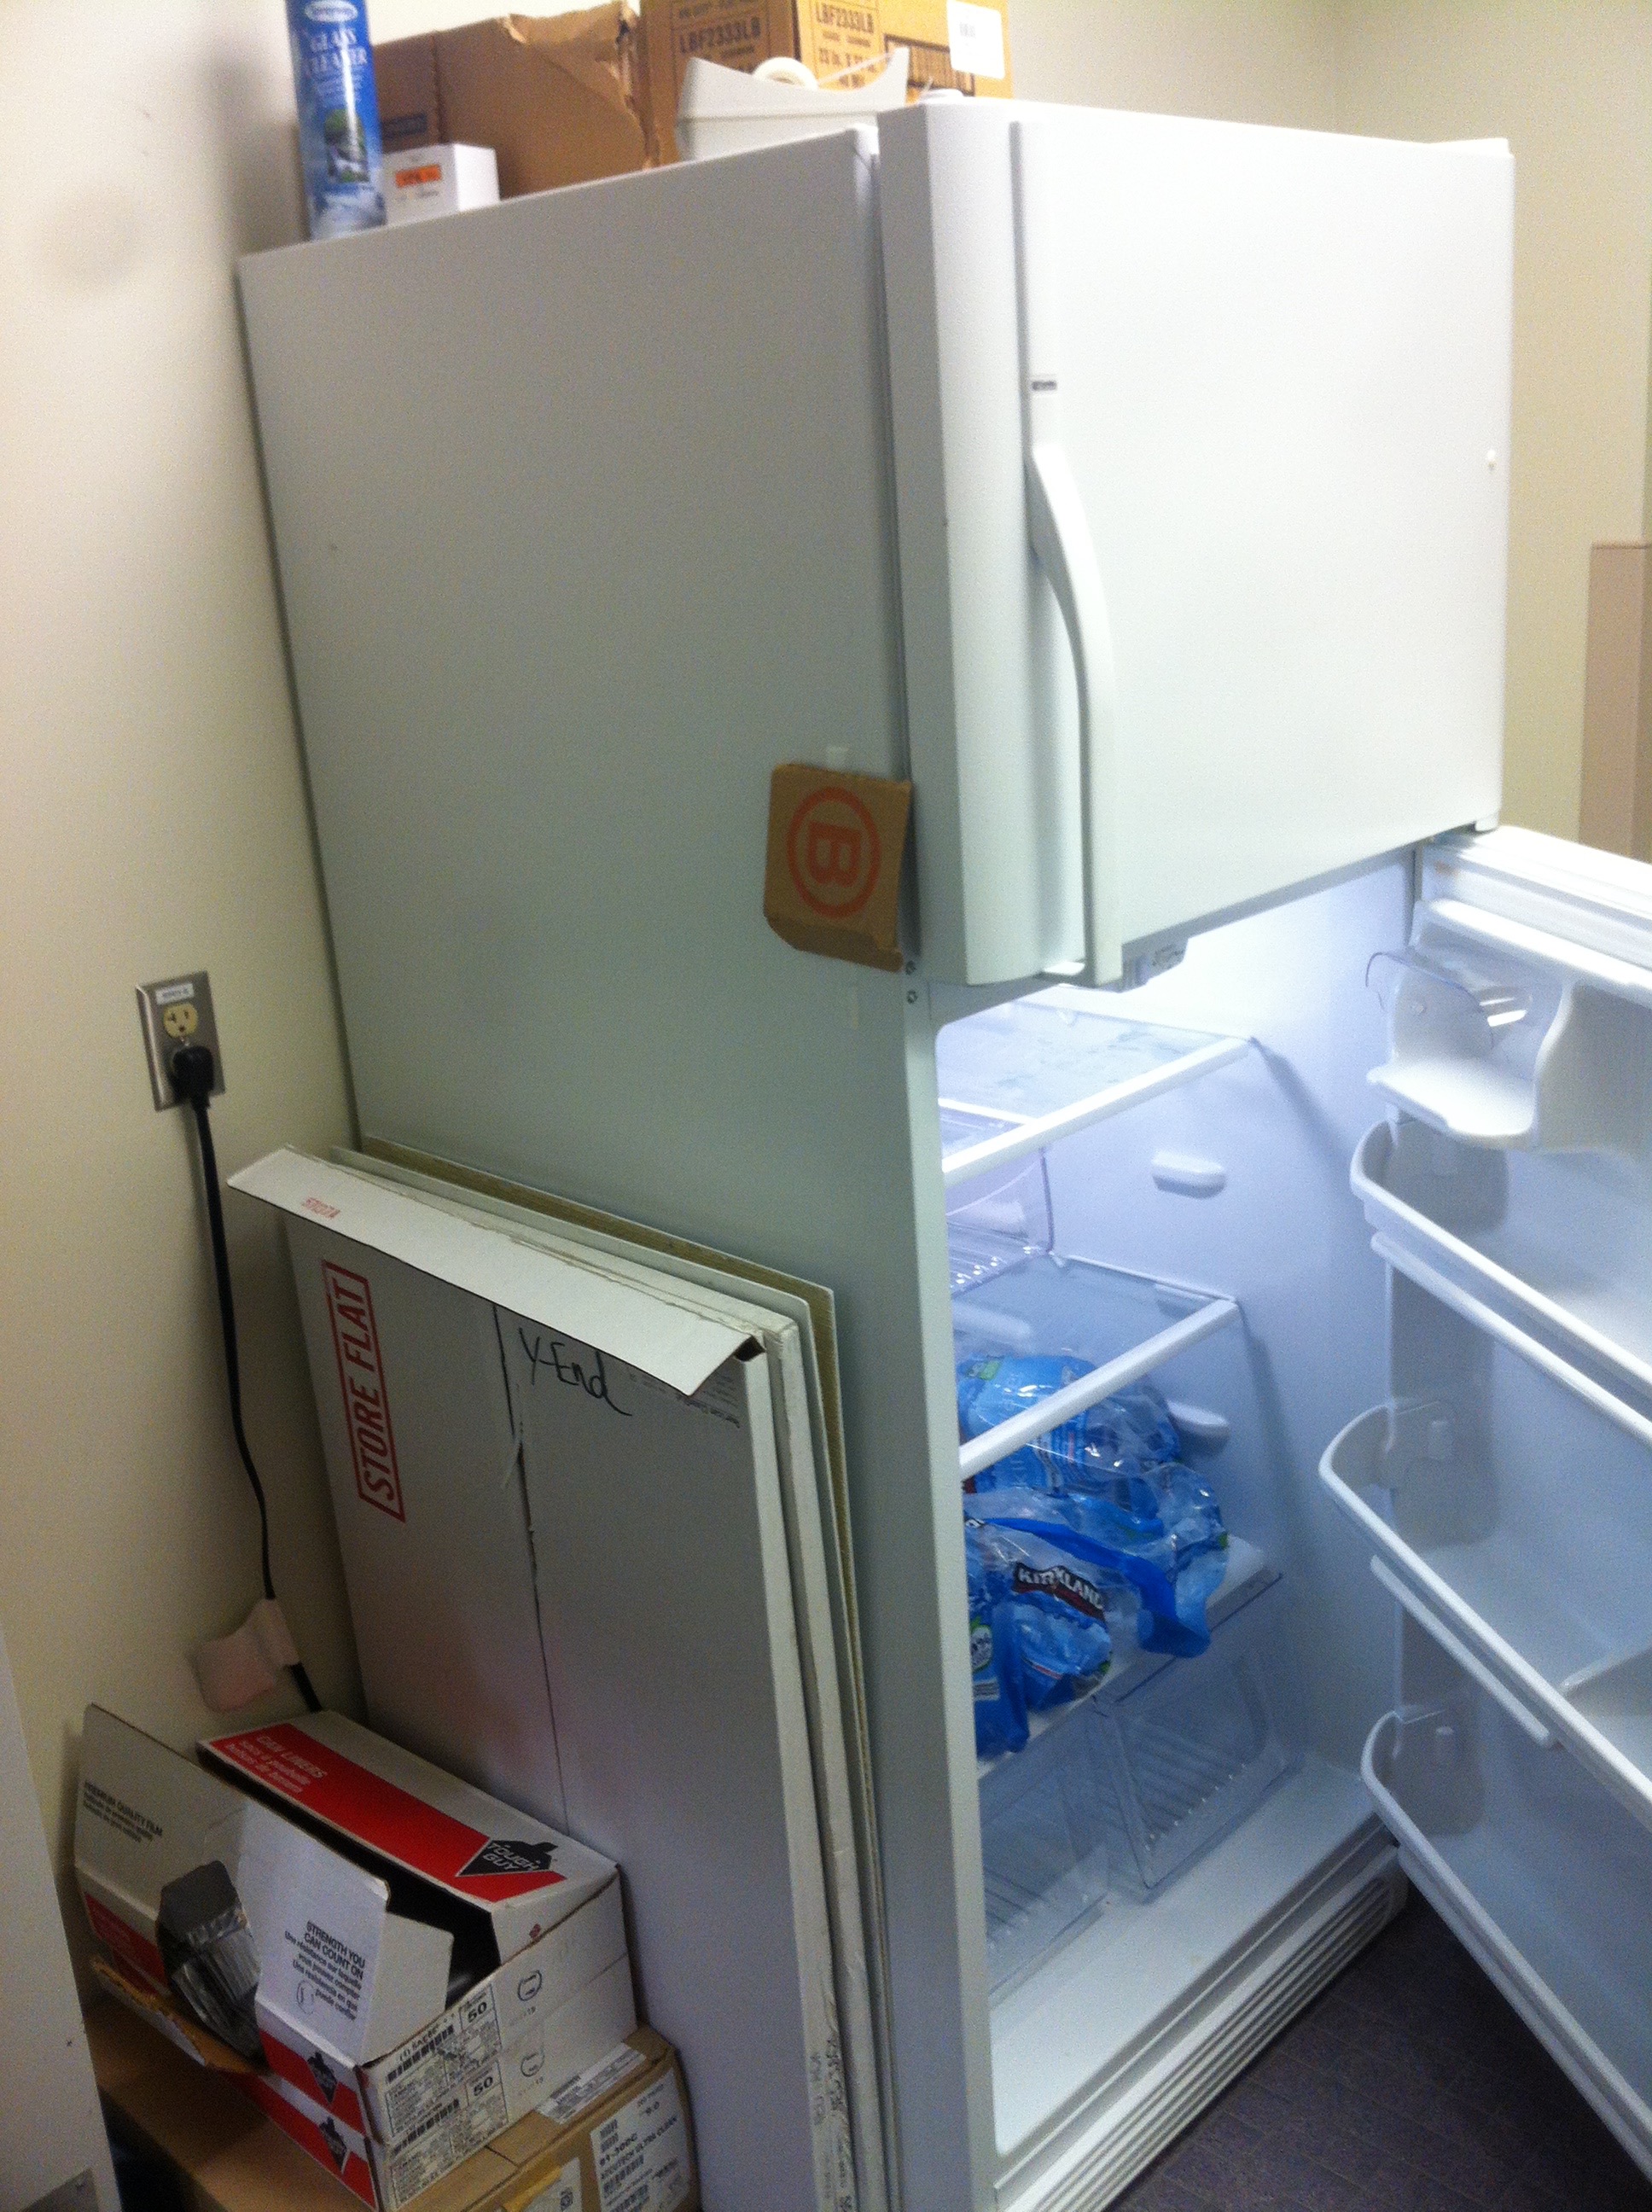
The unit was placed on top of the DCPD interface box that was next to the EOM driver.
Couplers are connected back to back such that the first one sees the forward going RF, the second one the reflection from EOM. Insertion loss of one coupler is rated 0.3dB and this was confirmed by the power measurement. Driver output was 23.34dBm (measured by RF meter with 30dBm attenuator), after the second coupler it was 22.67, so the insertion loss of two couplers is 0.67dB. We didn't do anything to compensate, it's not a big deal. But this means that the modulation index is smaller by that much.
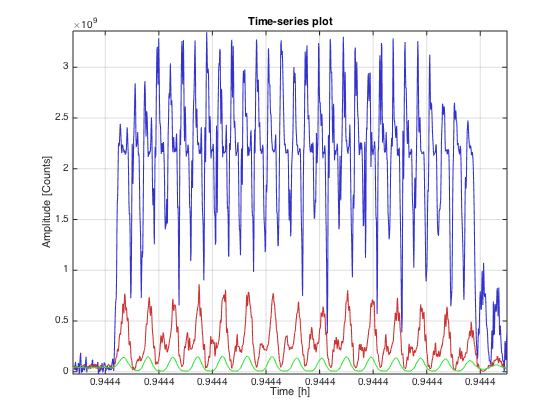
EOM reflection was measured by looking at reverse direction coupler output on the scope, which was about -11.6dBm (about 59.1 mVrms with 50 Ohm input). The reflection from EOM should be something like 20-11.6=9.4dBm, i.e. EOM is only consuming 22.67-9.4 ~ 13.3dBm.
Just so we can, Kiwamu tightened the SMA connectors on the EOM inductor box. We also wiggled various things but didn't get any new insight except that wiggling/tapping power cable/connector on the EOM driver and on +-24V distribution strip didn't do much.
Forward going coupled output was connected to the manually adjusted channel. Front panel was adjusted so the MON voltage becomes closest to zero. That was MON=-300mV at 2.6dBm setting.
Reverse going couple output was connected to the automatically biased channel.
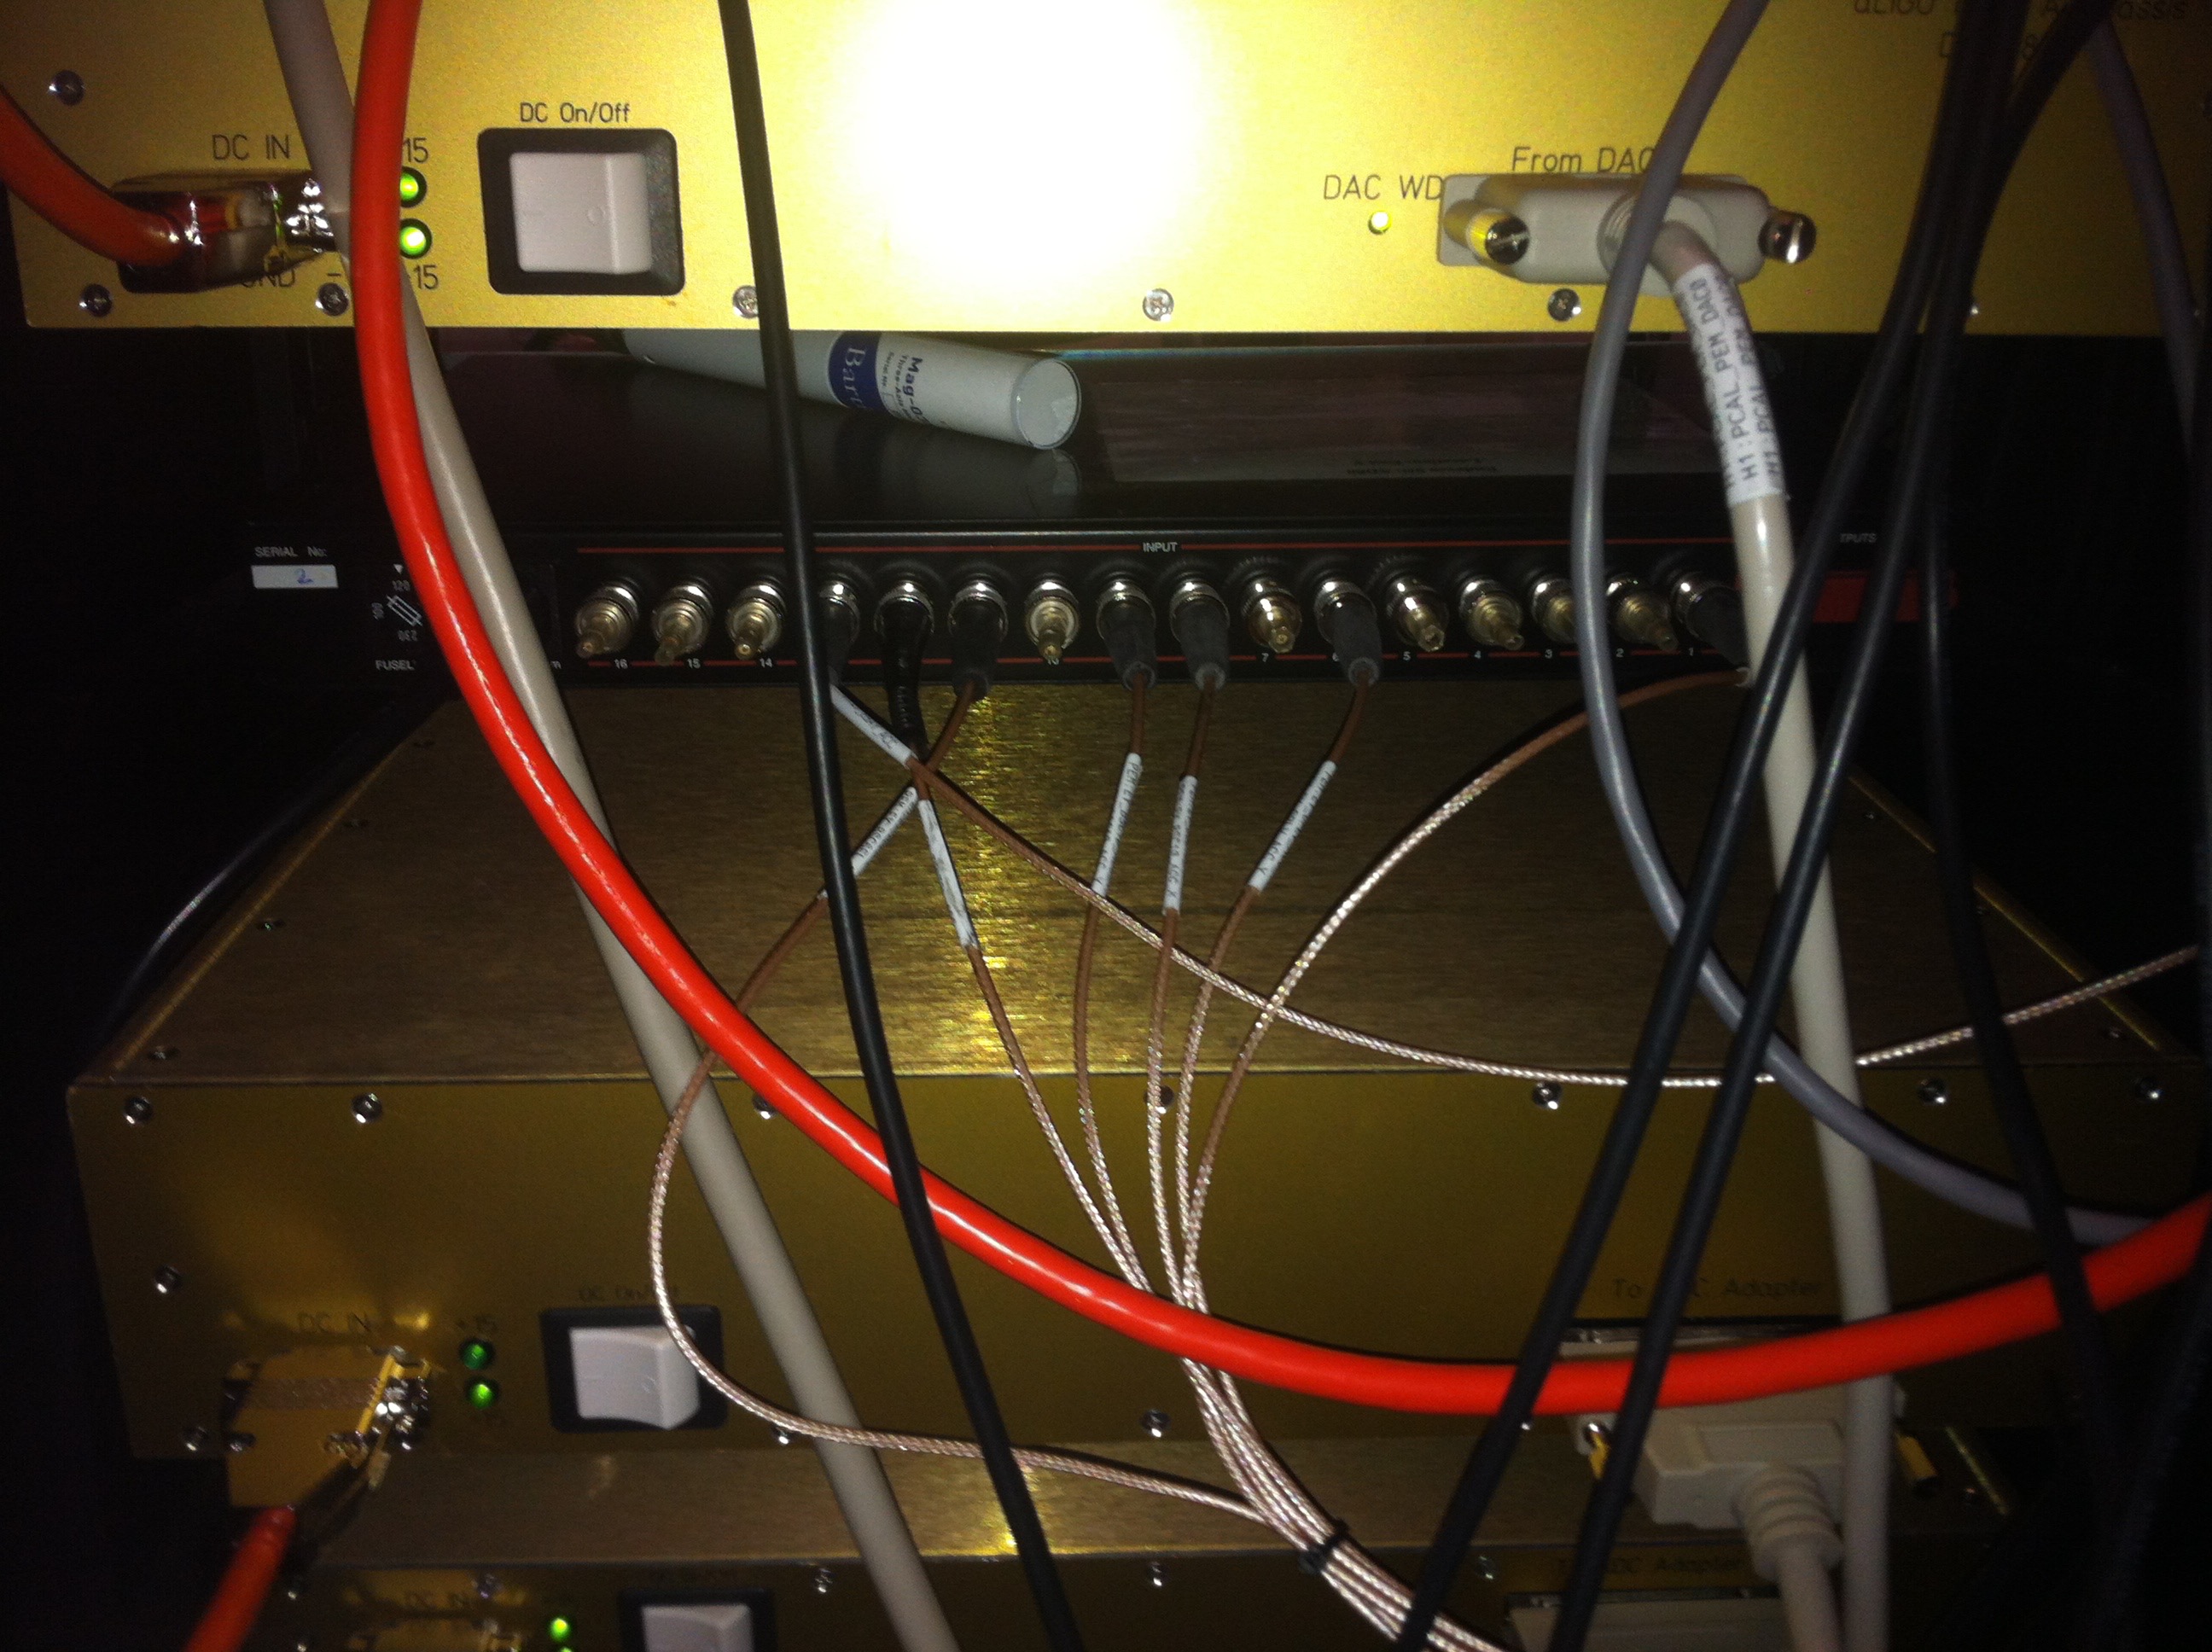
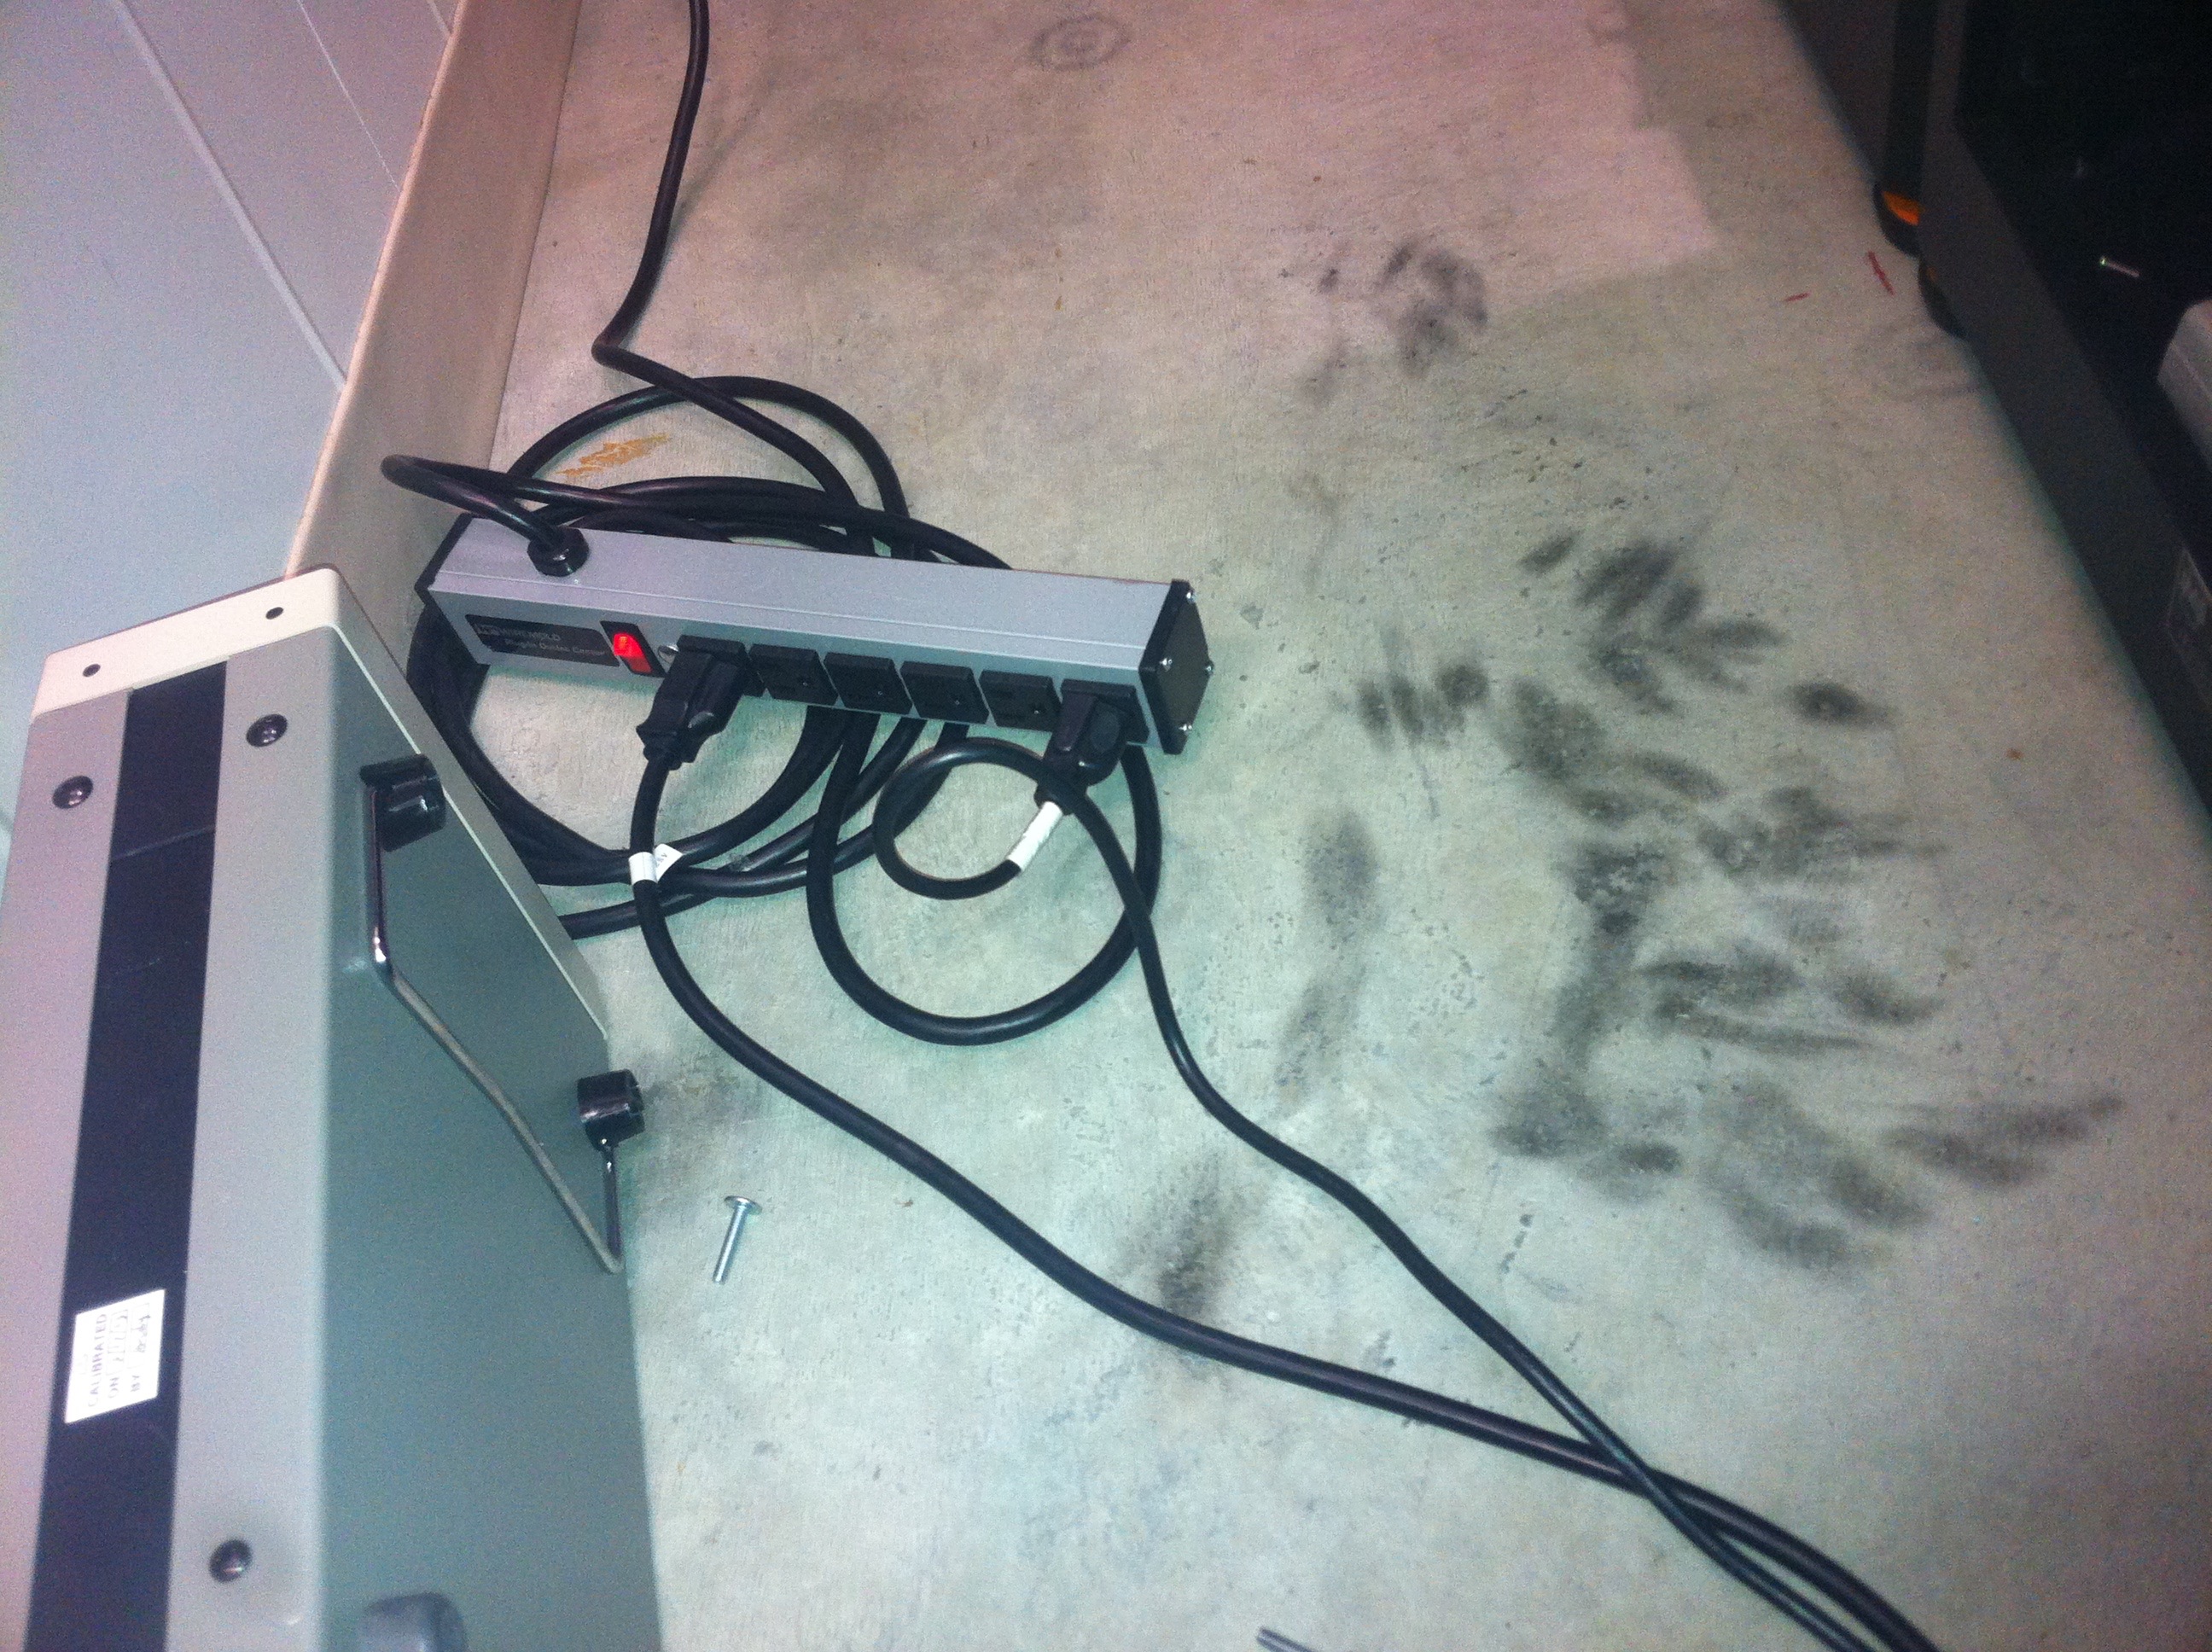
This unit needs >+-28V supply in addition to +-17. Filiberto made a special cable that has bananas for +-30V and usual 3-pin for +-17, and we put a Tenma supply outside of the PSL room for +-30V-ish.
A long DB9 was routed from CER to the PSL rack, and a short one was routed from the PSL rack to the RF AM measurement unit, for DAQ. This was plugged into the spigot that was used for the spare EOM driver unit before (i.e. "RF9" monitors).
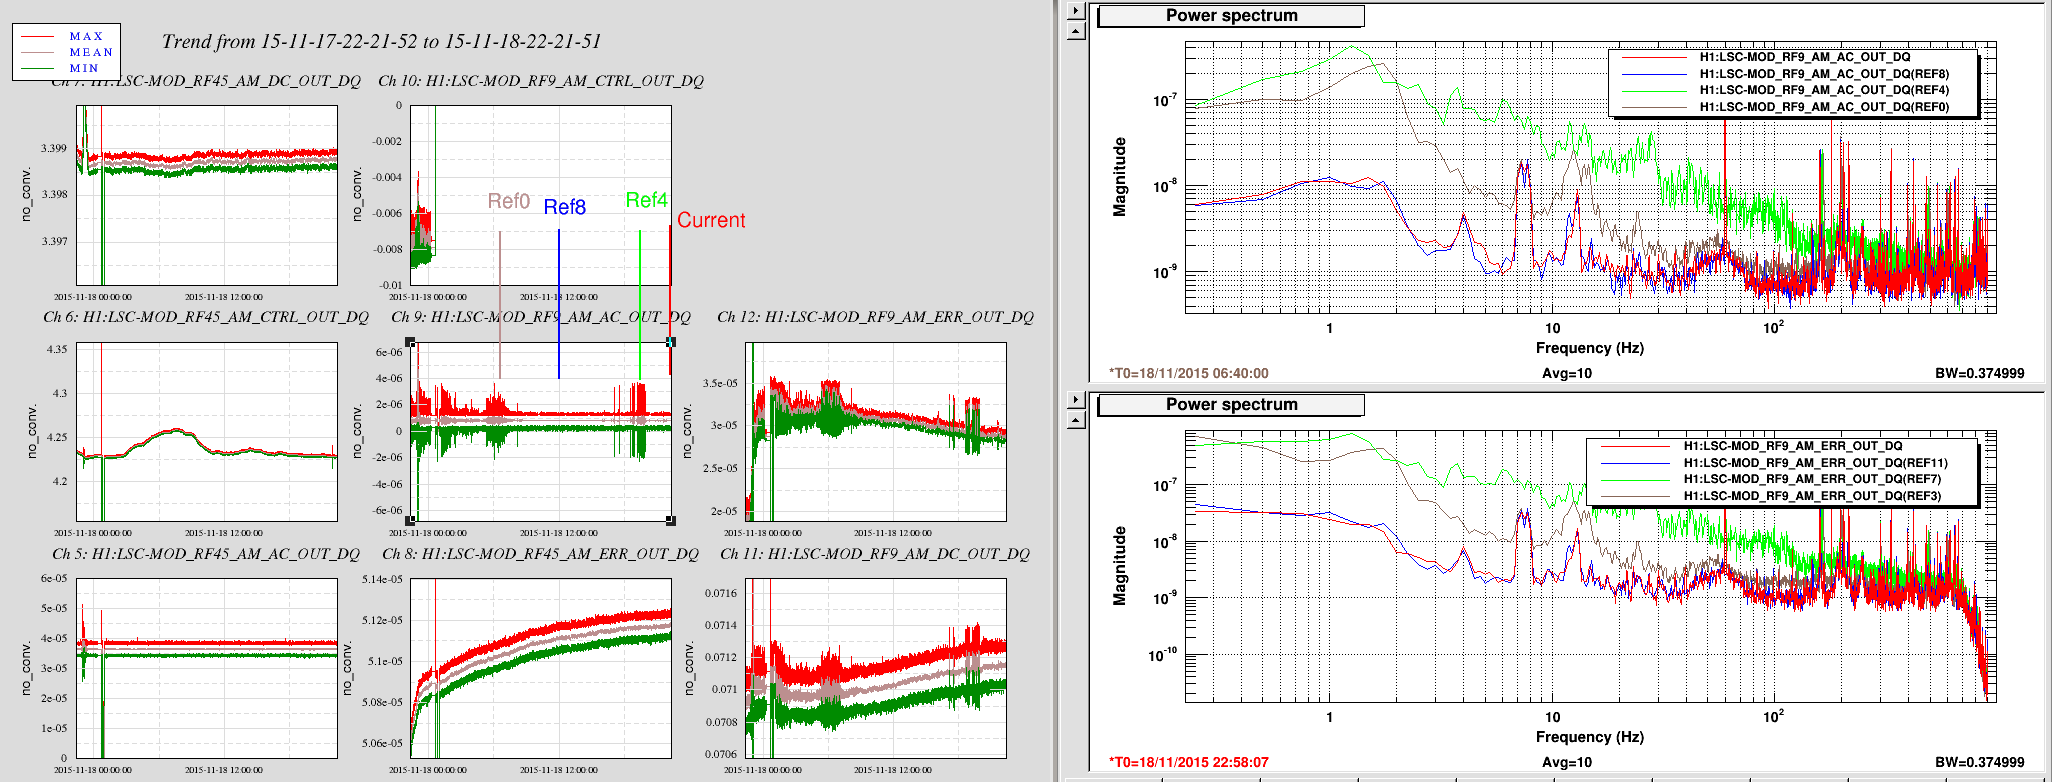
H1:LSC-MOD_RF9_AM_ERR_OUT_DQ and H1:LSC-MOD_RF9_AM_CTRL_OUT_DQ are for EOM reflection monitor.
H1:LSC-MOD_RF9_AM_AC_OUT_DQ and H1:LSC-MOD_RF9_AM_DC_OUT_DQ are the channels for forward going RF monitor. AC corresponds to ERR and DC to CTRL.
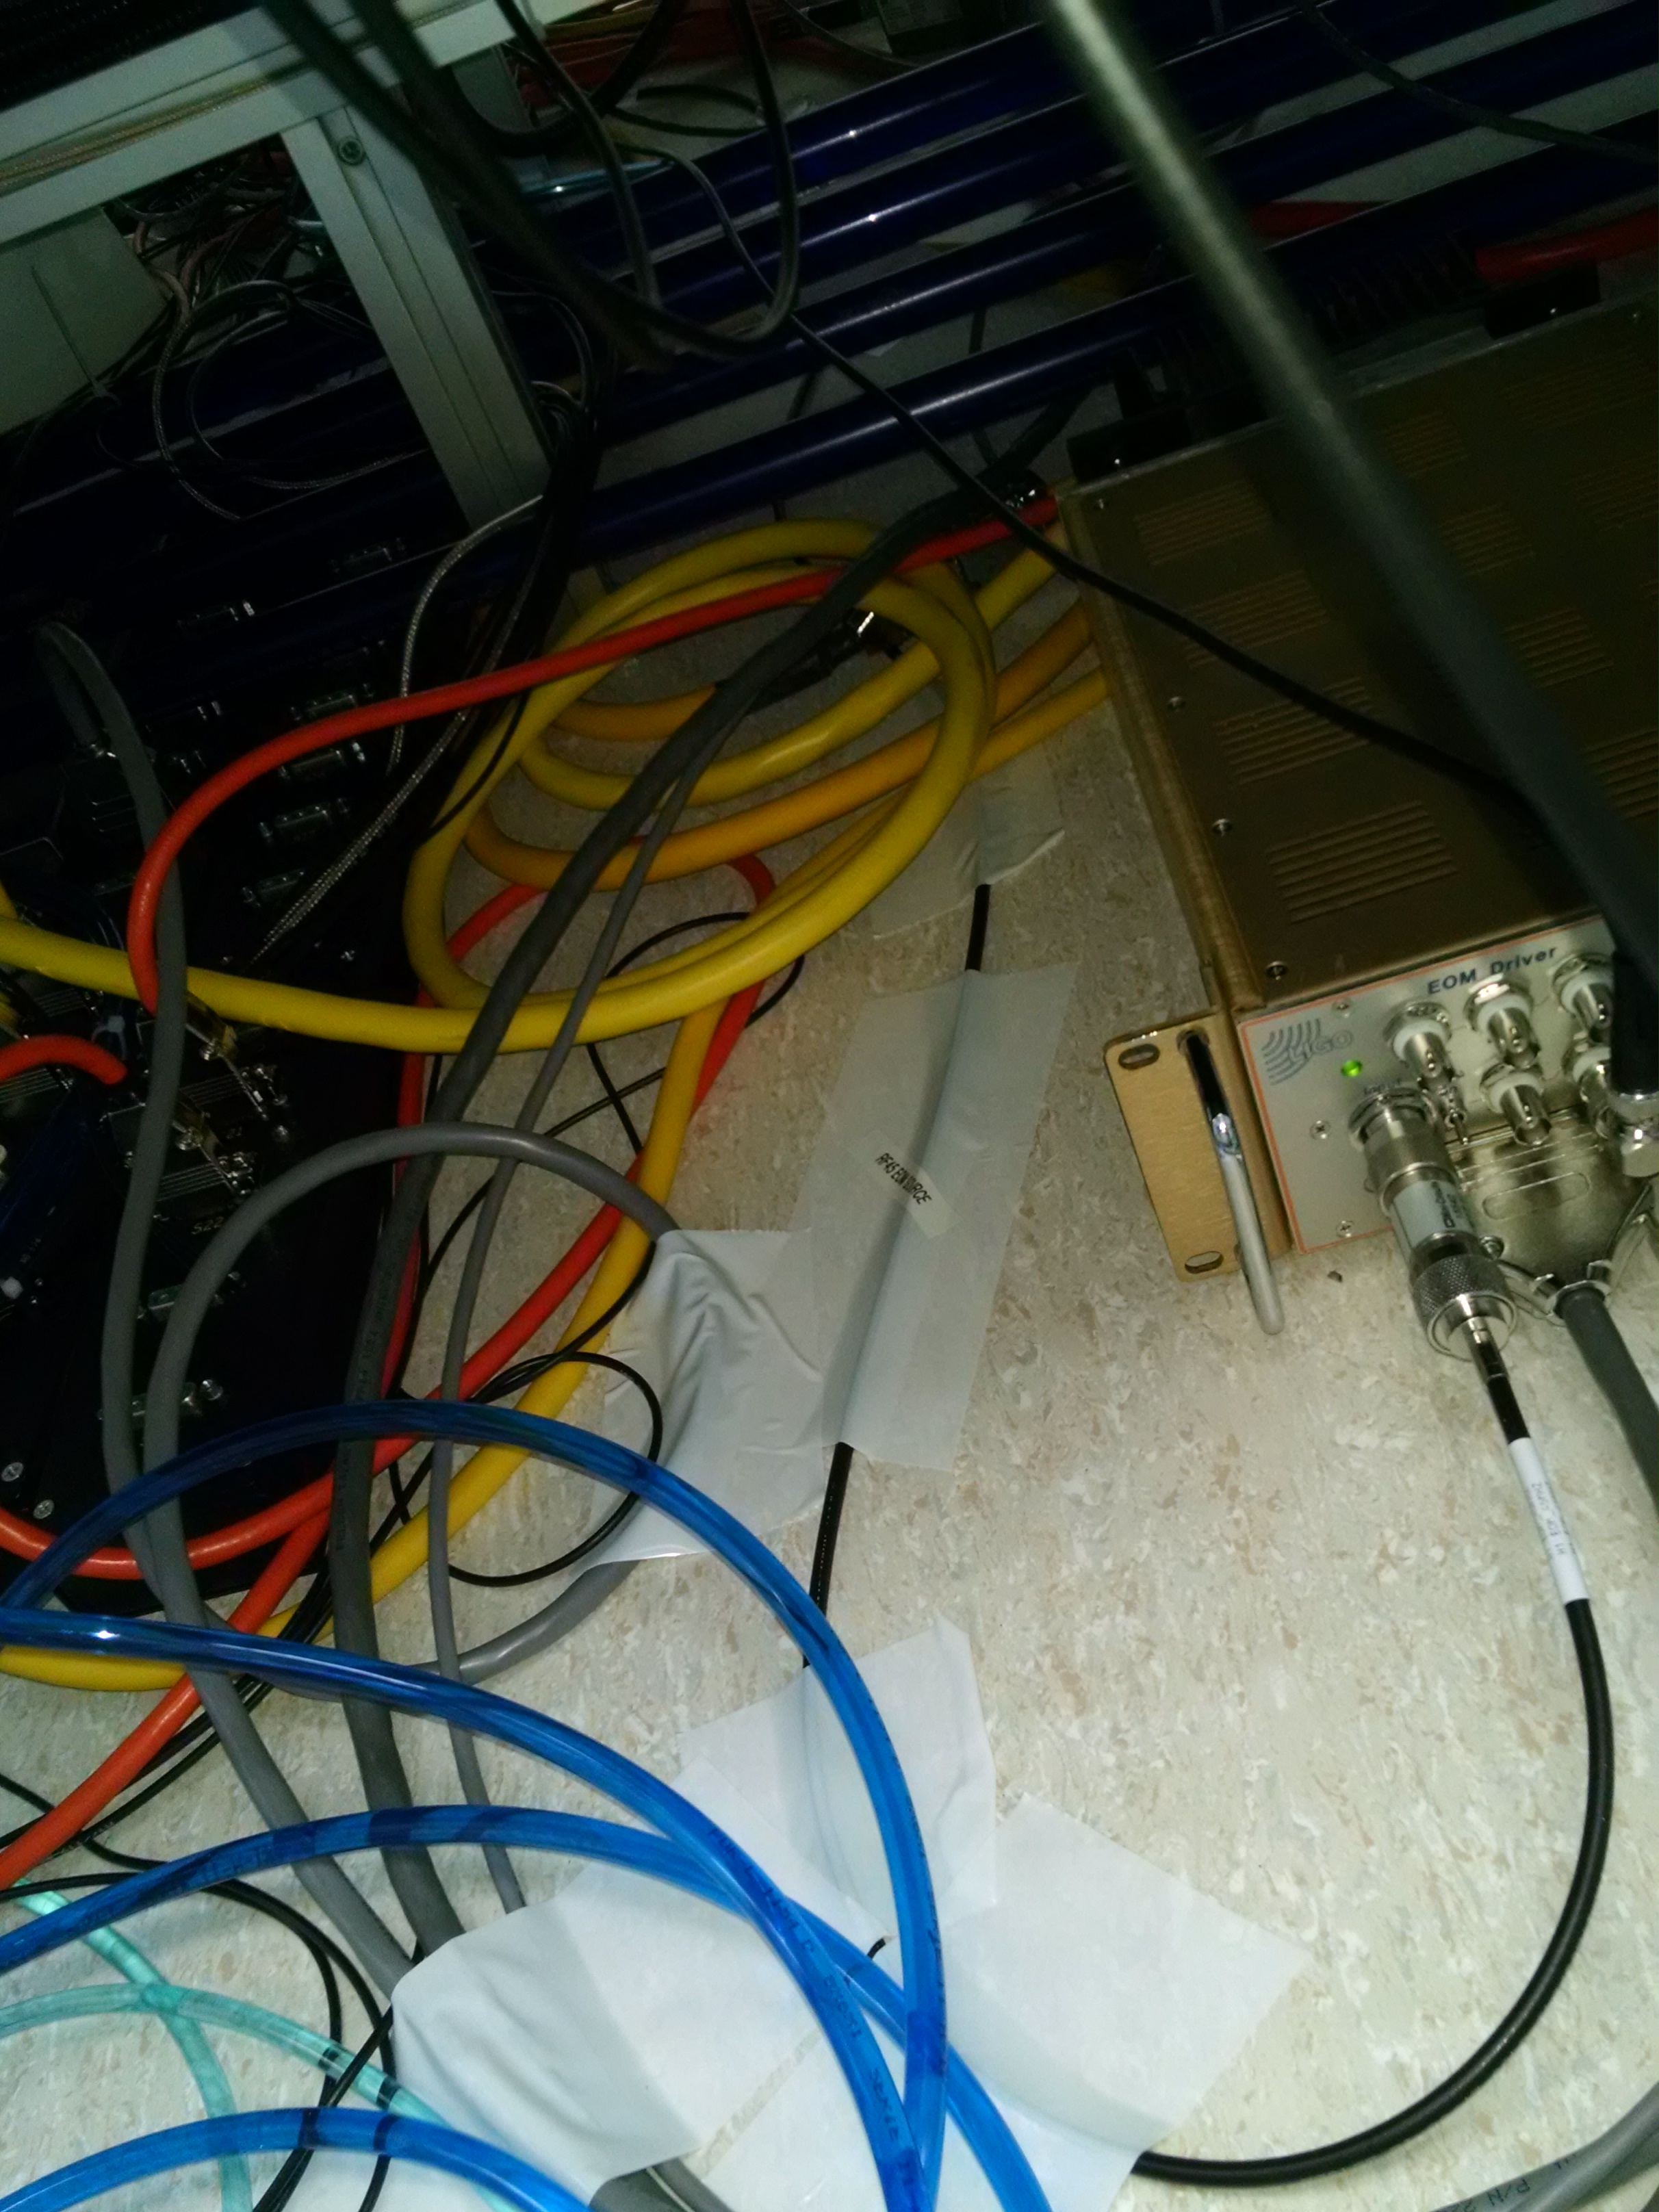
2. Taping down 45MHz cable
We changed the routing of the RF cable between the driver and the ISC rack. Inside the PSL room, it used to go under the table but over the under-table cable tray, and kind of floating in the air from the floor to the cable tray, and from the cable tray to the EOM driver, pushed by other cables.
We rerouted the cable so that it never leaves the floor, and taped it to the floor using white tape. We also taped down some of the cables that were pressing against the RF cable. See the second attachment.
3. Rephasing
In the lab, the delay of the double couplers alone for 45.5MHz signal was measured to be about 0.8 ns or 13 degrees. Kiwamu made a long cable, we added two N-elbows, and we measured the transfer function from ASAIR_A_RF45_I_ERR to Q_ERR. We ended up having:
Q/I = +4.45 (+-0.14), or 77.3 (+-0.4) degrees.
Before the installation this was 77.5 (+-0.1) deg (https://alog.ligo-wa.caltech.edu/aLOG/index.php?callRep=23254), so this is pretty good.