TITLE: Nov 17 DAY Shift 00:00-08:00UTC (04:00-00:00 PDT), all times posted in UTC
STATE Of H1: Down
SUPPORT: Jenne
LOCK DURATION: Lock clock had us at over 12 hours. Lockloss reset. Don’t know actual time.
INCOMING OPERATOR: Nutsinee
END-OF-SHIFT SUMMARY: IFO Down. Earthquake
ACTIVITY LOG:
02:56 I believe I heard a plane pass overhead.
05:28 Livingston lost lock about 20 minutes ago. I called Will in their control room and he reported that winds had picked up to 15mph. sheesh.
05:45 I noticed to back-back 45MhzRFAM glitches. There may have been a couple more since 35 minutes ago. The Omega graph doesn’t show glitchy activity prior to that. As of now it doesn’t seem to be chronic.
06:42 Winds have calmed down to ≤20mph. Mich Live is fidgety between 10Hz and 11Hz. I don’t see any RF45 correlations to this. Range chart shows Livingston dropping lock almost exactly that we have a very large glitch and after that, we’re a glitchy mess. The RF45 business from my previous log is part of that and there was one really large glitch that wan’t 45Mhz or a Saturation. Jordan is checking it out.
06:32 45RFAM glitching for 5 minutes straight.
06:38 With Livingston down I came out of Observing to try and reduce the RF Set on the EOM to try and settle the glitching down.
06:44 Glitches still seem to be present only not as prominent to us. ASAIR_B_LF_90 is becoming unstable looking. No saturations being reported.
06:55 Concerned about saving the lock, I called Jenne. There doesn’t seem to be any action to take regarding this issue other than to aLog it. While we’re talking RF45 is settling down. I’ll wait until our range is back to where it was previously before setting the intent bit back to observing.
07:34 Lockloss. 6.5mag earthquake off the coast of Greece. I have to laugh because after the really tough time locking y-arm last night, it was the first to lock right up despite all the ground motion while x-is still hopping crazy. Handing of to Nutsinee
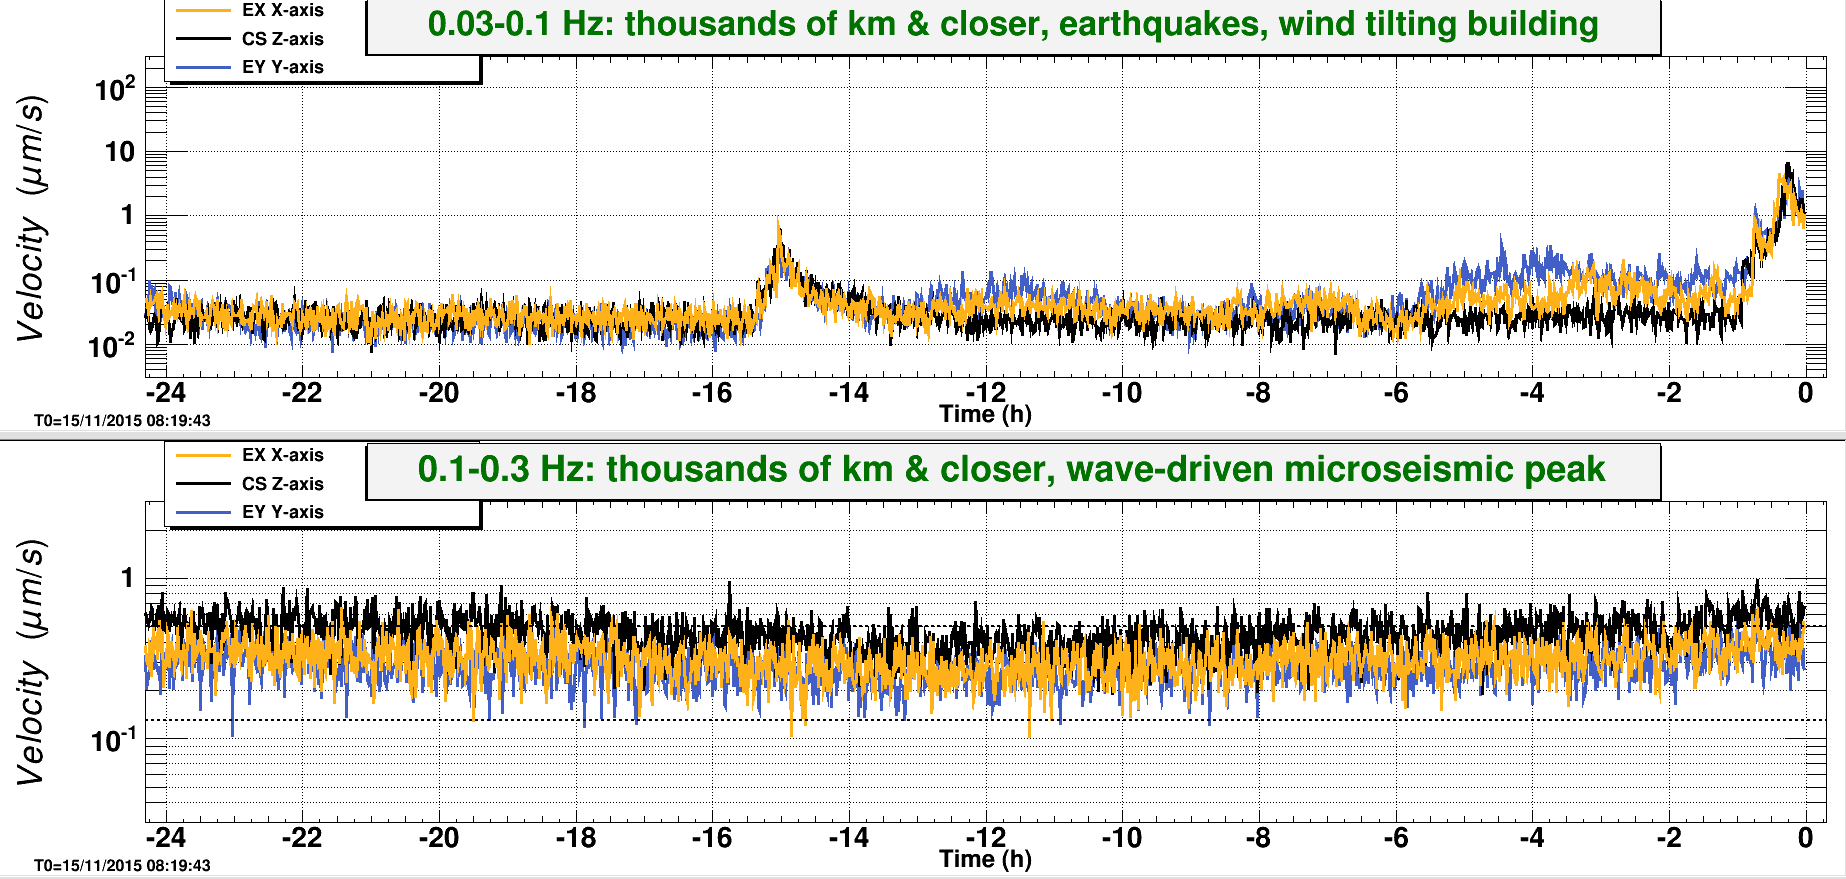
Another 5.4M earthquake from Greece coming through...... Pause the initial alignment.
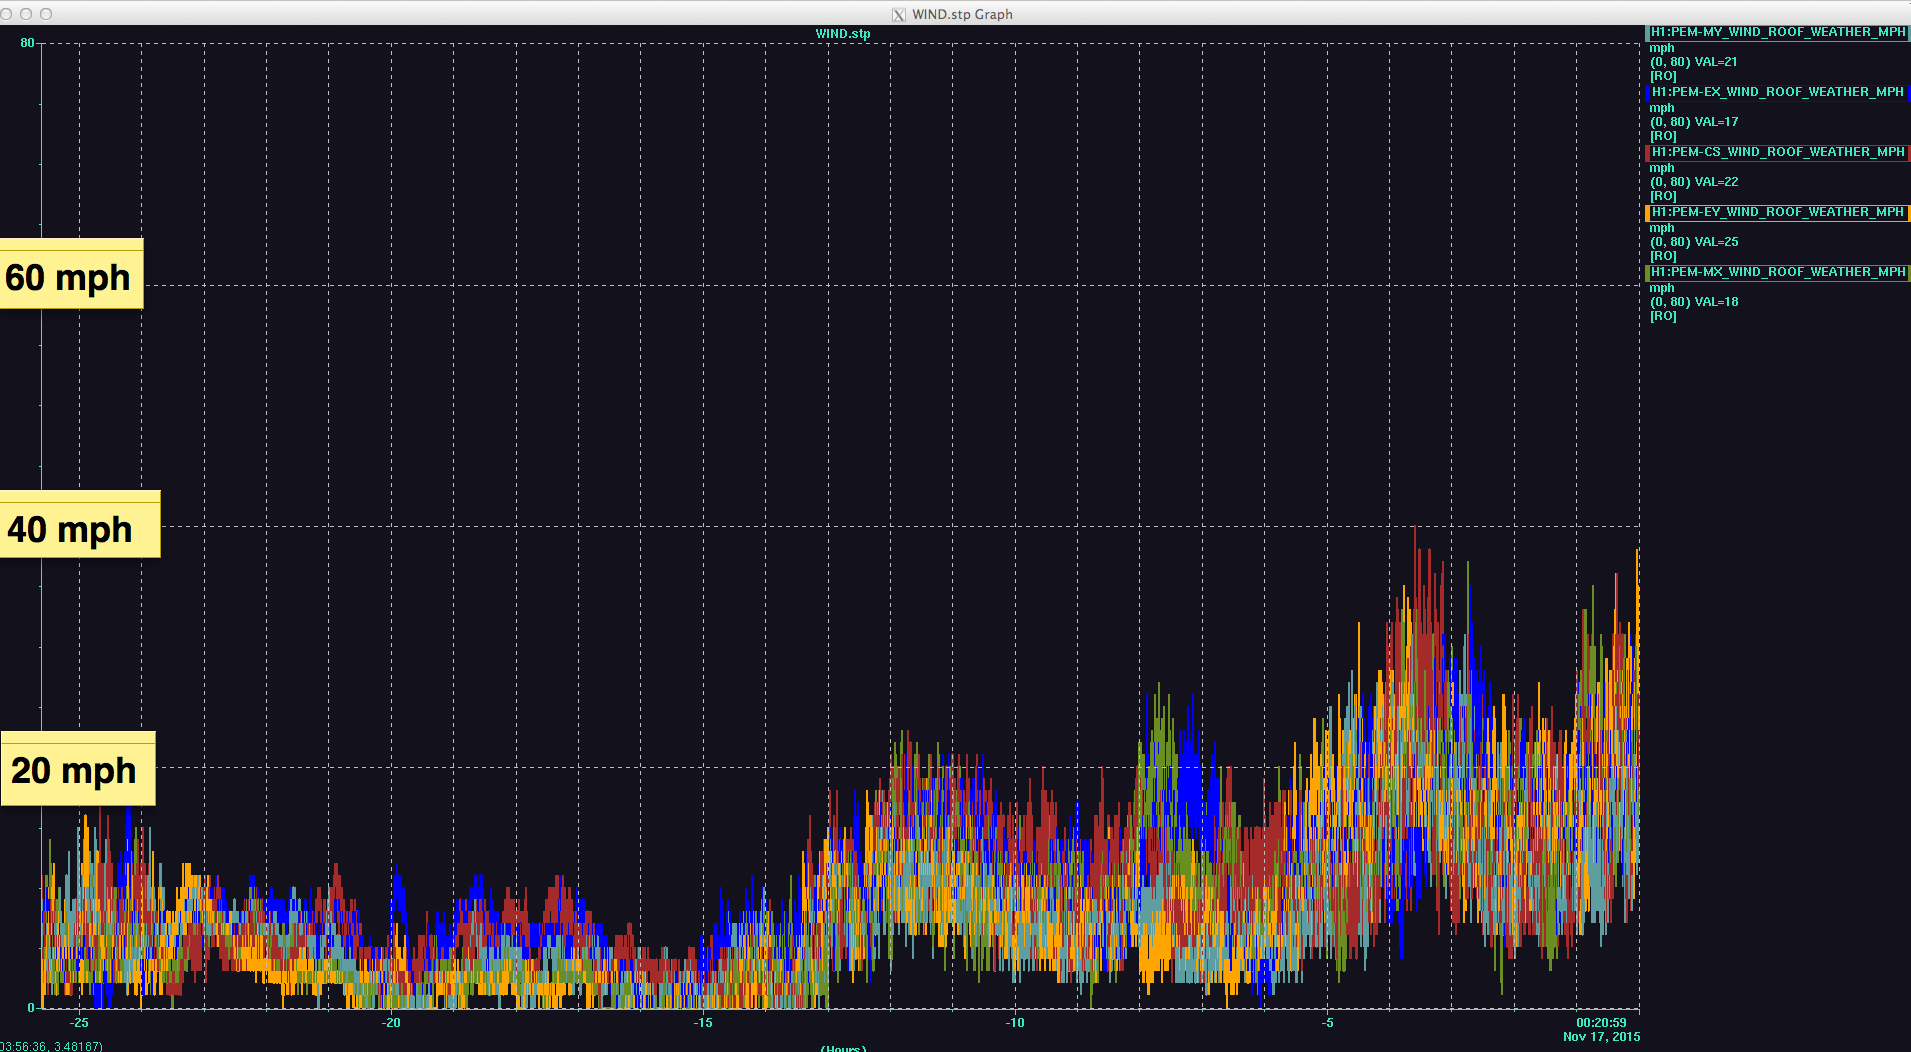
We also just had a wind gust at ~50 mph. EQ band seismic is on the rise. Relocking is going to be a while......
First try relocking. Lockloss at REDUCE_CARM_OFFSET (11:02:17 UTC). Wind speed ~30 mph.
Wind reaching 40 mph. Locking seems hopeless right now. Just lost lock again at CARM_ON_TR (11:08:2 UTC). Put ISC_LOCK to DOWN.
I noticed SRC_CAGE_SERVO user message tells me to "Align SR3 to offload M2 actuators". I'm not what action to take but I've attached the cage servo output below. I also noticed OMC shutter was opened while locking DRMI couple of times. Could that have intefered with DRMI locking? I don't remember the shutter being opened that early.
Tidal still high. Relocking still unsuccesful.
Wind speed decreased to ~20mph. So I tried again. Lockloss while locking PRMI. Looks like ETMX ran away.
Wind speed is back to ~30 mph.
The forecast lied to me saying the wind speed would decrease towards the morning. The wind has been 30-40 mph since 10 hours ago with no sign of decreasing. LLO has been down also because of wind. I'm calling it a night (or morning?).