Josh, Andy
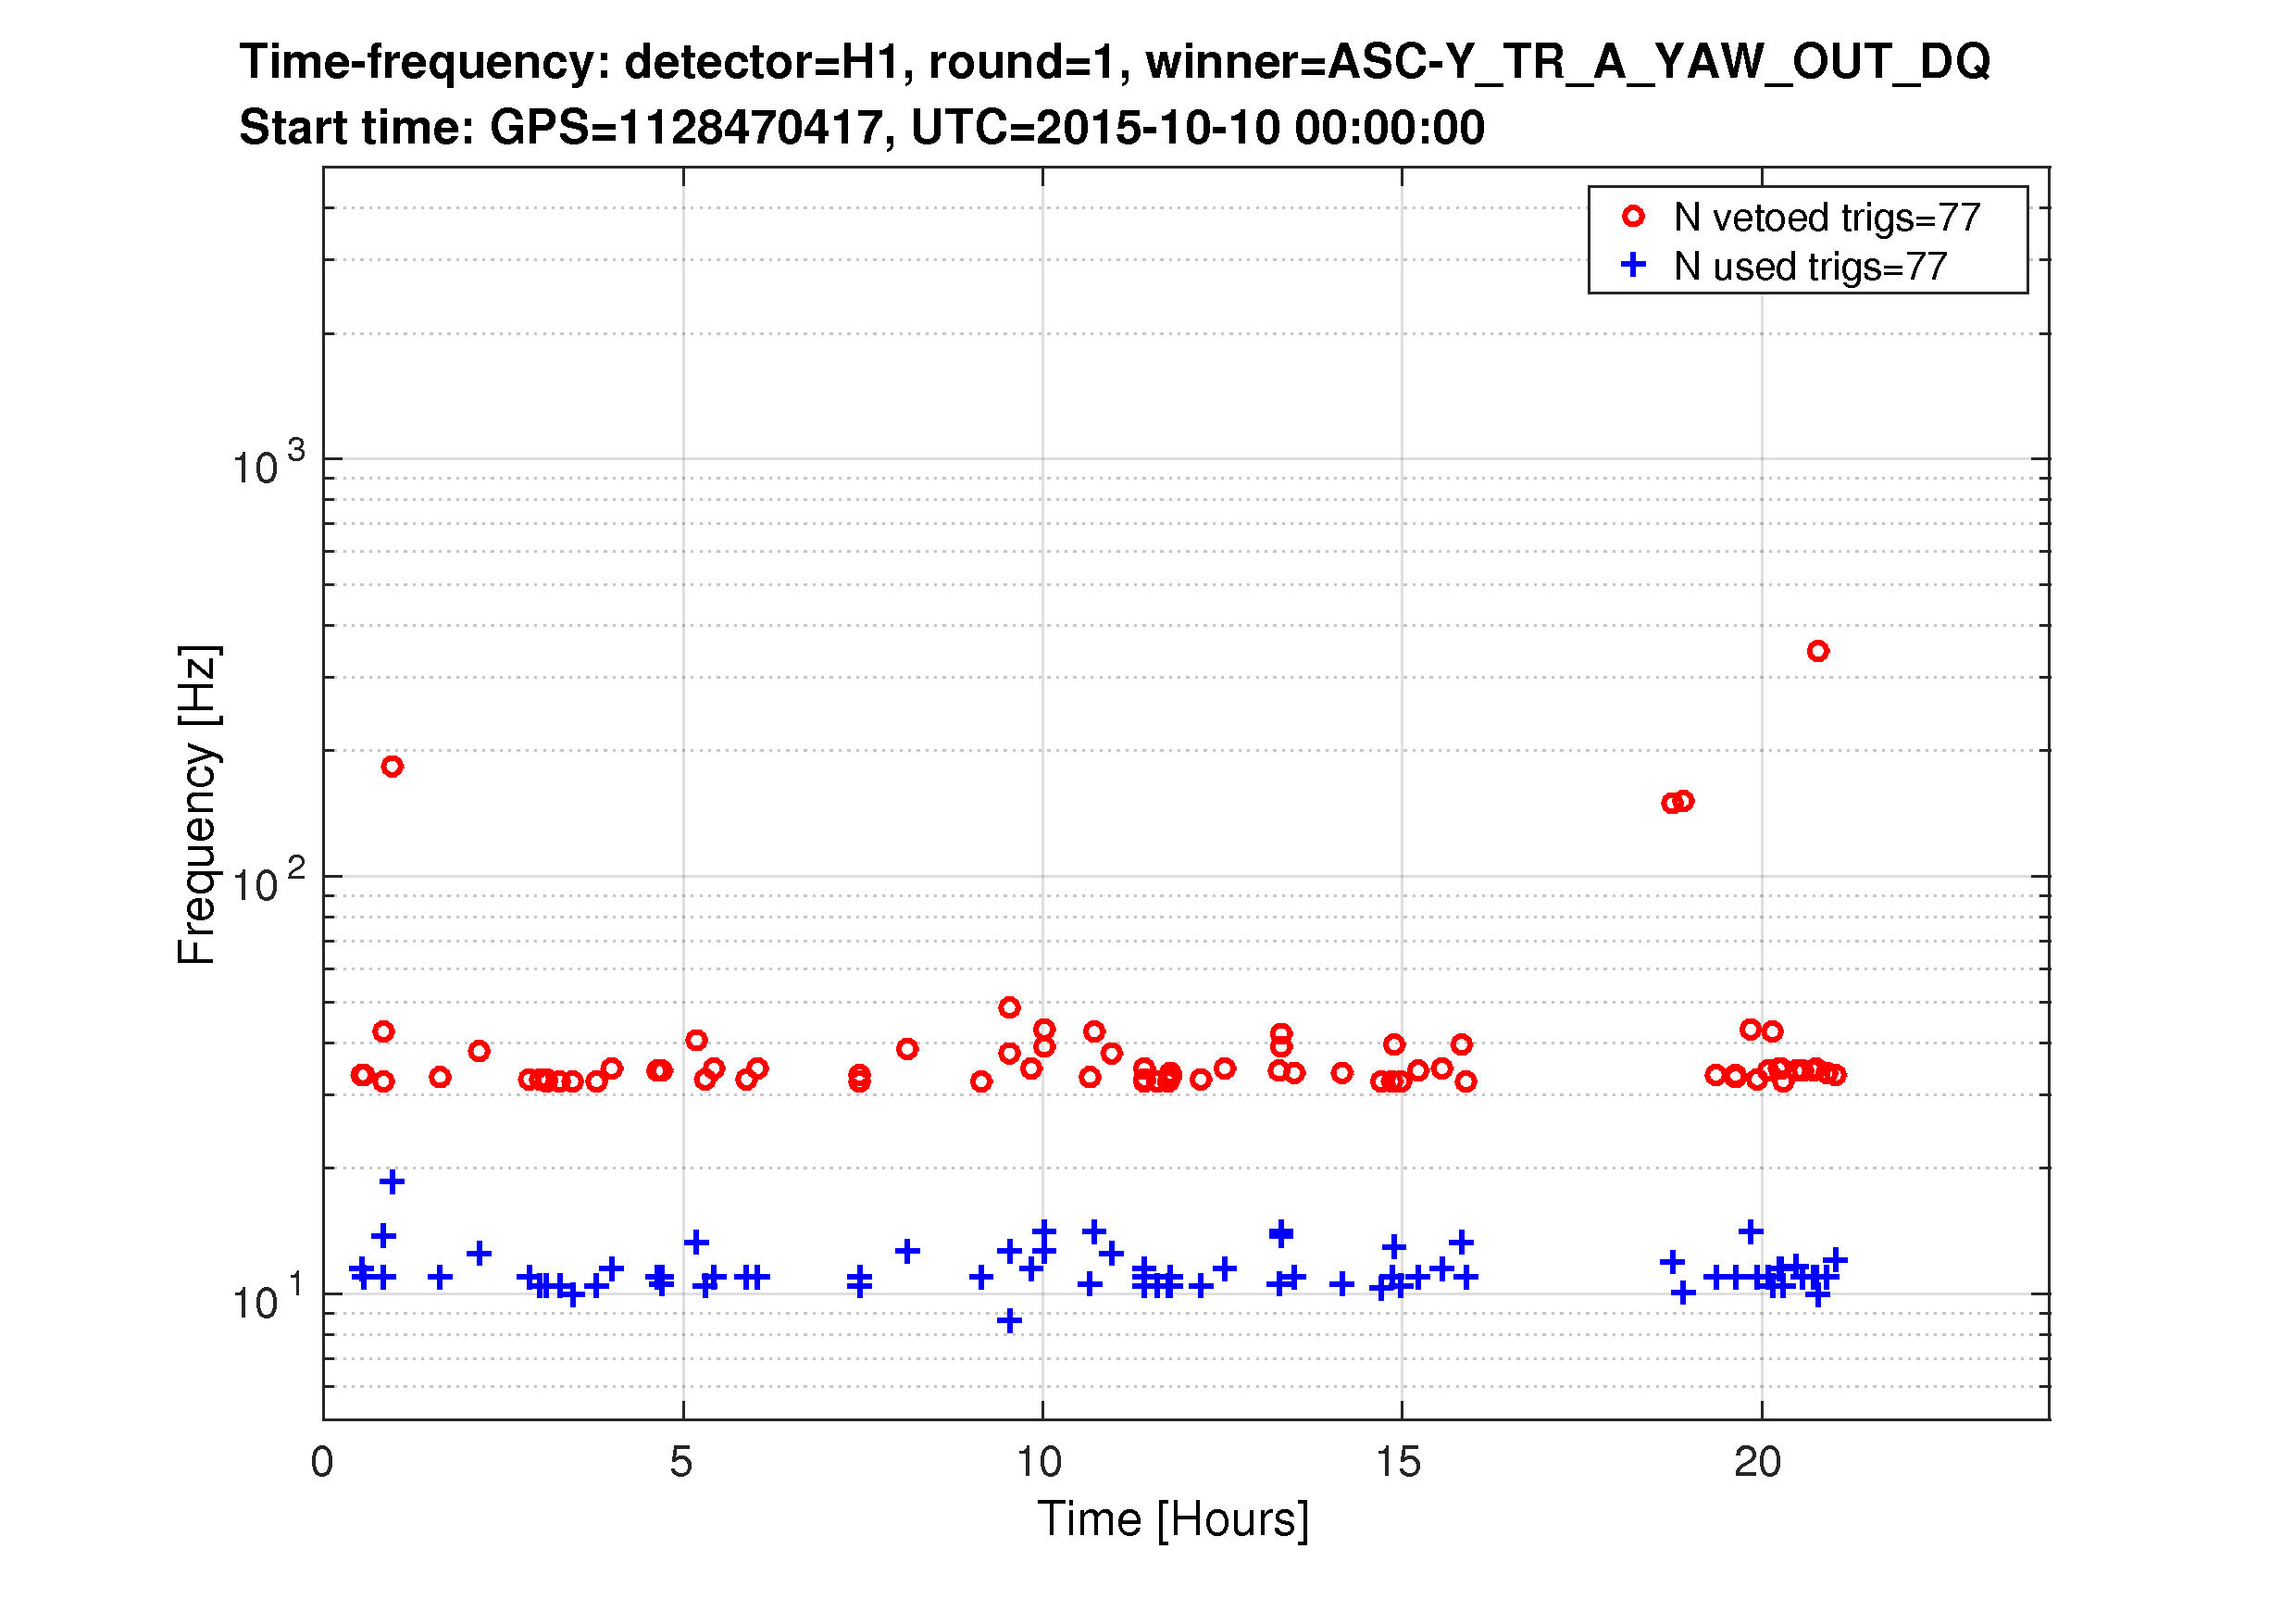
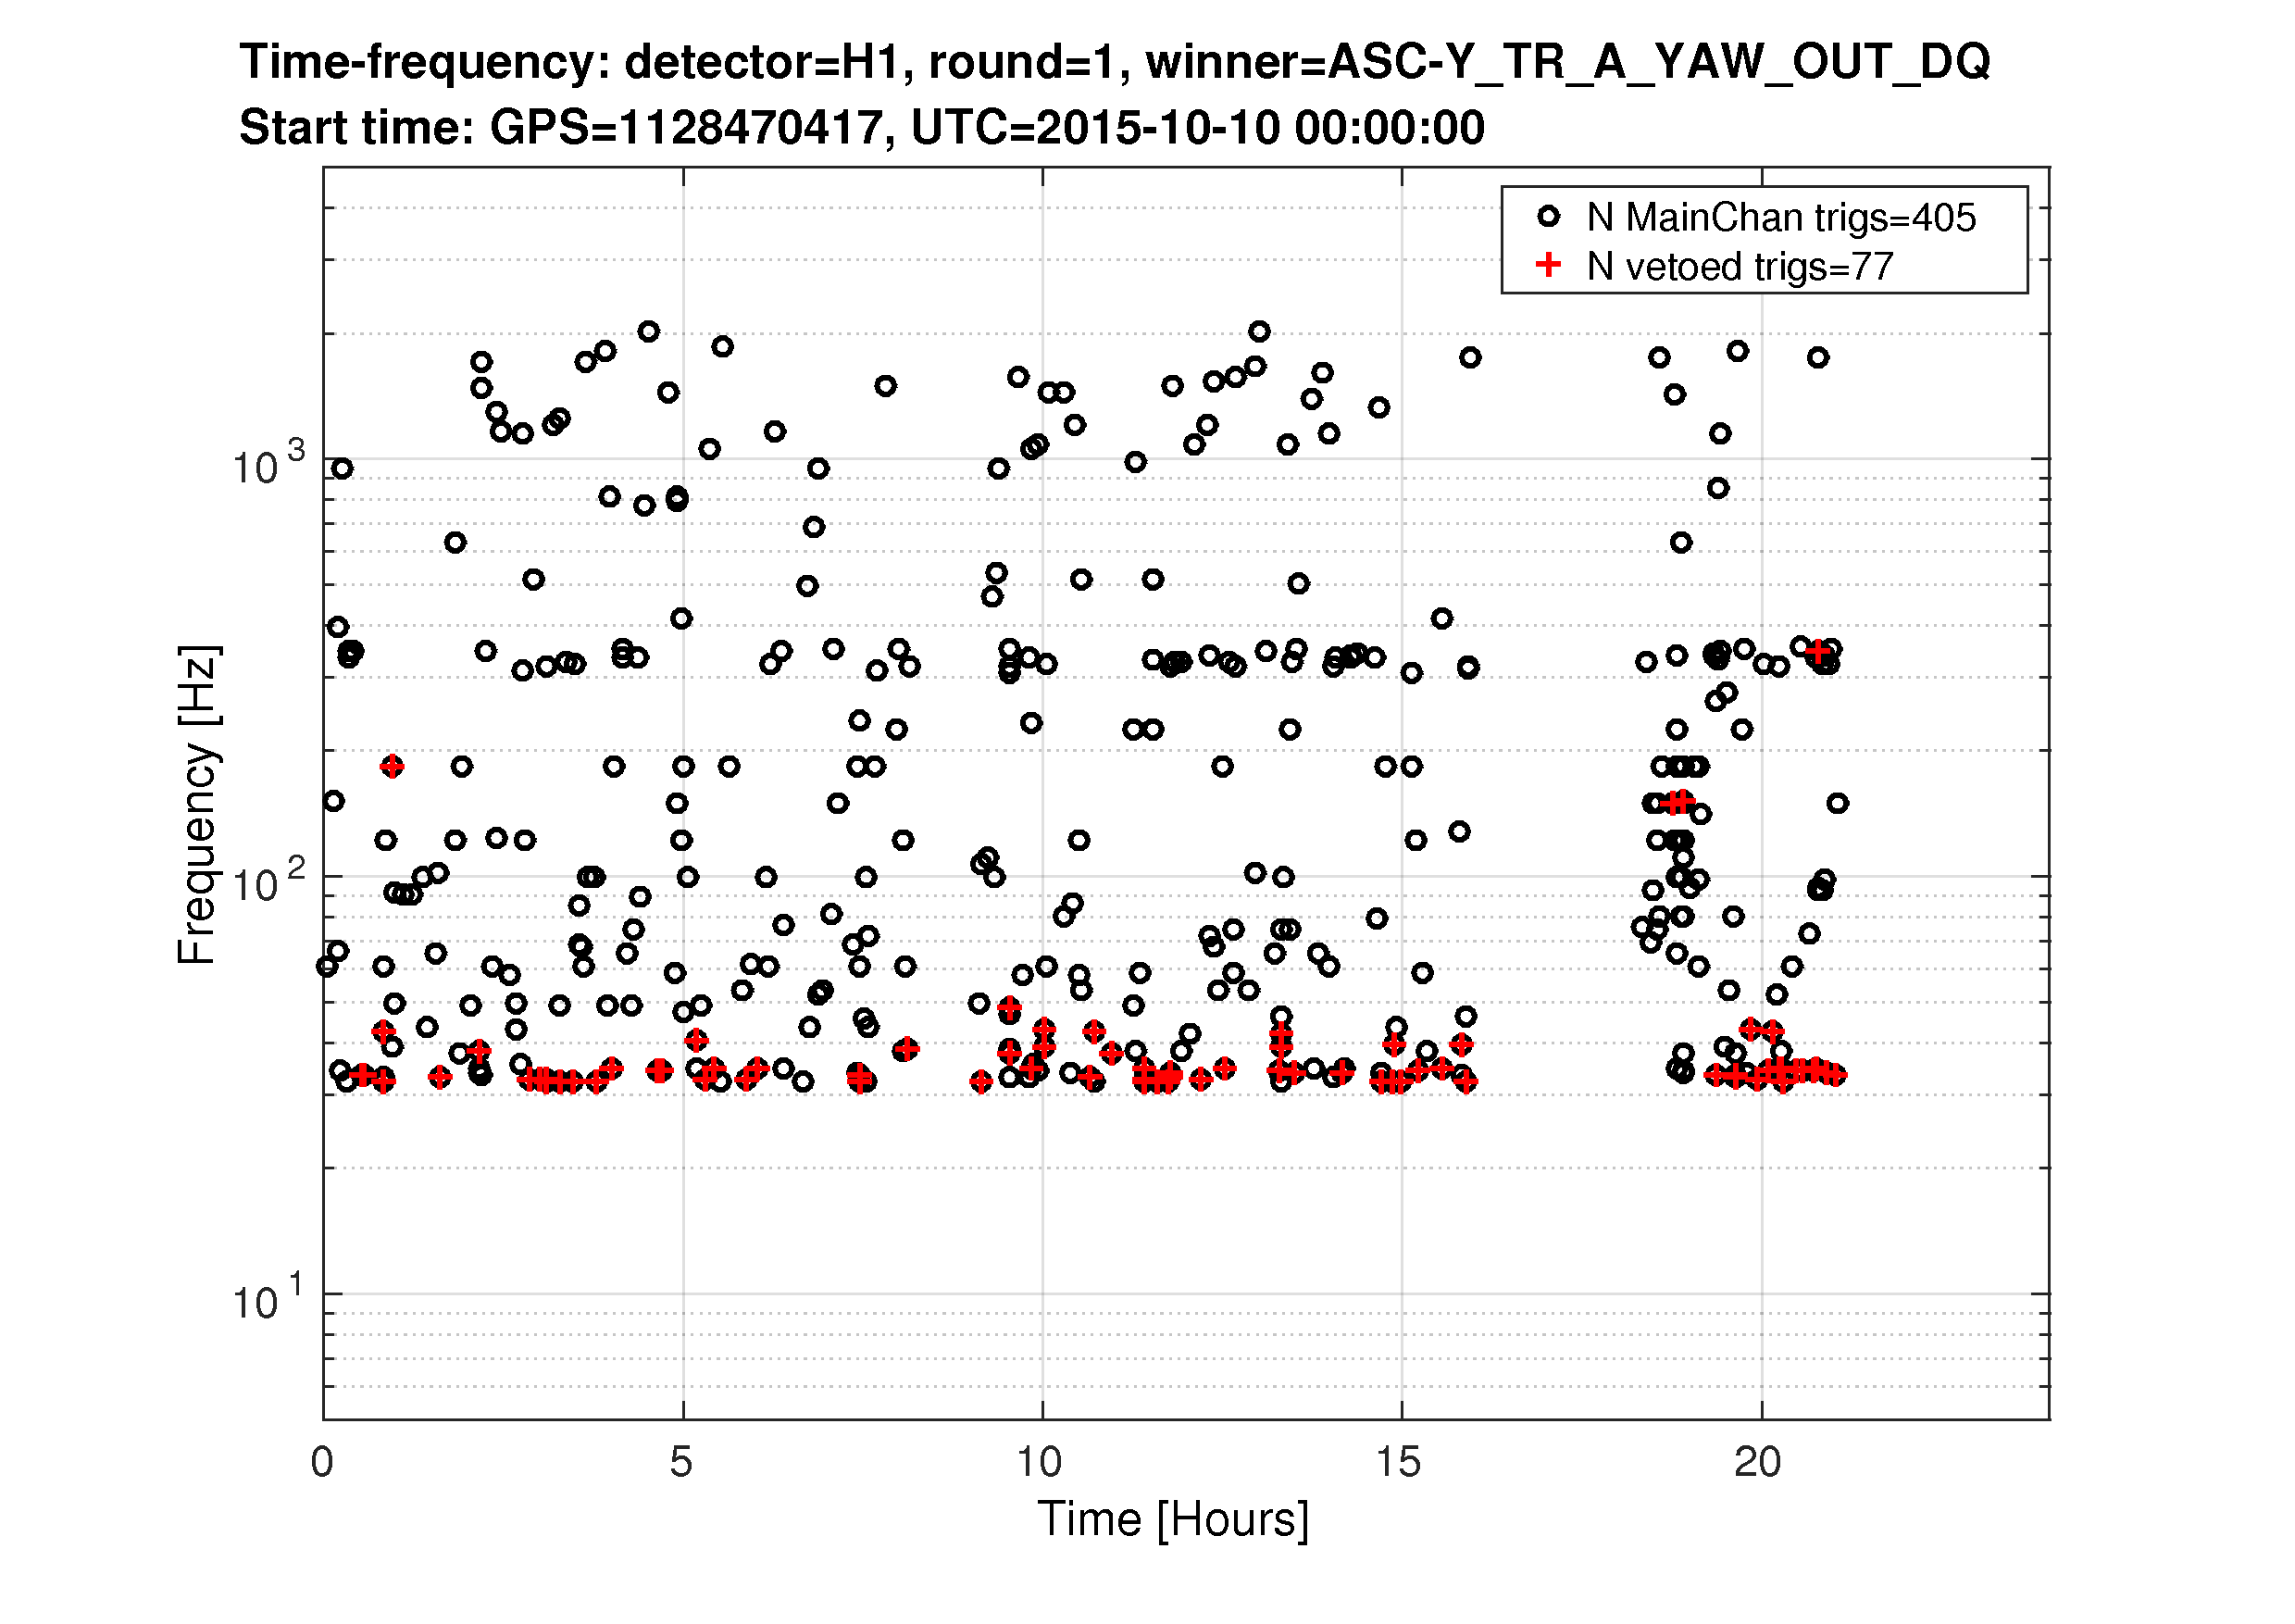
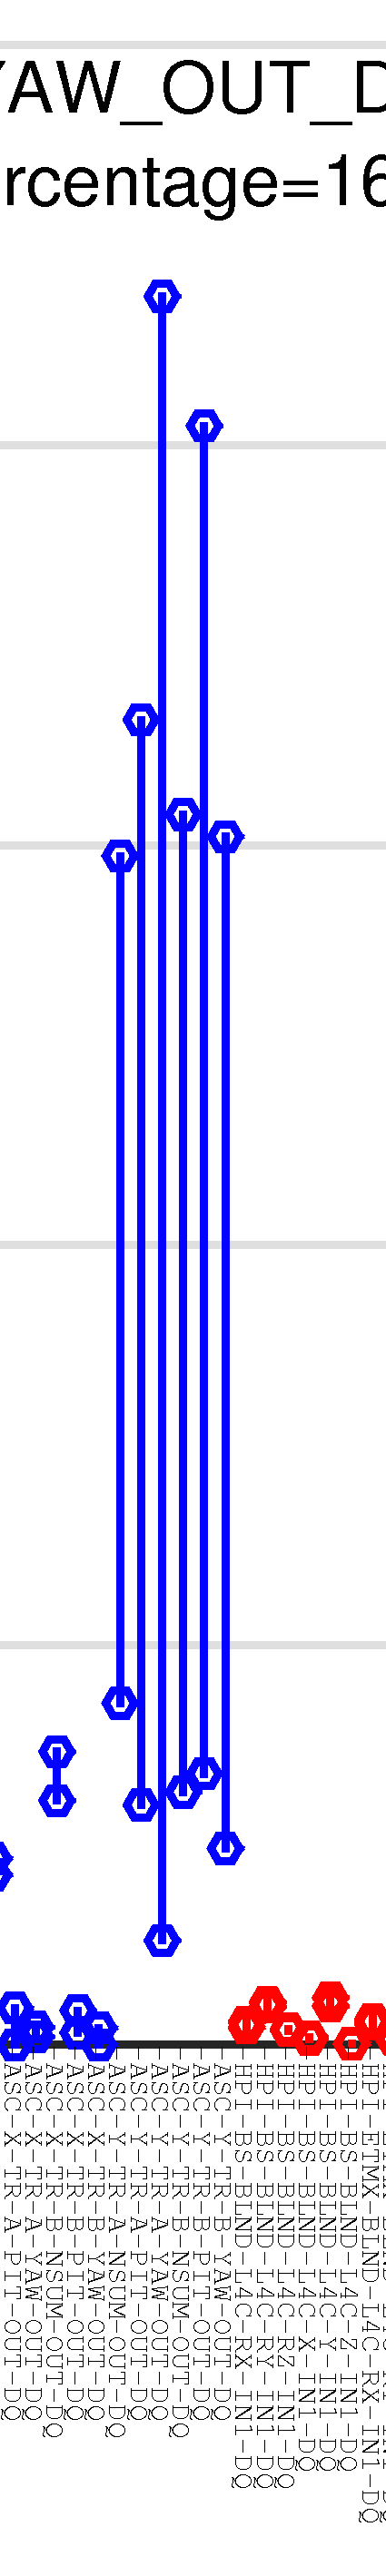
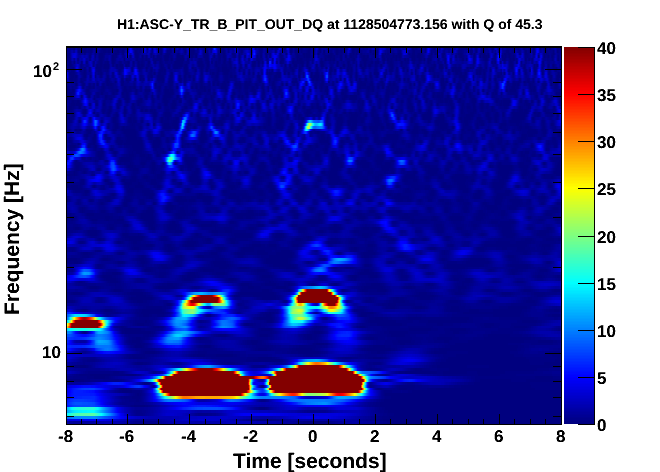
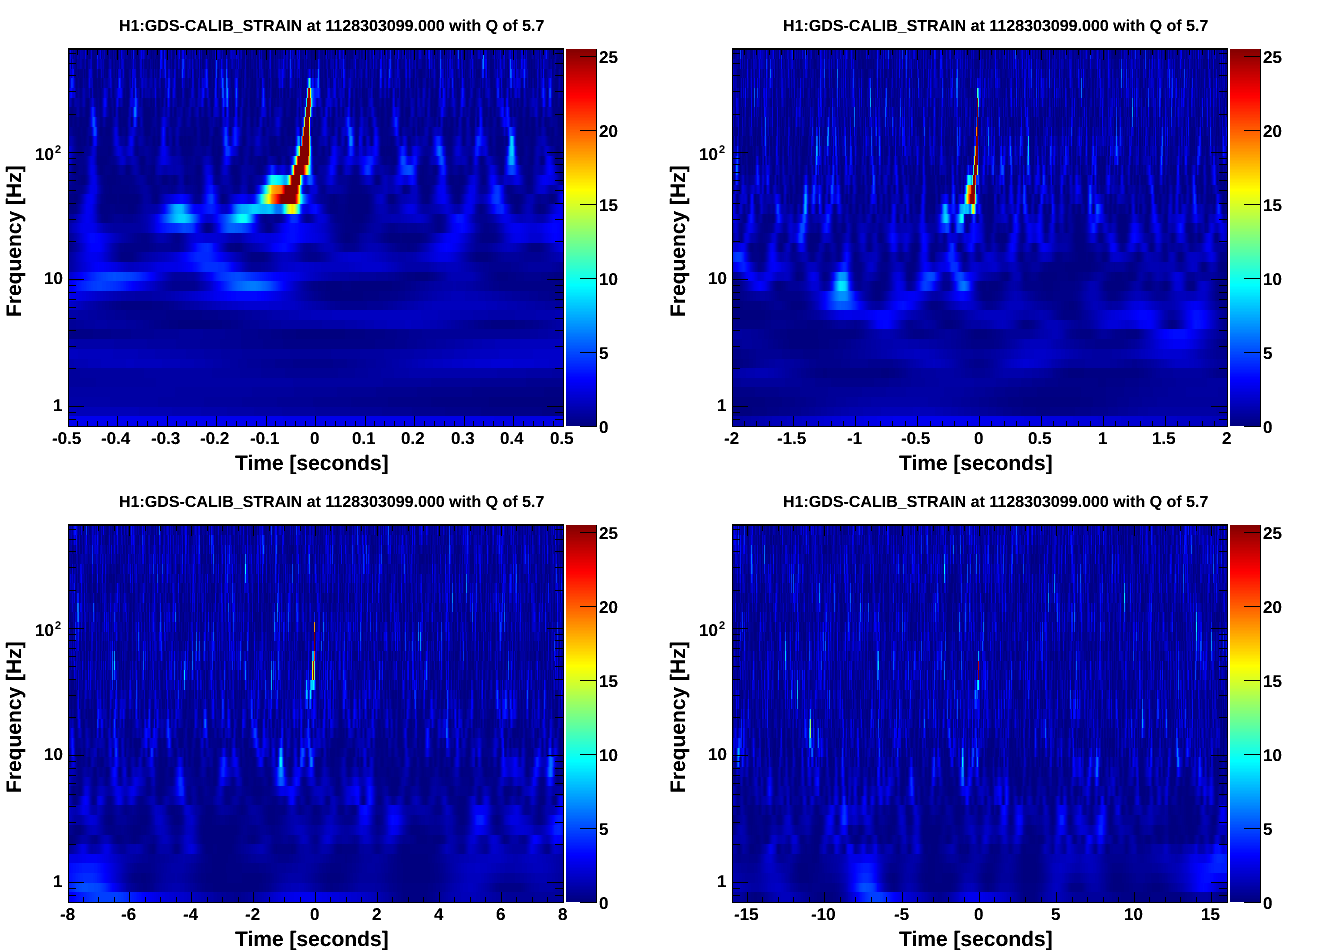
Yesterday's hveto page found a very constant rate of 30-40Hz glitches in DARM were vetoed by a population of 10-15Hz glitches in the End-Y QPDs (ASC-Y_TR_{A,B}_{NSUM,YAW,PIT}_OUT_DQ). Fig1 shows the time/freq of the DARM triggers and the ASC-Y triggers that vetoed them, Fig 2 shows the time/freq of all DARM triggers and the ones that got vetoed, and Fig 3 shows how the ranking statistic found all ASC-Y channels to be correlated. A .txt file with the times of vetoed DARM triggers is attached in case folks want to look at other channels around those times.
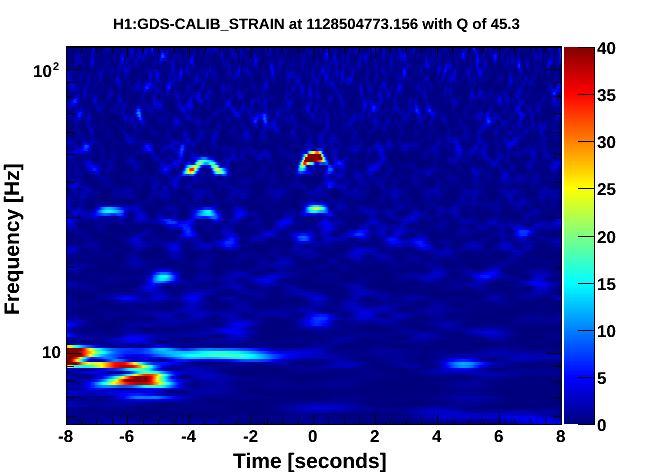
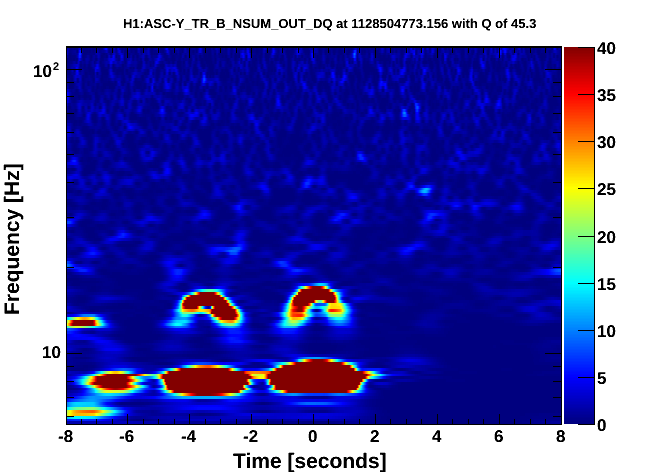
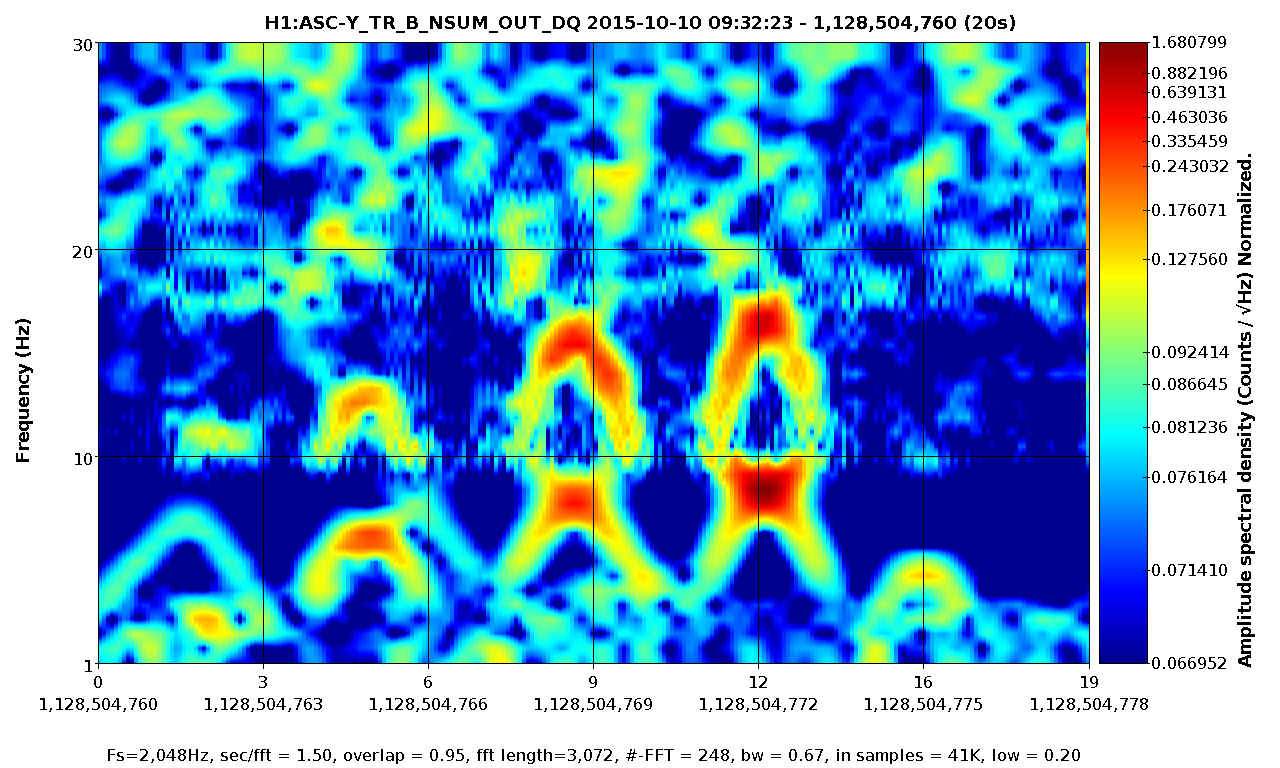
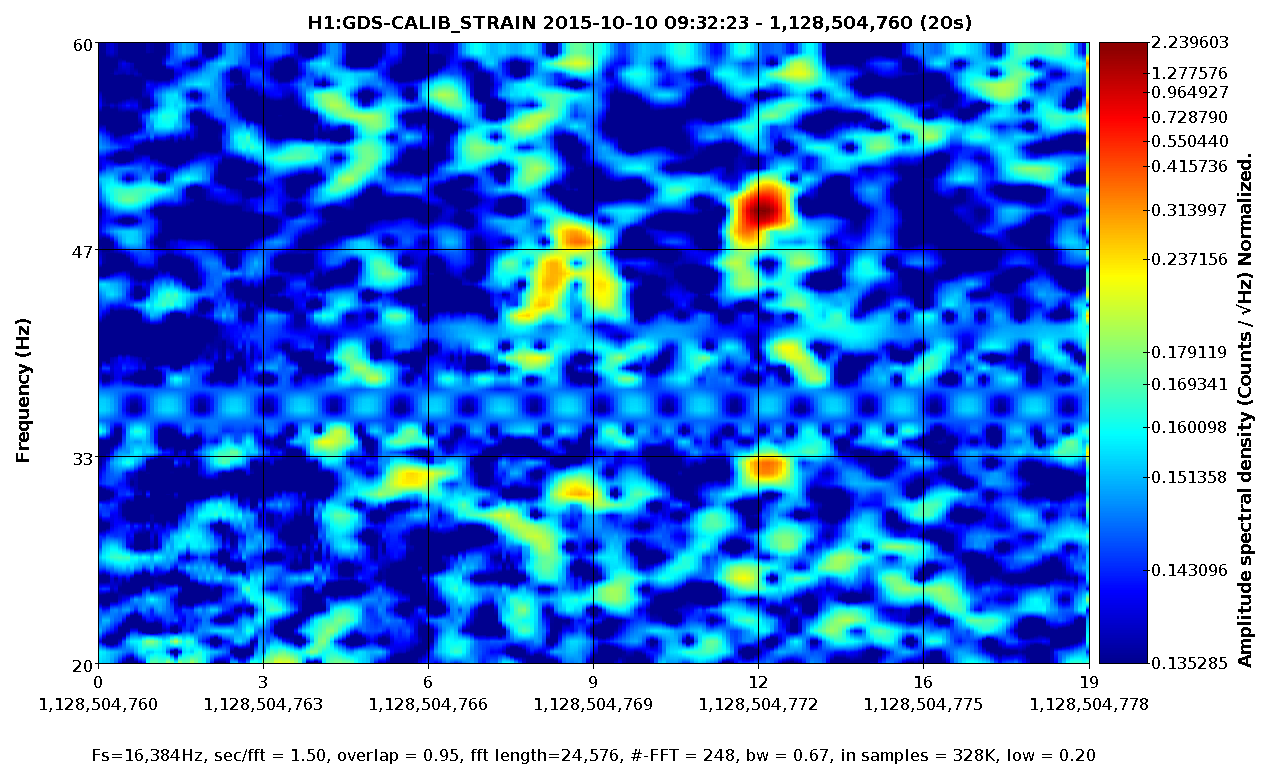
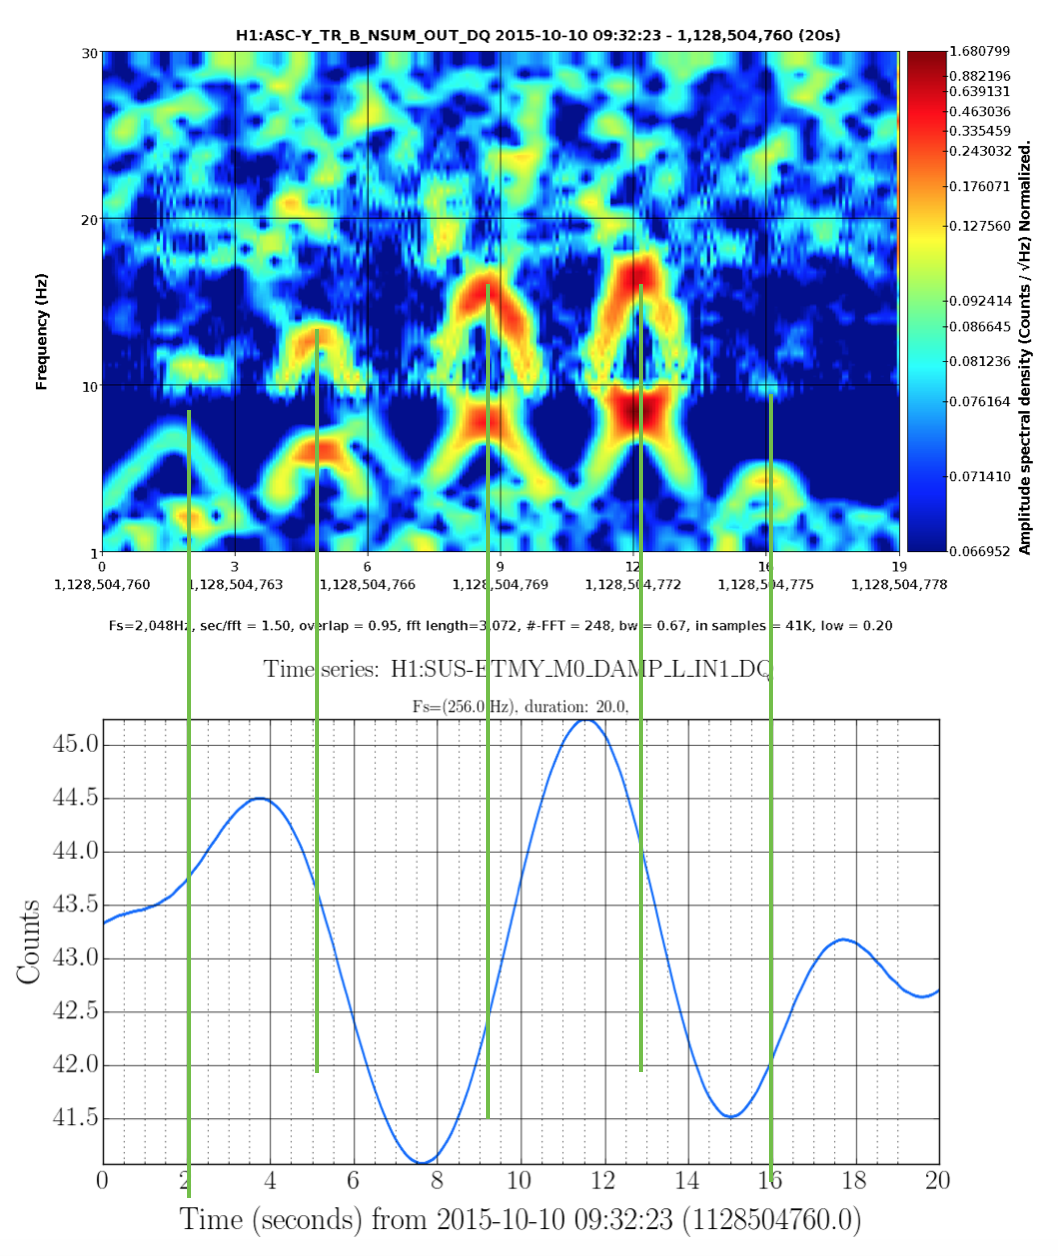
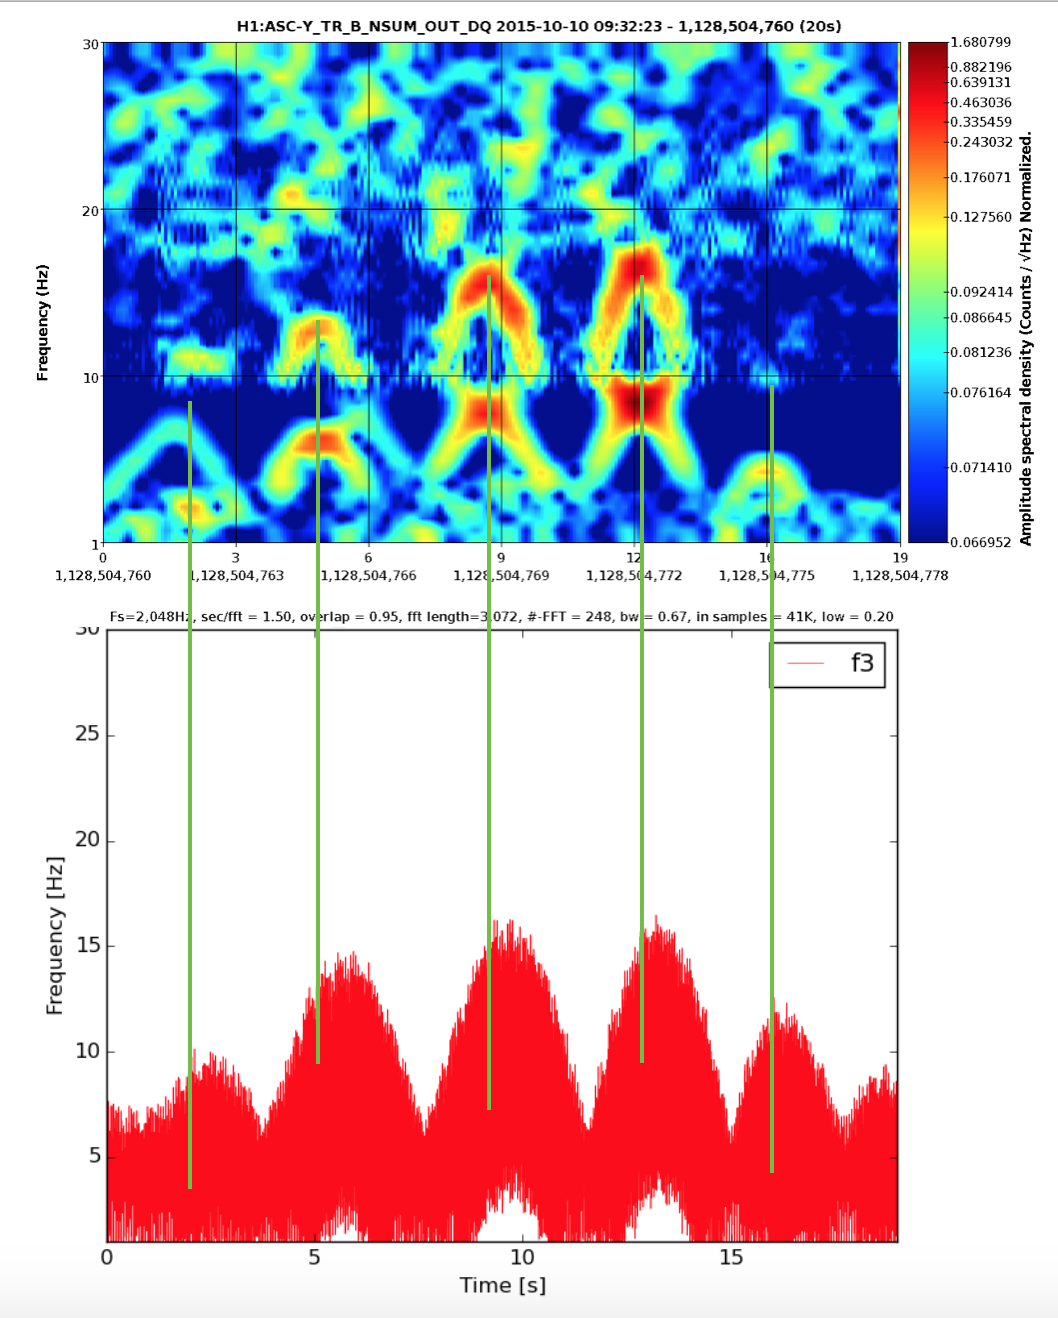
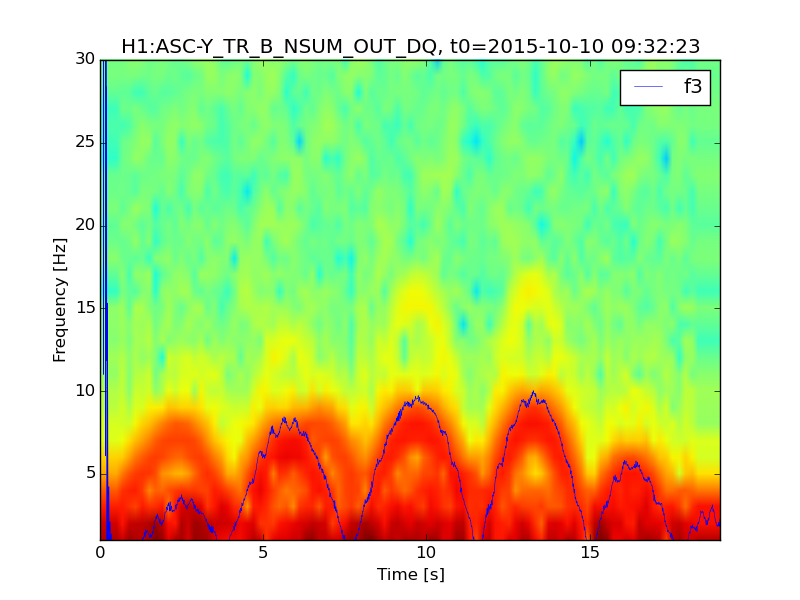
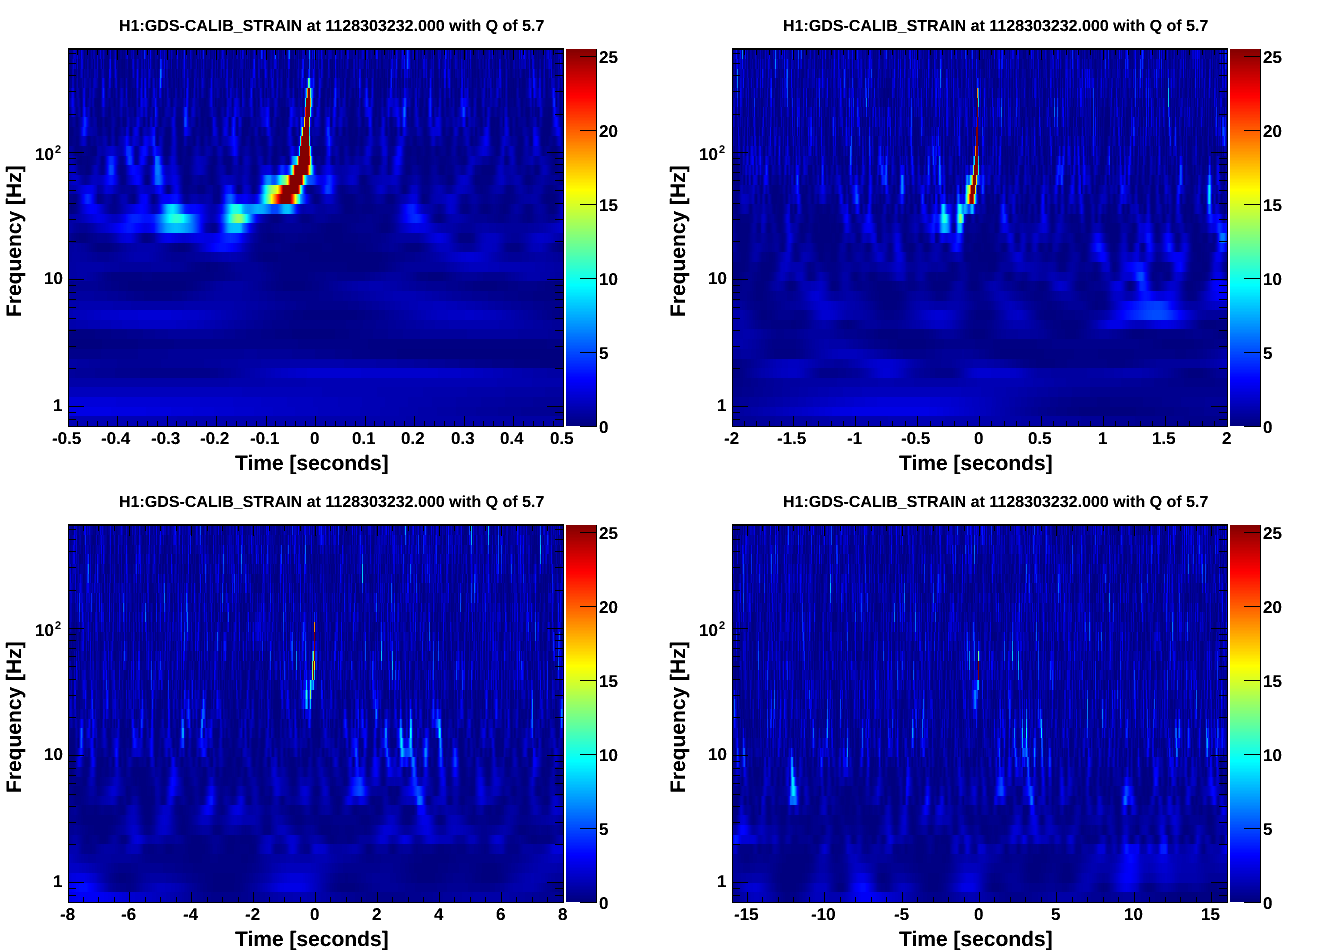
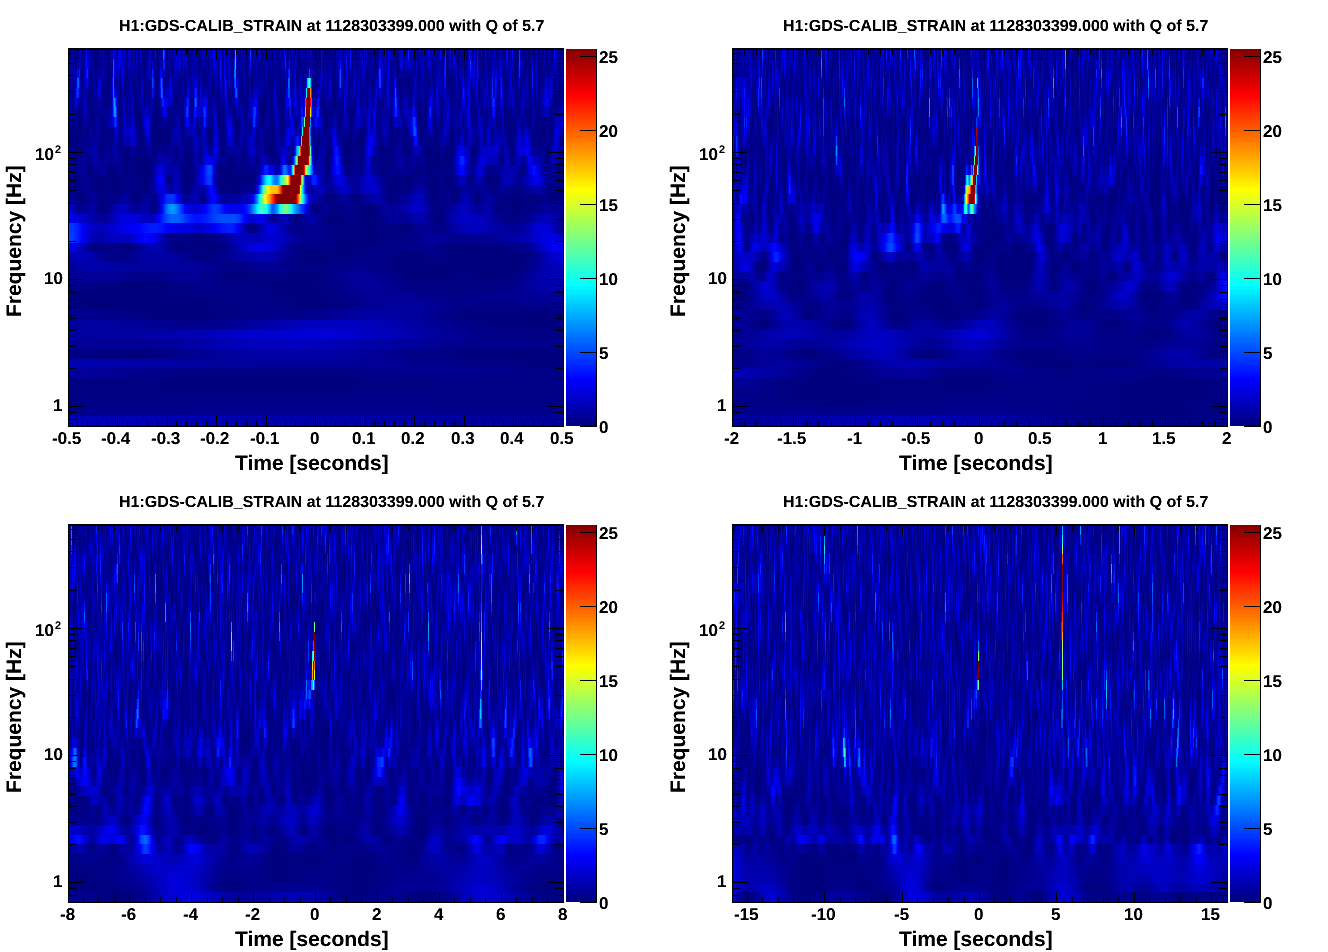
Fig 4 shows DARM, figs 5,6 show ASC-Y channels, figs 7,8 show zoomed specgrams to see the frequency. What we see are strong scattering arches around 8 and 16 Hz in all of the End-Y QPD channels, at the same time as similarly shaped fringes in DARM around 48Hz. I think DARM (more sensitive to scatter, potentially, at higher frequencies) is seeing the 6th overtone of the 8Hz arch (multiple reflections?). The higher overtones are sometimes visible in the QPDs too.
So...what scatterer/optics is moving too much? We know [1] that f_fringe(t) = abs(2 v_sc(t) / lambda). Where v_sc(t) is the time derivative of the position of the scatterer x_sc(t). The time between peaks is about 3.5 seconds, but that is half the period because of the abs() so it's a ~7 second period or 0.14Hz motion of the scatterer.
Note: We checked and the beam diverter is closed (H1:SYS-MOTION_Y_BDIV_A_POSITION = 1).
Note 2: Today's hveto page hasn't finished yet, but no reason to believe this isn't happening still.
[1] Accadia, T., et al. "Noise from scattered light in Virgo's second science run data." Classical and Quantum Gravity 27.19 (2010): 194011.


For future reference the wind had not gusted above 15 mph for about an hour or so before Travis and I changed the blends, and the microseism is at about 0.5 um/sec in the 100-300mHZ BLRMS now. Before we changed the blends, ITMX optical lever saw about 0.5 urad peak to peak motion, and single arms were not even locking. (ETMX was not moving as much as the ITM) Changing the blends reduced the motion to more like 0.1 urad or even less.
Here are SDF shots so operators know what to bring it back to.
Unfortunately you won't be able to use the SDF system to revert these filters. If you do that you will likely trip the ISI, violently, and it will take longer to recover. You will have open the ST1 BLENDS screen for each ISI and select the appropriate blend from there.