J. Kissel
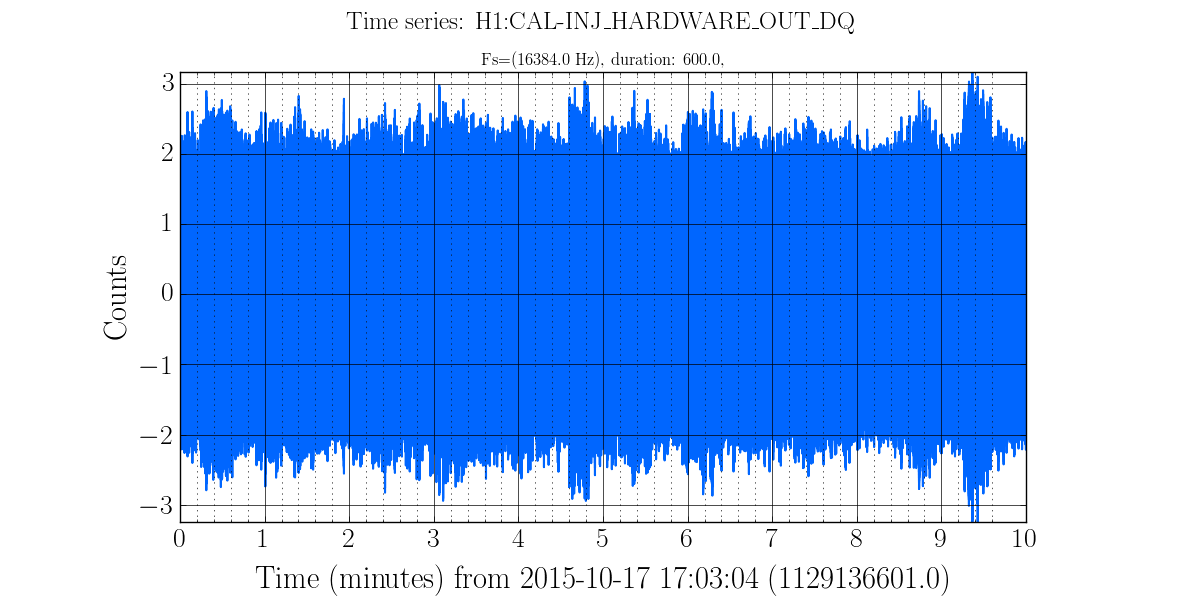
Inspired by several people looking at time-series and RMS of DARM that includes sub-10 [Hz] content (e.g. LHO aLOG 22513), I update my information on how well I think we can get the low frequency DARM displacement "right" below 10 [Hz] in the frequency domain by modifying H1:CAL-DELTAL_EXTERNAL_DQ in post-processing (originally posted in LHO aLOG 18248).
The method for calibrating the CAL-DELTAL_EXTERNAL_DQ DARM channel and getting it "right" below 10 [Hz]:
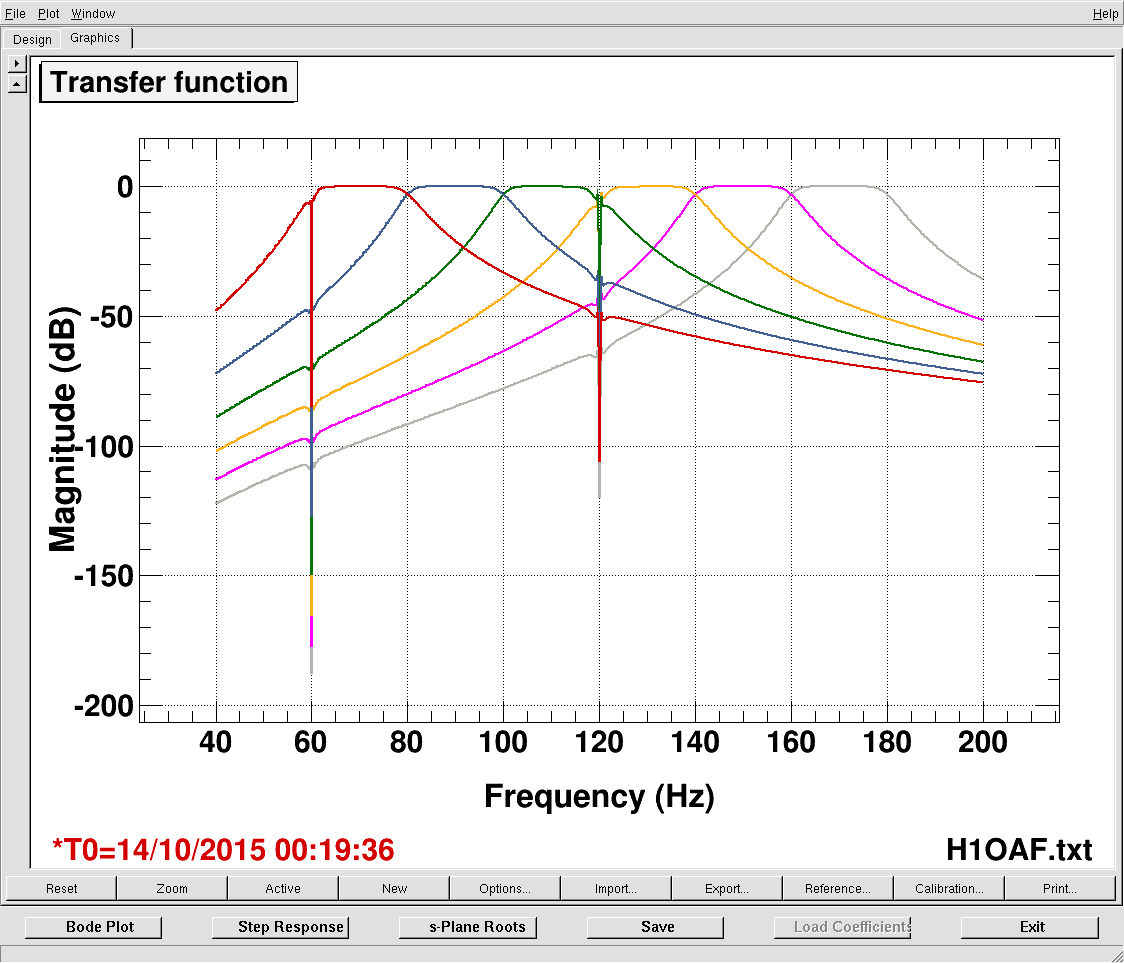
(1) undo the 5 zeros at 1 [Hz], 5 poles at 100 [Hz] whitening DAQ filter LHO aLOG 16702 as one would normally do for this channel at all frequencies.
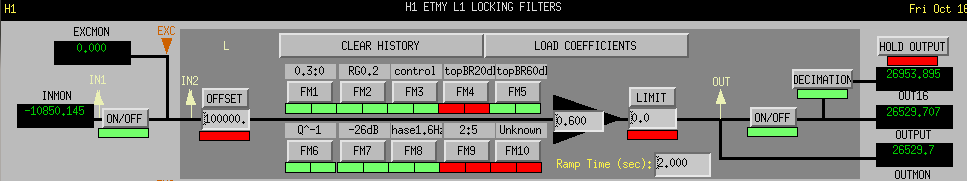
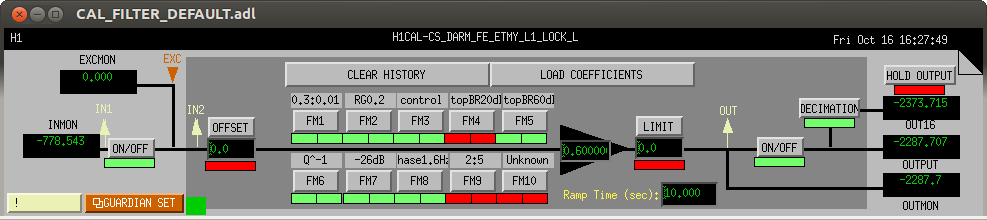
(2) compensate for the systematic error in CAL-CS from the rest of the low-frequency digital UIM/L1 LOCK L filter (FM1 "0.01:0", a pole at 0 [Hz], and a zero at 0.01 [Hz]) that we don't replicate in the CAL-CS actuation path because of numerical precision noise. (Originally discussed in LHO aLOG 17528)
That means, in DTT, one should apply the following calibration filter:
Gain: 0.01
Poles: 1,1,1,1,1, 0
Zeros: 100,100,100,100,100, 0.01
where the gain of (exactly) 0.01 is to normalize the z:p = (0.01 : 0) filter necessary for getting the actuation at low frequencies correct in step (2) -- i.e.
2*pi*[0.01] / 2*pi = 0.01. (Don't ask me why one needs to normalize the z:p = 0.01:0 filter but not the 100^5:1^5 filter, cause I don't know.)
Details and Explanations and Caveats:
------------------------------------
All calibration below 10 [Hz] still should be treated with some skepticism, because
- we have little-to-no precision measurements of the scale factor, DARM OLGTF frequency dependence, and/or TST/UIM cross-over frequency in this band (and we don't plan on making any).
- the online CAL-CS calibration does not compensate for any very low-frequency global control, a.k.a. "tidal correction." The "calibrations" of each end's servos that are in place claim the EPICs gains for the UGF are in [Hz] (as measured by the Green PDH), but I know these calibrations were not at all carefully done (in the "probably within a factor of 2" ballpark).
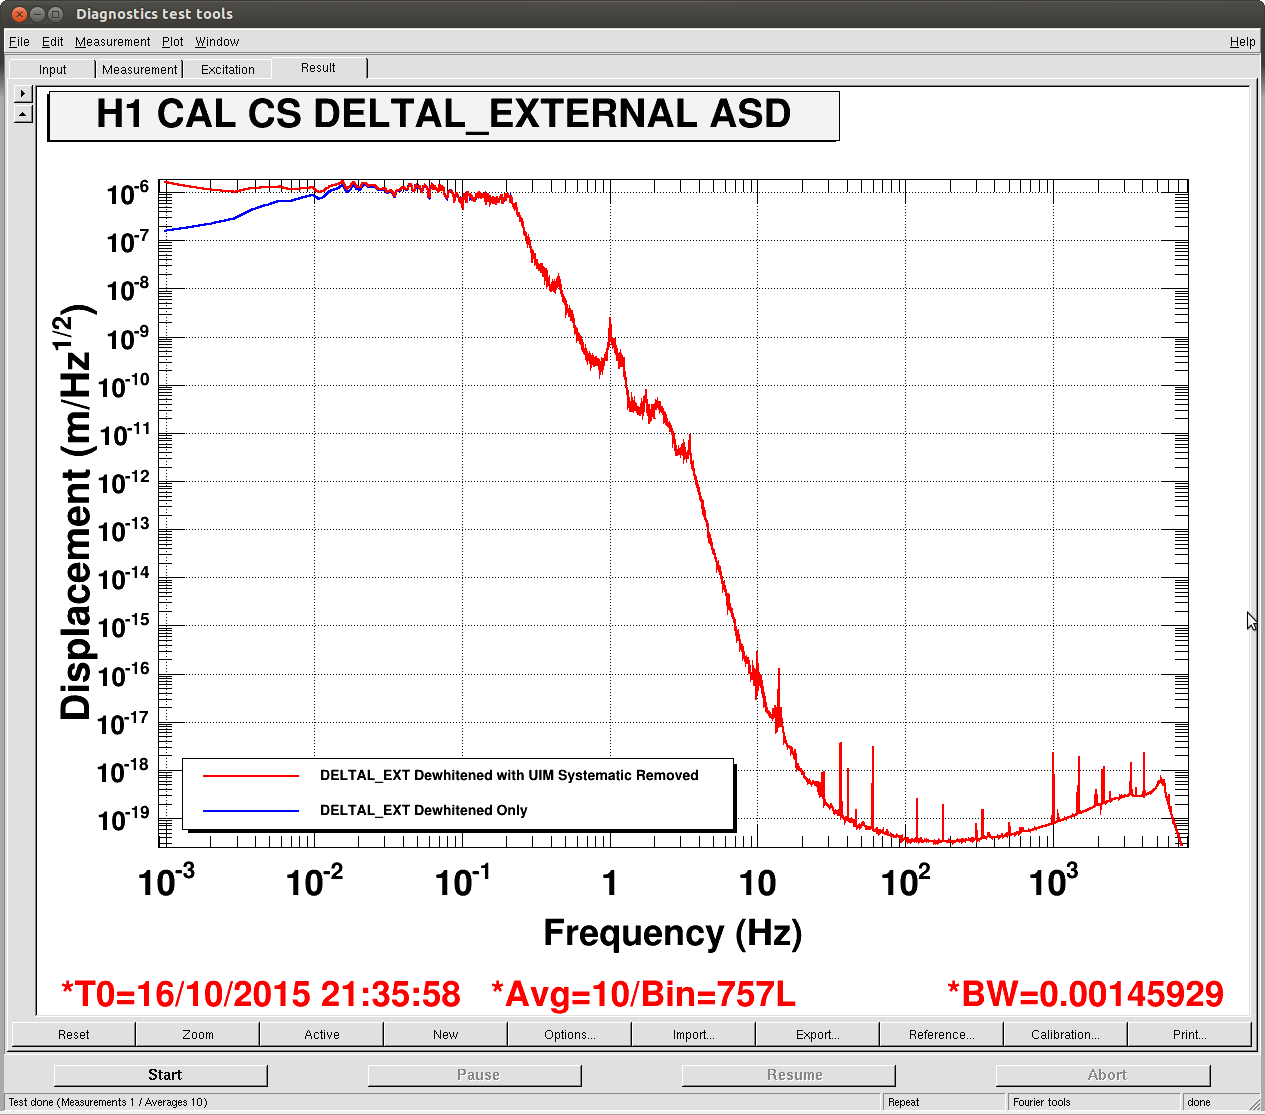
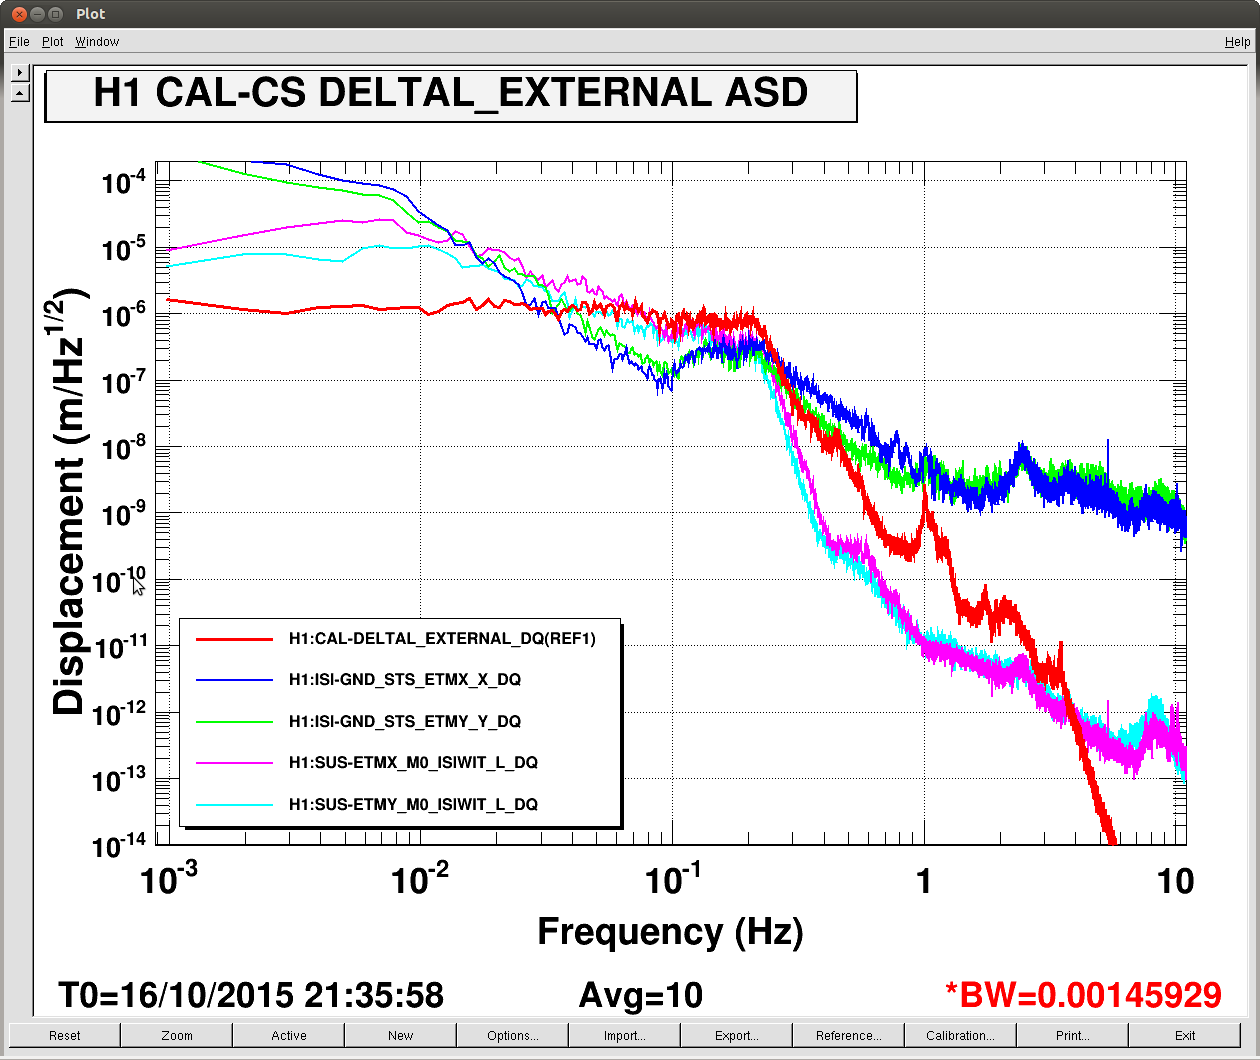
I compare against similarly "well" calibrated instrumentation in the attachment for comparison. Of course, there are lots of things going on with each of these instruments that makes this naive, "below the SUS resonances, DARM should be moving with the ground" comparison, including but not limited to
- tilt is always confusing the issue below ~0.1 [Hz] for the interial sensors I show,
- I don't show the ITMs,
- there are many more mechanical DOFs of many more SUS than just the ETMs contributing to DARM at "mid" frequencies (between 0.1 and 5 [Hz]).
- gain peaking and sensor noise pollution from from all of the mid-frequency ASC loops.
- Angle to length coupling
- The GS13s that inform the ISIWIT channels are in-loop, and limited by sensor noise above ~0.5 [Hz]
- gain peaking from HEPI and ISI loops
- relative motion between the HAMs and BSCs on the readout chain of DARM
which makes the comparison difficult to say who's "right" with out a LOT more measurements and cross-checks.
In summary, I could say it's "within a factor of two," because I think we've done everything right, and that's what we always say when we first guess at how well we've done with these sorts of "worked on it carefully for a day, but no one else has looked at it, and it's the first time trying," things, but I have no measured proof to bound the uncertainty quantitatively.
--------------
Note because we've needed to do a better job at low-frequency to get the 10 [Hz] motion right, the additional corrections one must make to CAL-CS are at lower frequency than they used to be in ER7.
Also note, this should be the same correction for H1:GDS-CALIB_STRAIN, because former is produced by the latter, and there are no known additional corrections / systematics that aren't already covered by the front-end's production of H1:CAL-DELTAL_EXTERNAL.
--------------
Why (2) works:
Remember that DELTAL_EXTERNAL is the sum of the calibrated DARM_ERR and DARM_CTRL channels,
DELTAL_EXTERNAL = (1 / C) * DARM_ERR + A * DARM_CTRL
where C is the sensing function (i.e. the IFO's "test mass DARM displacement sensor" calibration) and A is the actuation function (i.e. the ETMY transfer function). A dominates this sum below the DARM UGF at ~40 [Hz]. As such, well below 40 [Hz],
DELTAL_EXTERNAL ~ A * DARM_CTRL.
Since we're using hierarchical feed back to ETMY, where the UIM/TST or L1/L3 cross-over frequency is ~1 [Hz], then well below *that*,
DELTAL_EXTERNAL ~ A_{uim} * DARM_CTRL,
i.e. the total calibration for DELTAL_EXTERNAL "well" below 1 [Hz] is dominated by how accurately we reproduce / calibrate / model the UIM actuation path. Since the UIM digital filters we've intentionally left out in CAL-CS have frequency content below ~0.01 [Hz], they're simply "missing" from the calibration of DELTAL_EXTERNAL, and we can, offline, just multiply all of DARM by these filters, and get the "right" answer.
---------------