(All time in UTC)
23:00 The interferometer is down. Take over from Ed.
23:51 Dick to optics lab
23:56 IMC had trouble locking. MC2 pitch seems to have moved the most from the time the ifo was still locking so I touched it and managed to get IMC locking again. Ed had to touch ITMY to get the green to lock, fearing that this might give me trouble during DRMI afterward I reverted his changes and tried adjusting ETMY and gave TMSY a small touch.
00:36 Wind reached 40 mph. I adjusted PR3 to maximize COMM beatnote. Can't really do much at this point. Waiting until the wind calm down.
01:20 Dick to LVEA.
01:38 Dick back
01:51 Robert to LVEA
01:55 Robert back
02:11 After trouble locking DRMI AND PRMI, I decided to do initial alignment. I didn't see that Patrick already did this last night.
03:24 After the inital alignment locking DRMI still seems hopeless. Locking PRMI.
03:48 PRMI also have difficulty locking. I adjusted BS, PRM, PR2. Adjusting PR2 seems to be the most effective. Maybe adjusting BS and PRM wasn't necessary...
04:20 PRMI is good but I still can't get the DRMI to lock. I've been adjusting SRM pitch and yaw but no luck. Not sure what on earth is going on. POP18 and POP90 is flashing high so I know the PRMI is good.
04:25 I noticed that SR3_CAGE_SERVO wasn't engaged. I think it HASN'T been engaged this whole time that I was having problem with DRMI. It saw SR3 misaligned at some point and never turned itself back on. SR3_CAGE_SERVO supposed to correct SR3 misalignment due to interferometer heating/cooling. Otherwise locking DRMI will be a problem. So, note to self, MAKE SURE THE CAGE_SERVO IS ON!!!
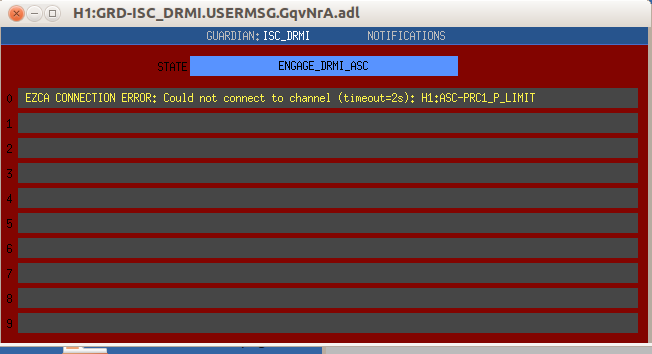
04:29 ISC_DRMI Connection Error. I called Jenne and it was an easy fix. Just request STOP, and EXEC again at ISC_DRMI. DRMI is now locking again (thank goodness).
04:47 Locked at NOMINAL_LOW_NOISE. Back to Observing. 71 Mpc (hooray!).
05:00 Kiwamu arrived doing calibration work.
07:00 Wind below 20 mph. The saturation alarm hasn't been complaining much. Handing off to Patrick.
Note:
- I checked and the SR3_CAGE_SERVO wasn't turned off until I started the initial alignment. Whatever was giving me hell with DRMI and PRMI earlier wasn't the cage servo. But to be fair I didn't touch any optics in trying to fix PRMI before I went and did the initial alignment (PRMI never had trouble locking itself in my experience!). I guess I should have...
- I have been getting calls from an unknown number all day and nobody talks when I answered. The last call was just a few minutes ago. It's really annoying....

16:26UTC - Interestingly, the range has trended back up to 71.5Mpc despite no noticeable downward trend in the microseism.