christopher.biwer@LIGO.ORG - posted 23:17, Friday 25 September 2015 (21962)
Done with hardware injection tests
I'm done with the hardware injection tests. More details in upcoming aLog entry.
I'm done with the hardware injection tests. More details in upcoming aLog entry.
04:20 UTC Taking out of observing to allow Chris to test hardware injections
L1 is down at the moment. I am beginning some single-IFO hardware injection tests at H1 now.
03:28 UTC locked on DRMI briefly, loss lock, tripped BS ISI stage 2 GS13
04:09 UTC Back to low noise
04:16 UTC Back to observing mode
03:15 UTC lockloss, 6.2 Mag Earthquake, 30km SW of Ovalle, Chile, 02:51:18 UTC
23:48 UTC tour in control room
23:58 UTC video3 frozen, rebooted
00:26 UTC last of tour left control room
01:10 UTC problems with operator0 workstation, rebooted twice
02:06 - 02:11 UTC stepped out of control room

Still in observing mode at ~ 70 MPc.
A tour group was on site this afternoon. Arrival time at LSB = ~3:00 PM. Departure time = ~5:15 PM. Group size = ~26 adults. Vehicles at the LSB = ~12 passenger cars. The group walked to the overpass near 4:15 PM and visited the control room near 4:45 PM.
23:23 UTC Back to observing. Only intervention required was moving the BS in pitch at LOCK_DRMI_1F. Cheryl states that it is acceptable that the 'Continuous Wave Inj Signal' on the Ops Overview is red and stating 'No Injection'.
TITLE: 09/25 [EVE Shift]: 23:00-07:00 UTC (16:00-00:00 PDT), all times posted in UTC
STATE Of H1: Lock loss 10 minutes prior to start of shift.
OUTGOING OPERATOR: Cheryl
QUICK SUMMARY: Lights appear off in the LVEA, PSL enclosure, end X, end Y and mid X. I can not tell from the camera if they are off at mid Y. Seismic in 0.03 - 0.1 Hz band is between 10^-2 and 10^-1 um/s at end X and end Y. It is around 10^-2 um/s at the corner station. Seismic in 0.1 - 0.3 Hz band is around 10^-1 um/s. Wind speeds are ranging up to 20mph.
SUMMARY:
IFO relocked and was in Observe most of the shift.
4 large ETMY glitches in the second half of the lock.
IFO lost lock about 10 minutes before the end of the shift.
Currently relocked and on it's way to Low Noise.
TIMELINE:
18:42:56UTC - IFO to Observe
20:28:09UTC - ETMY saturation
20:31:19UTC - airplane heard in CR
20:36:45UTC - airplane heard in CR again
22:00:00UTC - or about that... Gerardo drives to Mid-Y
22:15UTC - Gerardo left Mid-Y
22:20UTC - Gerardo arrived Corner Station
22:50UTC - lock loss
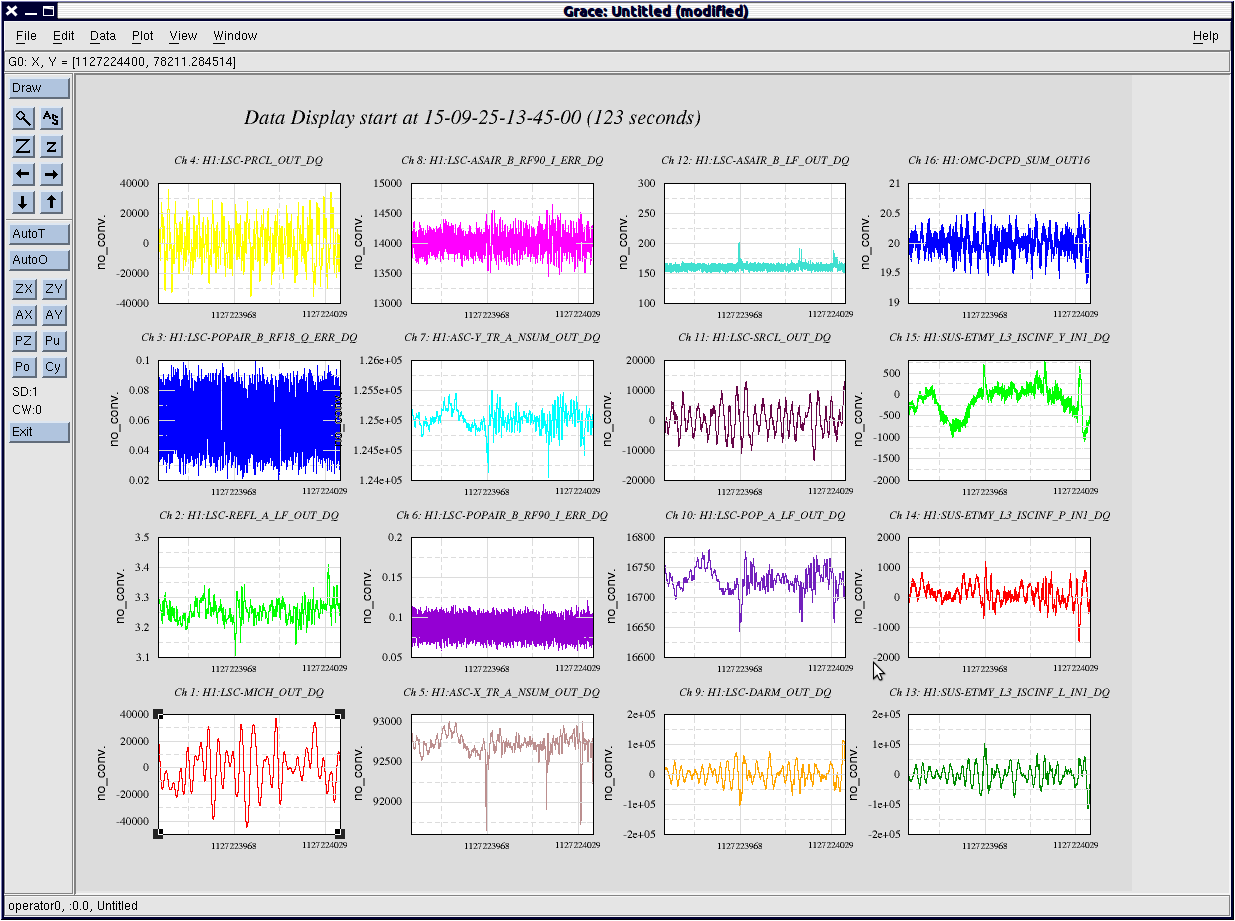
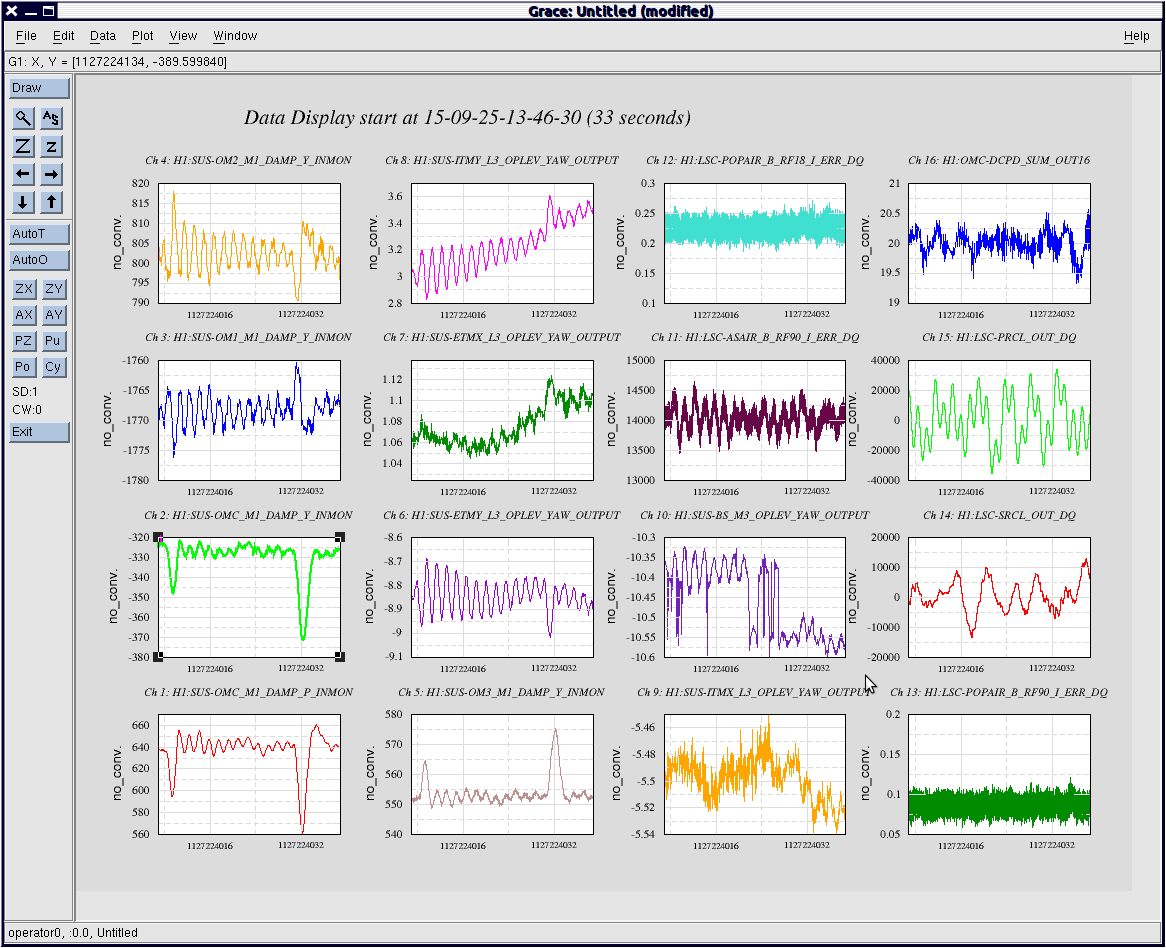
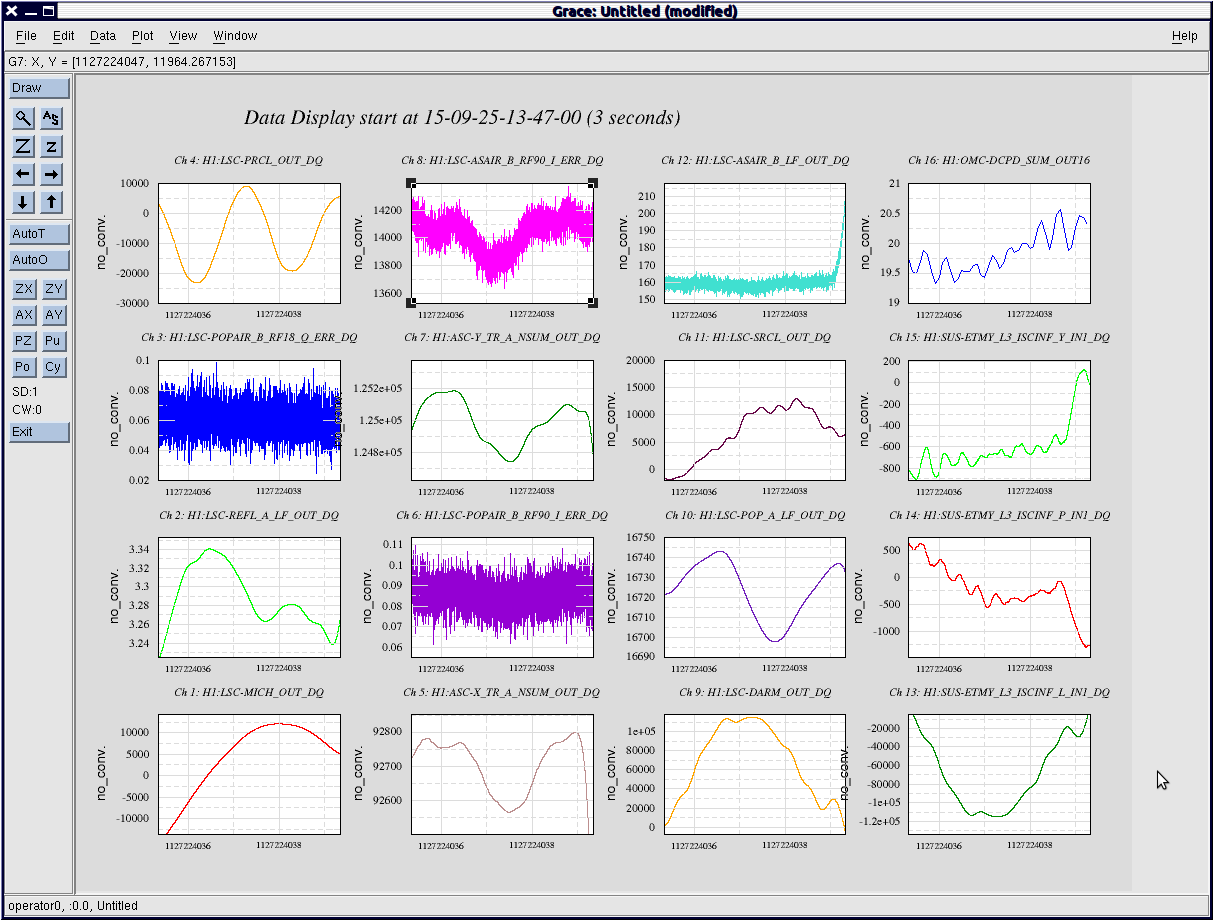
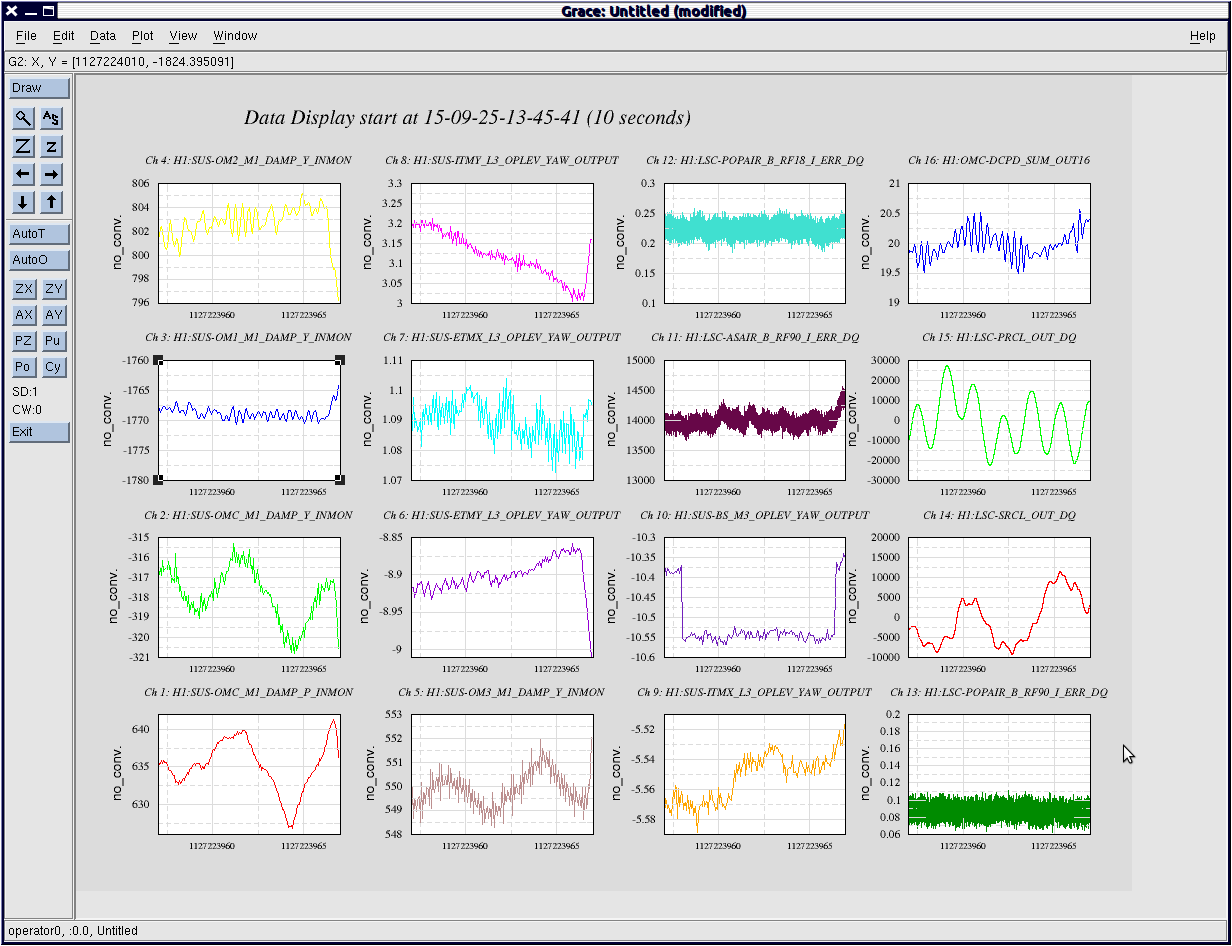
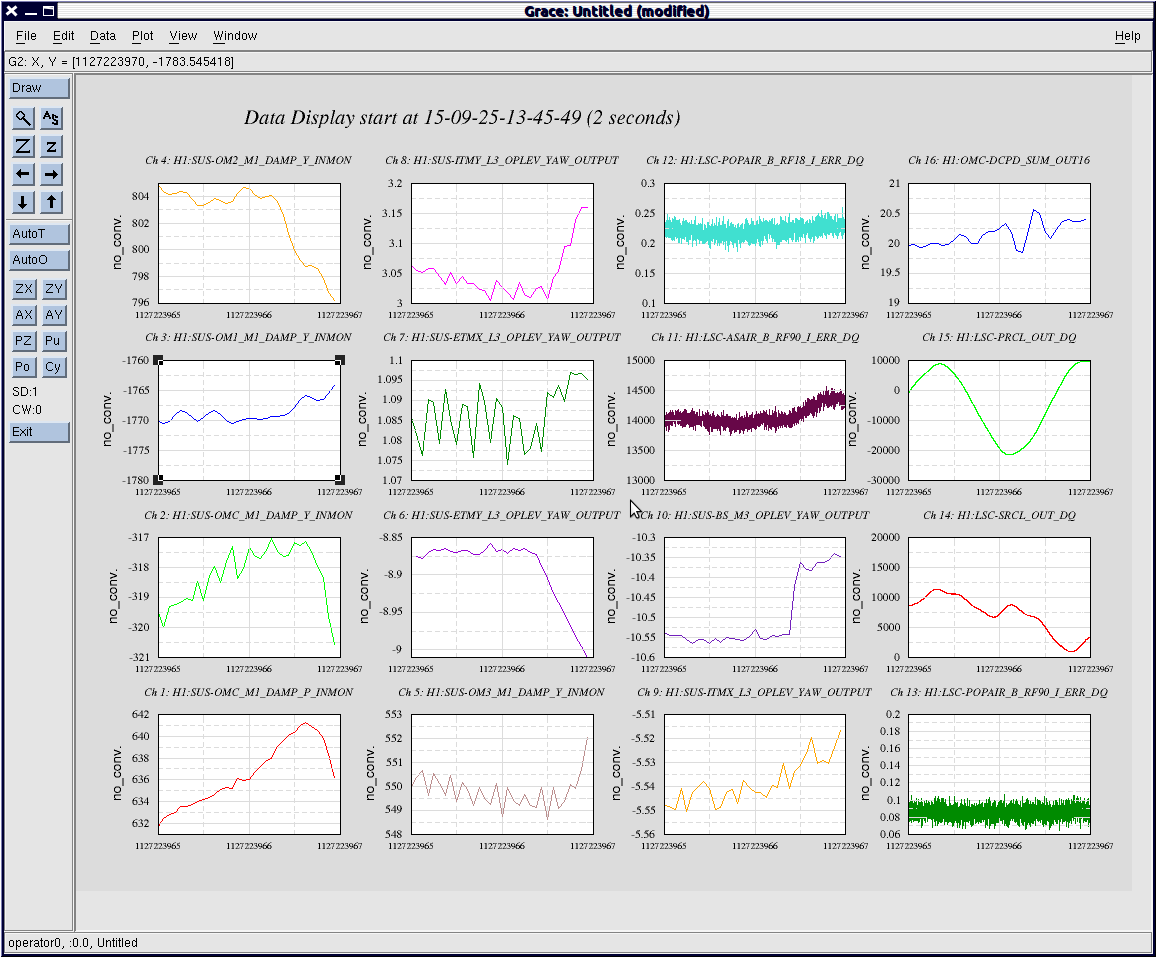
I made 4 plots, and on the control side, it's subtle but looks to me like OM1 M1 DAMP Y deviated first at lock loss, and on the optics side, all of Y arm optics were already oscillating and then lock loss.
Plot 1: last 33 seconds of the lock - control signals
Plot 2: last 33 seconds of the lock - optics
Plot 3: last 3 seconds of the lock - control signals
Plot 4: last 10 seconds of the lock - optics
Plot 5: fist big glitch at 13:45:47
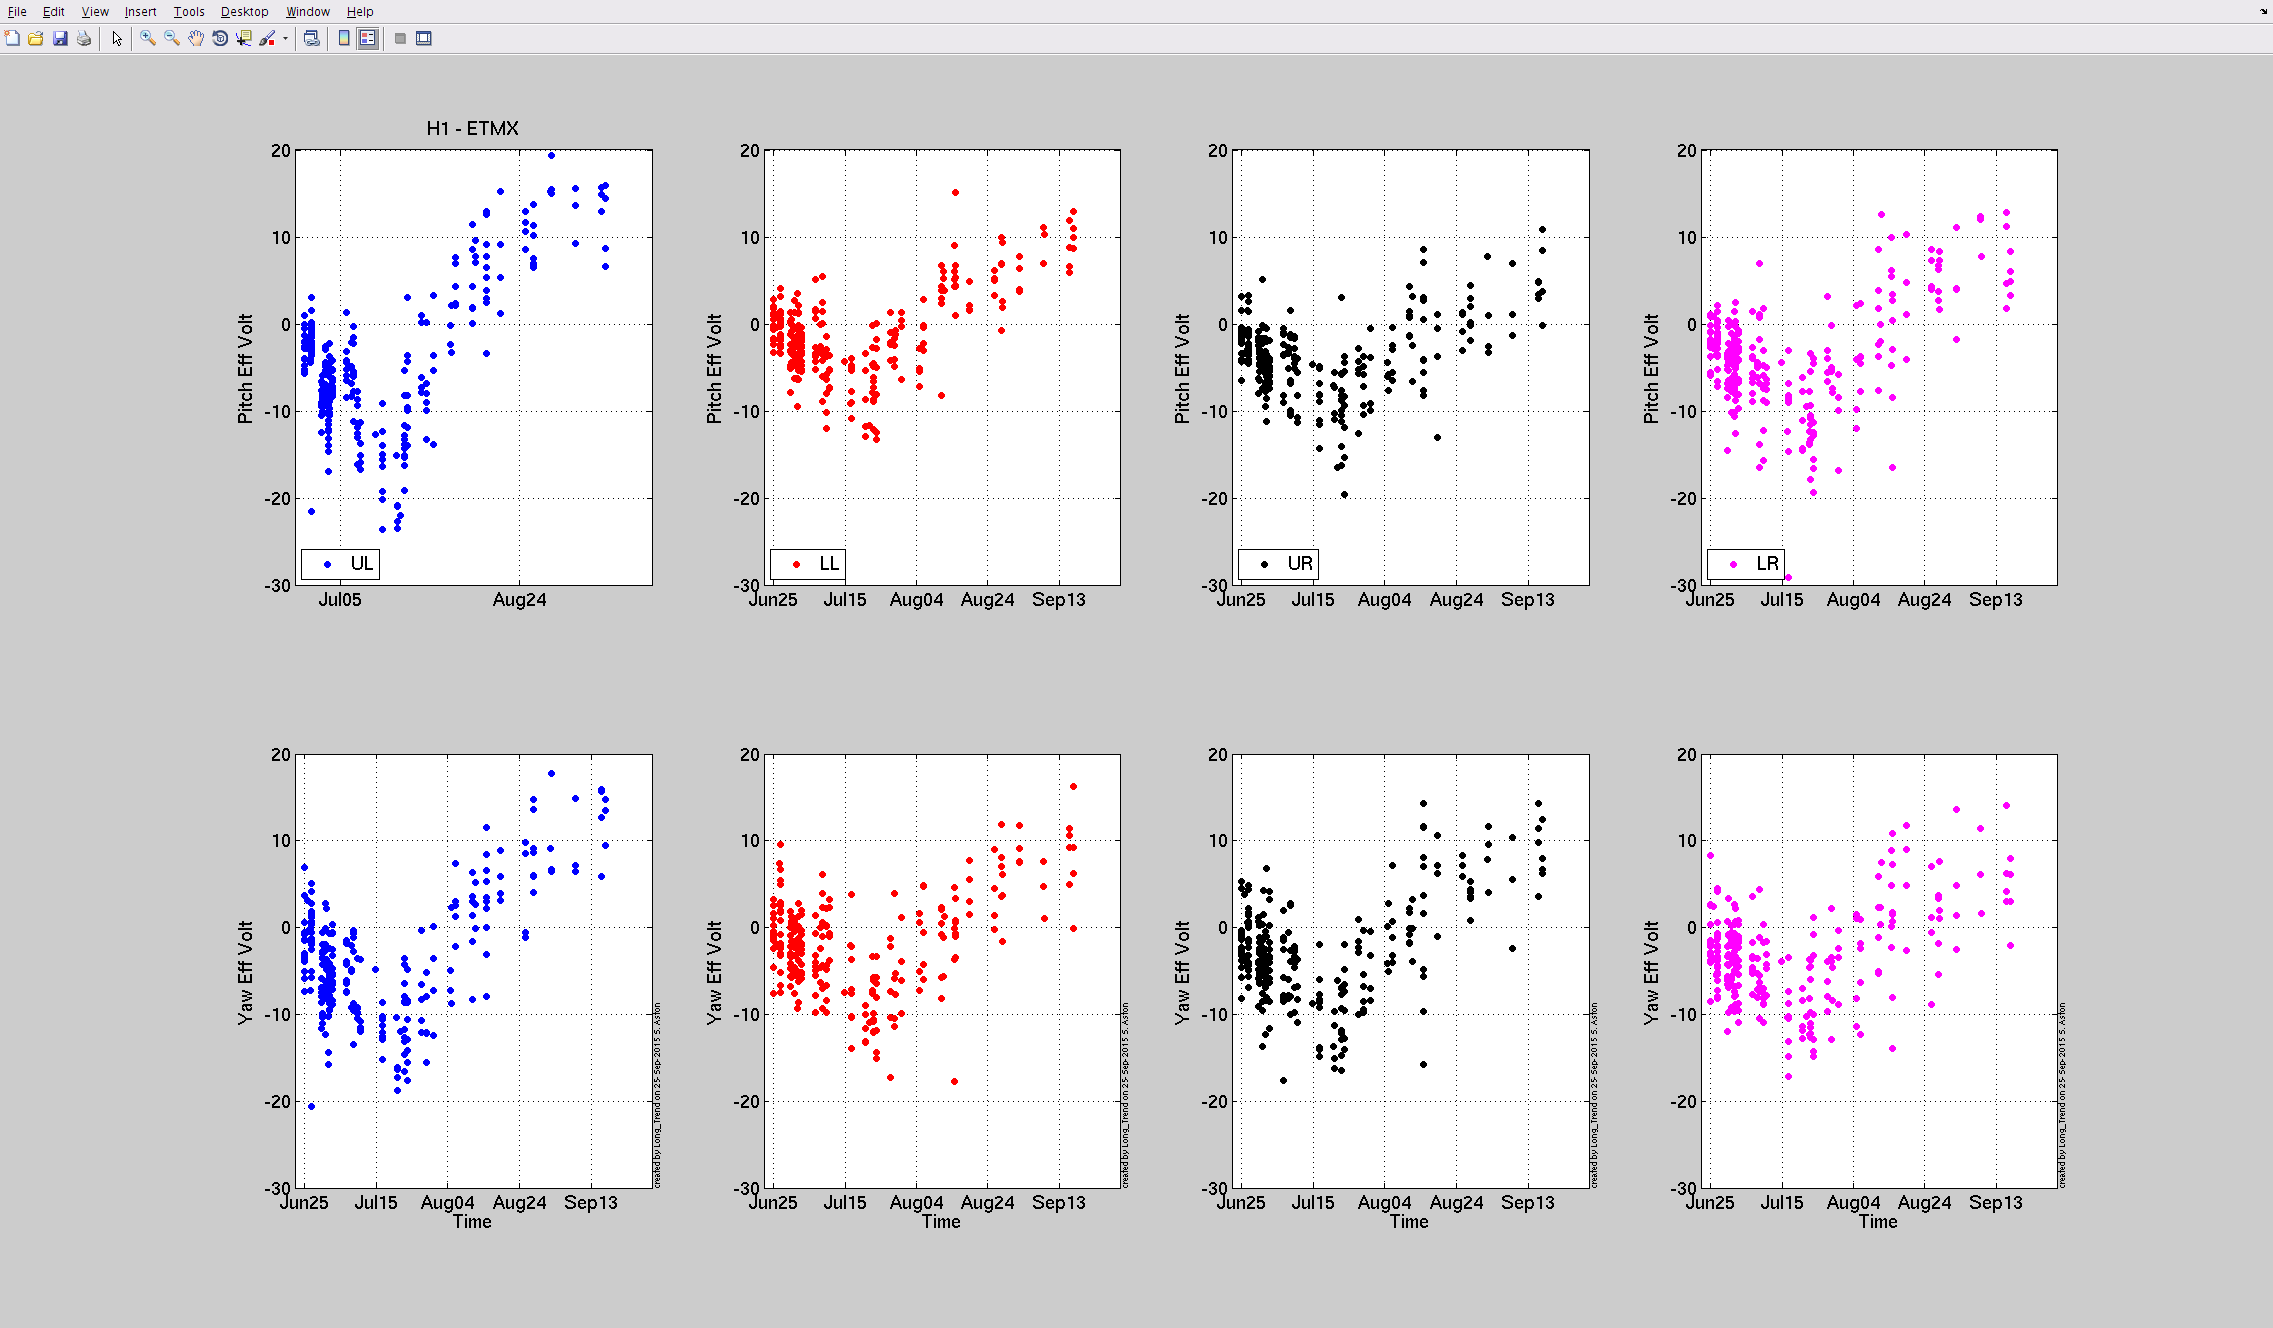
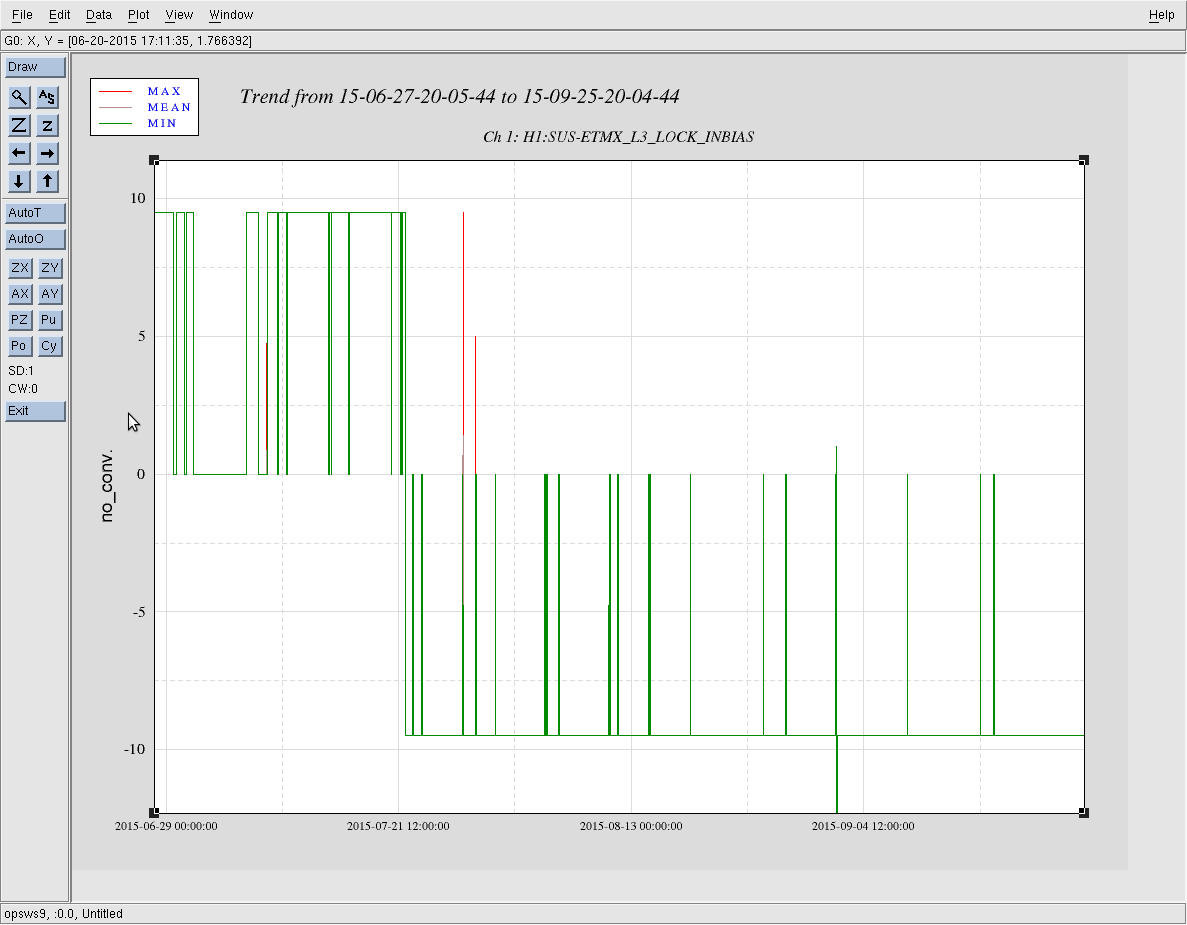
During the large earthquake last Friday, Jeff K took the opportunity to run a set of charge measurements on the ETMs. While the ETMy data did not yield successful plots (am looking into matlab), the ETMx results are posted below in trends from July to now. Note, we last changed the bias signs (on both ETMX and ETMY) on July 22nd - alog 19848.

In an effort to create a inverse actuation filter for Hardware injection through Pcal infrastructure, we use the transfer function between RxPD and excitation of which RxPD is calibrated in terms of metres of displacement. . Using this RxPD calibration and the measured transfer fumction we calibrate the excitation [cts] in terms of metres and use it to create the inverse actuation filter. This will be installed in one of the excitation channel, possibly swept sine channel, for testing purpose.
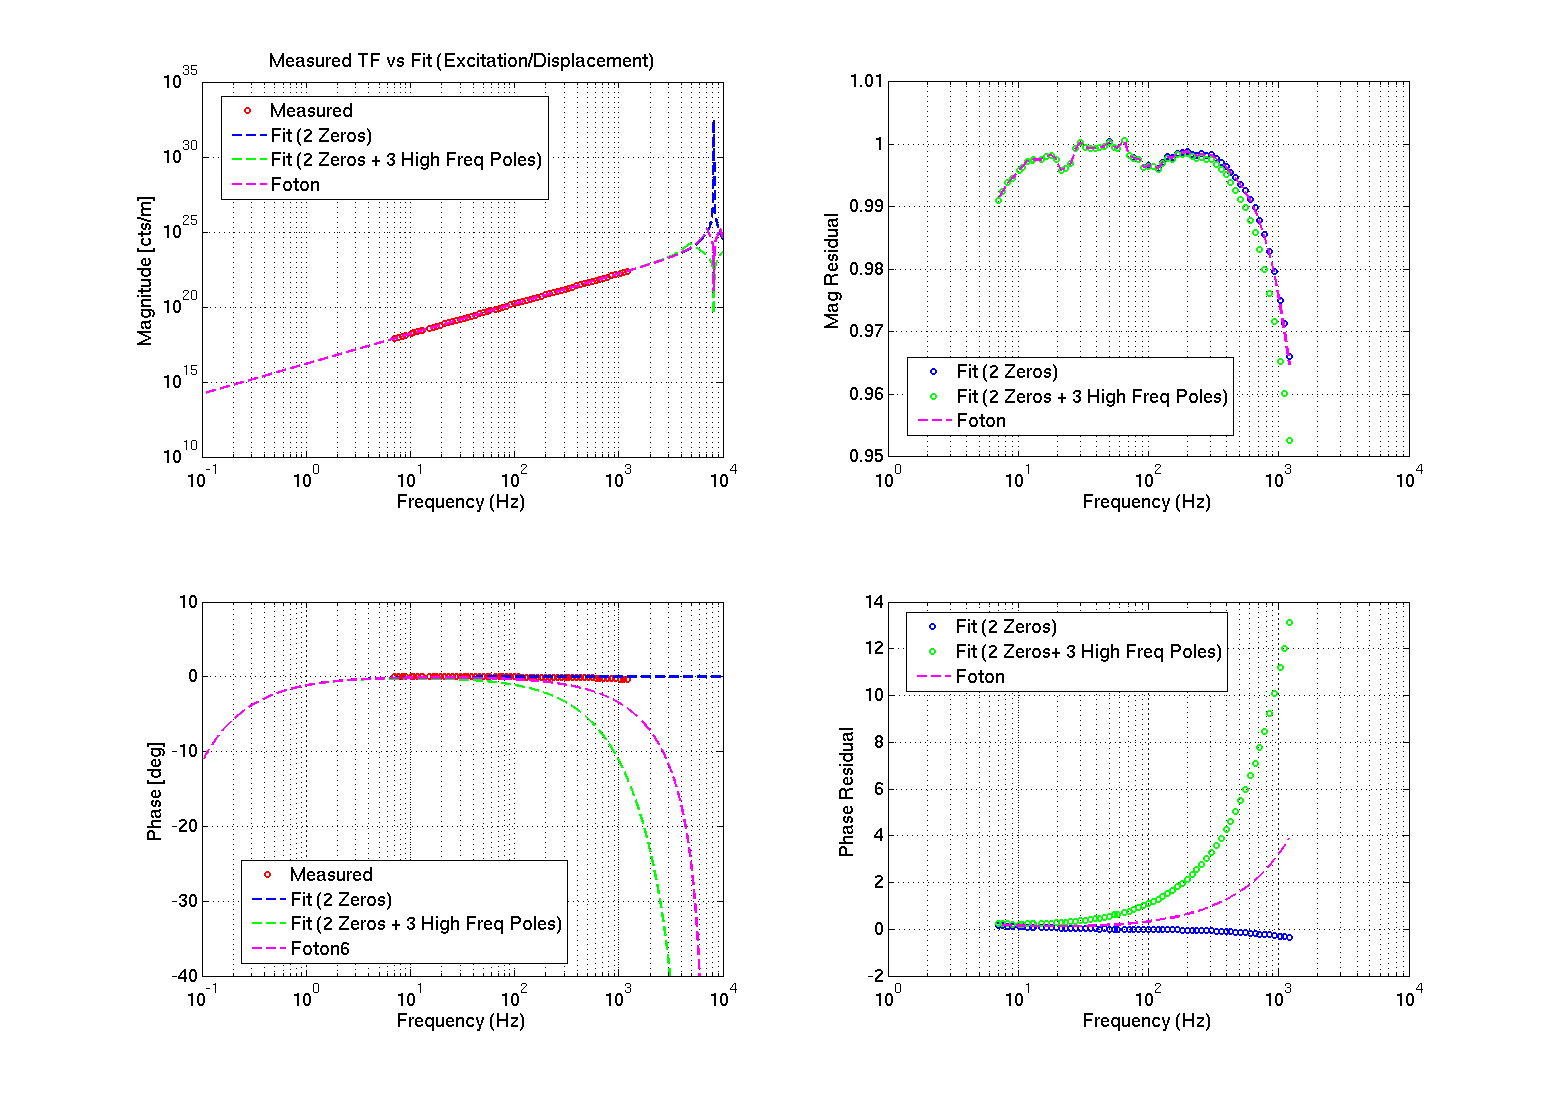
In the above plot, the two left plots are the actual magnitude and phase of the measurement and different fits. The red plot is the inverse of measured transfer function between calibrated RxPD and pcal excitation. In short, it is cts of excitation to metres of test mass displacement. The rest of the plots are fit to that measured TF. In this case, the residual plots on the right side are more informative. The blue plot is the residual between measured TF and the fit that includes two zeros. The residual looks pretty good for this case but we do not have the luxury of only using two zeros. We need equal or greater number of poles to roll off the signal at higher frequency. For this we use a complex pole pair at 7 Khz and an additional real pole at same frequency. This creates some magnitude and significant phase distortion at higher frequencies as seen in the green residual plot but this is a systematic and we can account for this in our analysis later.
The magenta plot is the foton implementation of our two zeros and three pole fit plotted in green. There is a difference between the actual matlab generated filter and the foton version of it at frequencies above KHz. This is a known effect and is described in detail in G1501013.
I have written a litlle more detail technical note and can be found at T1500496.
The script used to generate the plots above is committed to the SVN:
/ligo/svncommon/CalSVN/aligocalibration/trunk/Runs/O1/H1/Scripts/INVACT_PCAL/
The measuremnt files are in the following location
/ligo/svncommon/CalSVN/aligocalibration/trunk/Runs/O1/H1/Measurement/INVACT_PCAL/
To assess the health of the HEPI Actuator Parker Valves, which are very susceptable to blockage from fluid contaminants, LLO has regularly done the "Valve_Check" test. I have never successfully managed to make this work at LHO mainly because of missing files and lack of understanding of all the components to the test.
It also requires the HEPIs to be deisolated as 3hz sines waves are driven to the valves to assess the health of the valve. The results are posted on a plot and compared to previous values and trends and dramatic changes are spotted indicating a valve problem. Again, since we don't like taking the HEPI platforms down, and, I haven't been able to get the valve check to run here, an alternative which doesn't require de-isolating the platform is being searched for.
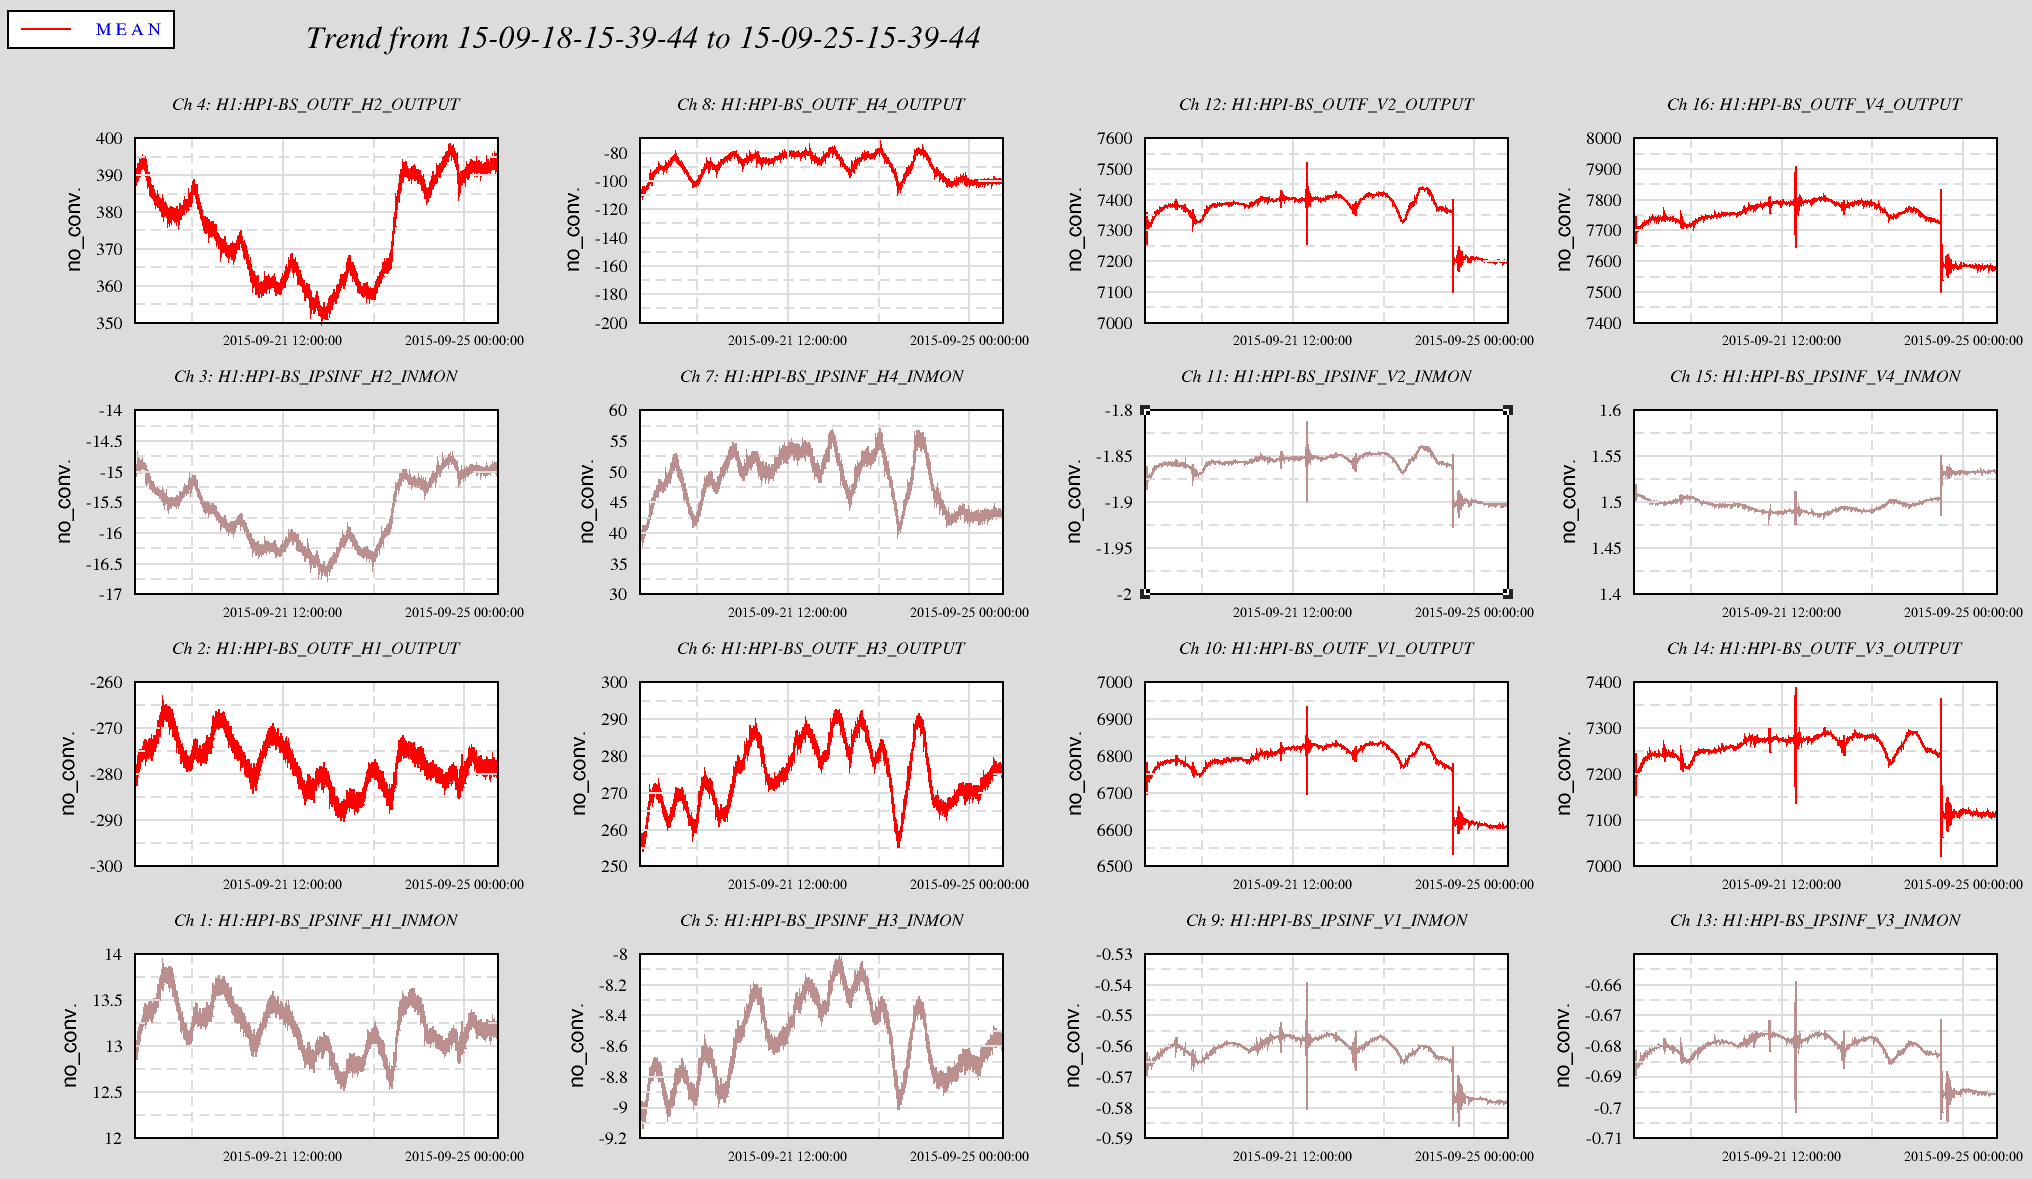
As we are looking for changes in the valve's effectiveness, it seems simple enough to look at the postion of the Actuator (IPS) in response to the Actuator Drive (OUTF.) So in dataviewer, I was just going to plot the local basis IPS INMON and the OUTF_OUTPUT. Upon further study, we might find it better to extract from other points of the chain such as IPS OUTPUT to get nm but for now I just grabbed the overview elements which is counts (0.001"/655cts) and the OUTF_OUTPUT...which should be nm in IPS space, not drive to make nm, I think... Anyway, at this point we are just looking for bad trends or steps that can not be explained.
I was going to start with 14 days of data (LLO runs the valve check weekly) but there was some zero elements that I can't figure out how to remove with DV so I'm getting divide by zero errors. So here is just a week's data for the BS.
In the attached plot I put the 8 each IPS reading and OUTF drive pairs adjacent (H1 in Chs 1 & 2, H2 in Chs 3 & 4, etc.) I then made the ratio of reading to drive and put it in the Ch1 graph hiding the original IPS reading. So the graphs with the brown traces are the ratios between the IPS not seen and the red trace drive in the graph just above.
So what stands out?
Regarding valve health...there are no monotonic trends but it is only a week so maybe not useful.
There is a shift in all vertical channels but they are all about the same magnitude in OUTPUT. I'd think a bad valve would stand out as a larger shift and the other are just making up a smaller portion of the total load. While the shift is clear on the Drive OUTF, on the IPS reading it is at the few counts level, related to IFO state maybe and otherwise insignificant?
The ratios are much closer to unity for the verticals but this is just a function of the larger vertical drives as we have a nearly 1/2 mm offset on the vertical hold position on the BS.
For the Horizontal channels, the ratios for all but H4 drift, swing, oscilate around 1 or 2 units whereas H4 swings around 5 to 15 units. Does this indicate something different about H4? Other than just the zero position of the IPS or conspiring cartesian positions yielding a smaller drive to H4?
Given that the zero IPS reading is not necessarily zero, any conclusion depending on that is biased and so must be salted.
Conclusion, no changes in valve performance in the past week. More work needed to look at longer time periods. MIT(tlemen) is looking at this too.
TITLE: Sep 25 Day Shift 15:00-23:00UTC (08:00-16:00 PT)
STATE Of H1: Observing
OUTGOING OPERATOR: Ed
QUICK SUMMARY:
- IFO needed a small amount of tweaking to TMS, BS, and PR3
- SRM and HAM5 ISI and BS ISI tripped on DRMI lock loss??? All restored now.
- SDF difference for ASL_Y_WFS_DOF3 pitch and yaw gains reduced from 0.03 to 0.015, at 14:30UTC this morning, but no mention from Ed about why, so I set them back to 0.03
I'm not aware of any gain changes that occurred. I didn't do that manually.
TITLE: Sep 25 EVE Shift 07:00-15:00UTC (00:00-08:00 PDT), all times posted in UTC
STATE Of H1: Observing
LOCK DURATION: Entire Shift
SUPPORT: none needed
INCOMING OPERATOR: Cheryl V
Activity log:
12:17 Christina checked in the CR
12:30 Mike L gave a courtesy call to check on things and remind me that LLO is haveing GraceDB issues and that we’re to keep the apprised of any alarms that may occur.
13:47 Lockloss: ETMY saturations (9 in a row) No environmental explanation
14:28 After unsuccessfully trying to lock PRMI. I decided to go ahead and do INITIAL ALIGNMENT.
14:49 Did DIAG RESET on H1PASC0 timing error
Shift Summary:
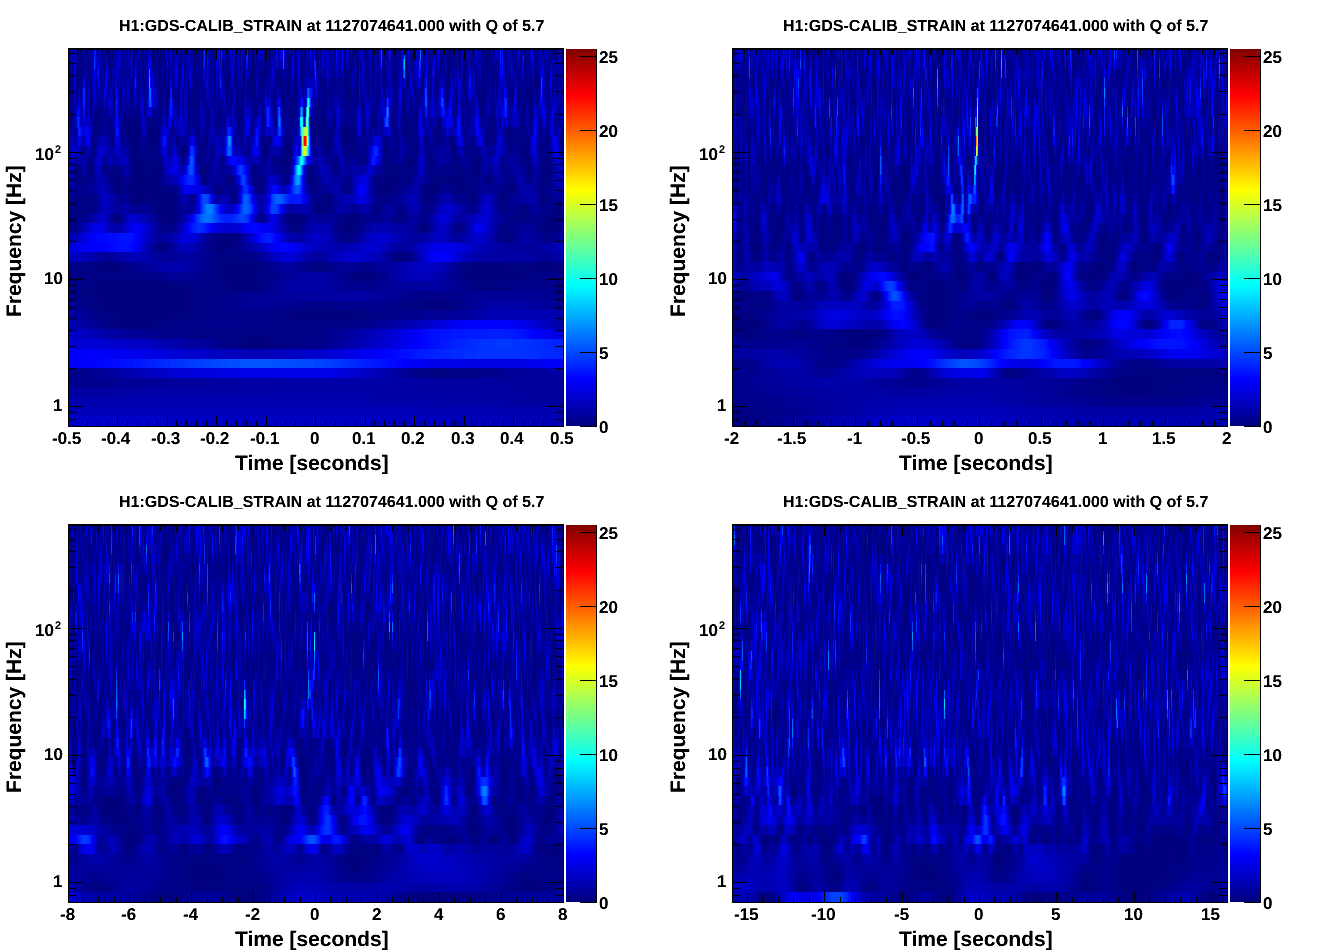
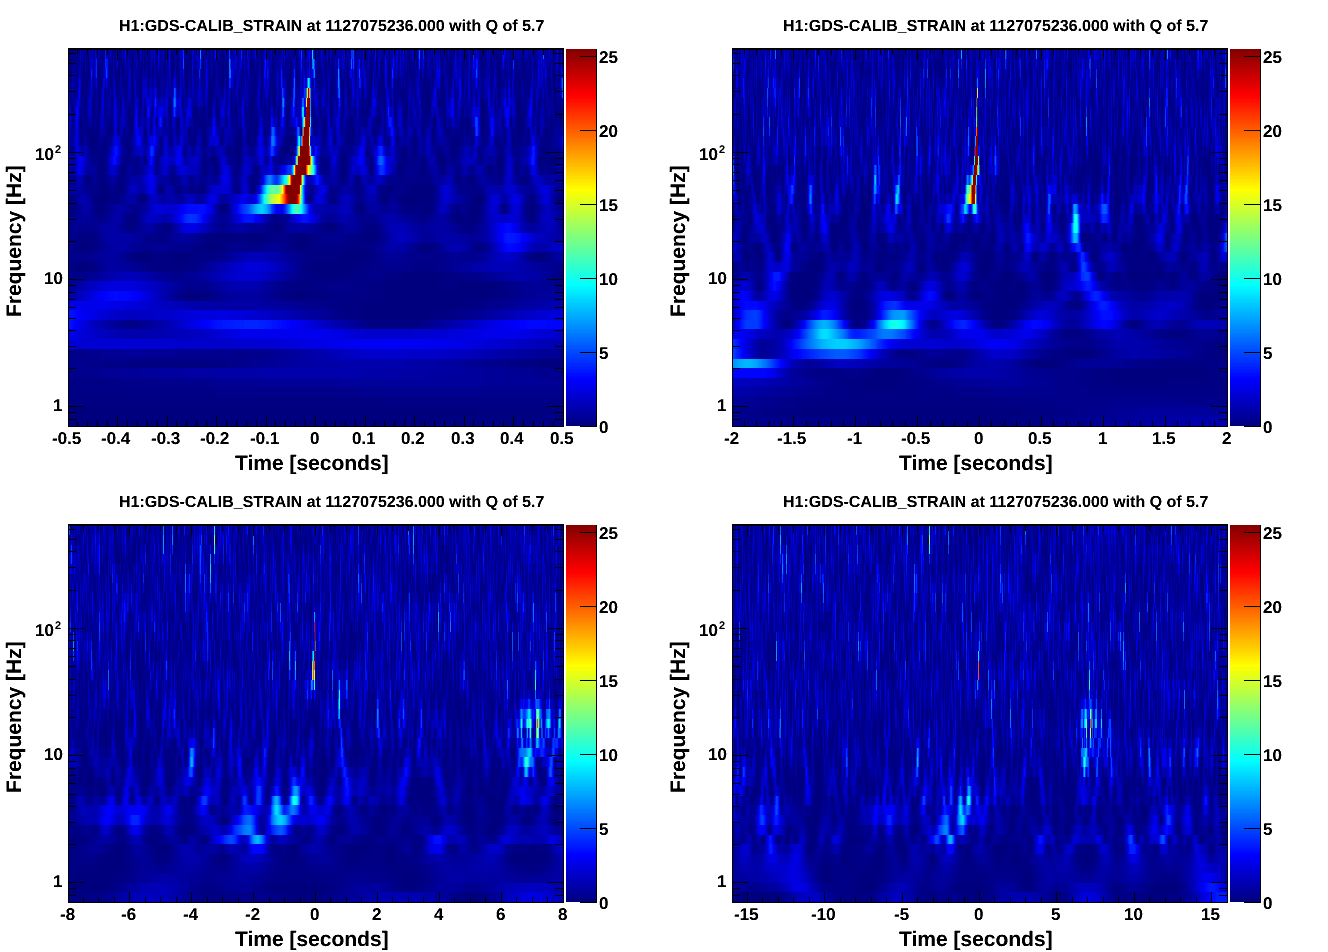
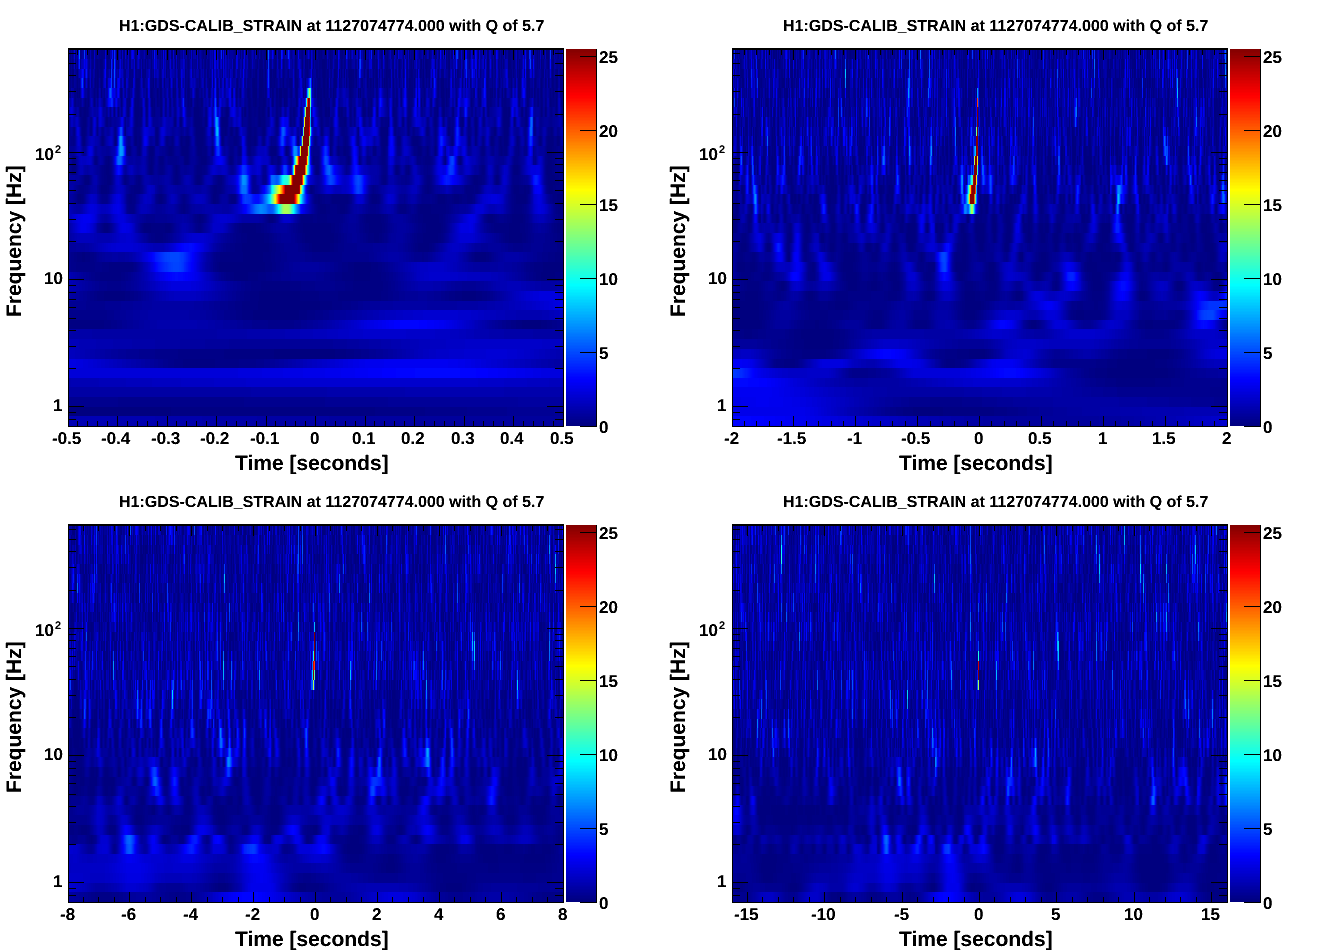
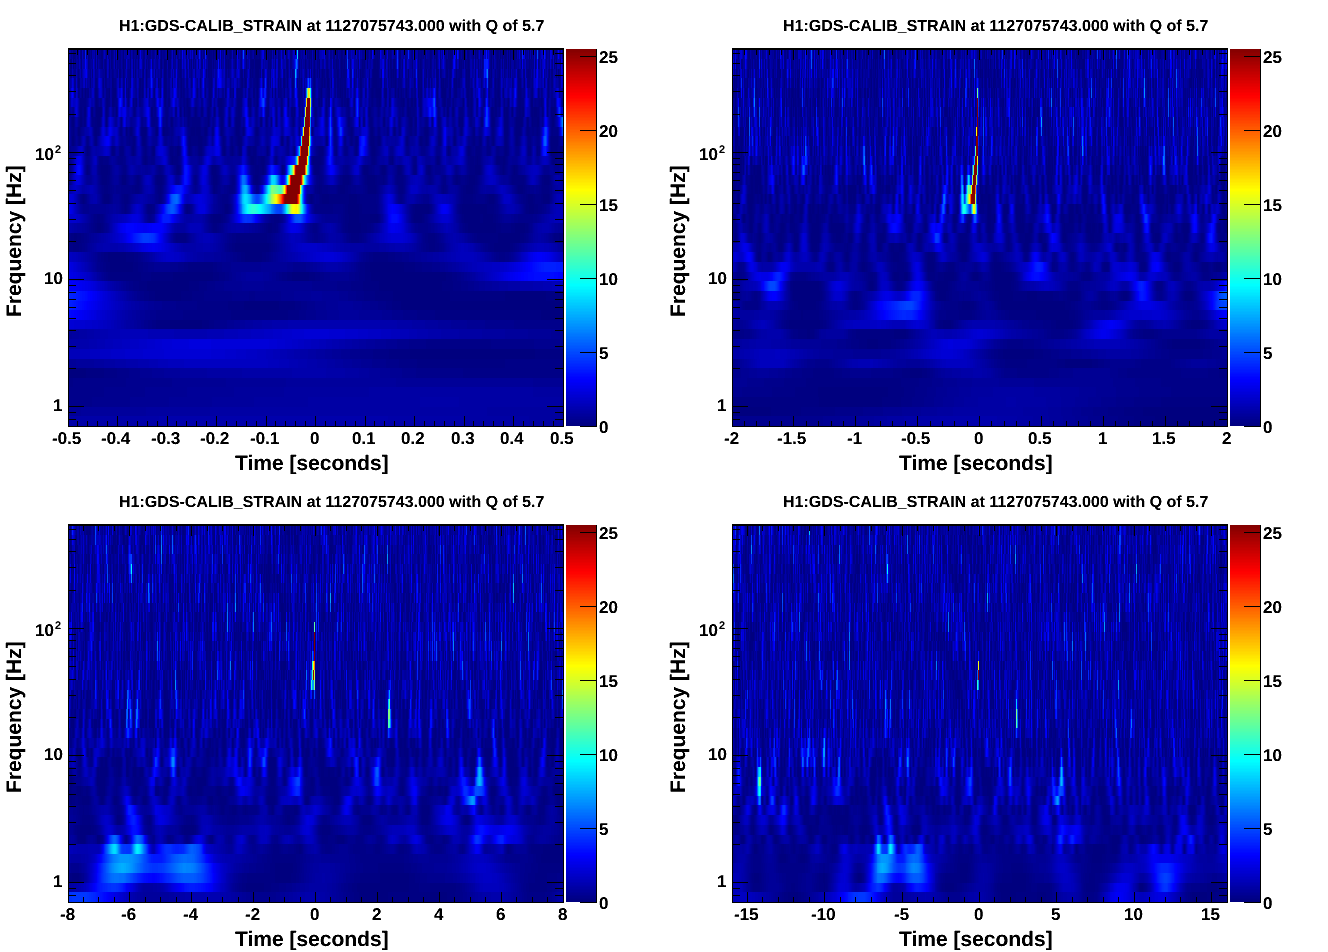
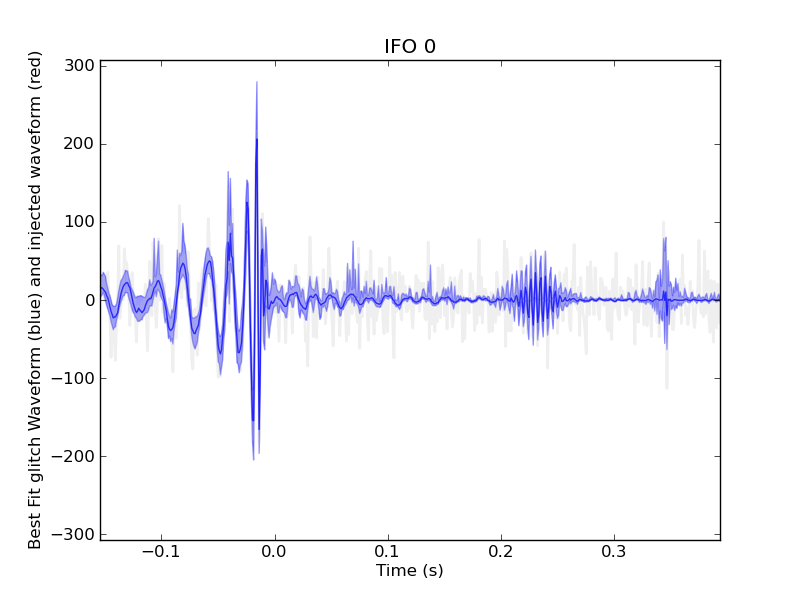
L1 went out of lock. At H1 we turned off the intent bit and injected some hardware injections.

The hardware injections were the same waveform that was injected on September 21. For more information about those injections see aLog entry 21759

For information about the waveform see aLog entry 21774.

tinj was not used to do the injections.The commands to do the injections were:
awgstream H1:CAL-INJ_TRANSIENT_EXC 16384 H1-HWINJ_CBC-1126257410-12.txt 0.5 -d -d >> log2.txt
awgstream H1:CAL-INJ_TRANSIENT_EXC 16384 H1-HWINJ_CBC-1126257410-12.txt 1.0 -d -d >> log2.txt
ezcawrite H1:CAL-INJ_TINJ_TYPE 1
awgstream H1:CAL-INJ_TRANSIENT_EXC 16384 H1-HWINJ_CBC-1126257410-12.txt 1.0 -d -d >> log2.txt
awgstream H1:CAL-INJ_TRANSIENT_EXC 16384 H1-HWINJ_CBC-1126257410-12.txt 1.0 -d -d >> log2.txt

To my chagrin the first two injections were labeled as burst injections.

Taken from the awgstream log the corresponding times are approximates of the injection time:

1127074640.002463000
1127074773.002417000
1127075235.002141000
1127075742.002100000

The expected SNR of the injection is ~18 without any scaling factor.

I've attached omegascans of the injections. There is no sign of the "pre-glitch" that was seen on September 21.
Attached stdout of command line.
Neat! looks good.
Hi Chris,
It looks like there is a 1s offset between the times you report and the rough coalescence time of the signal. Do you know if it is exactly 1s difference?
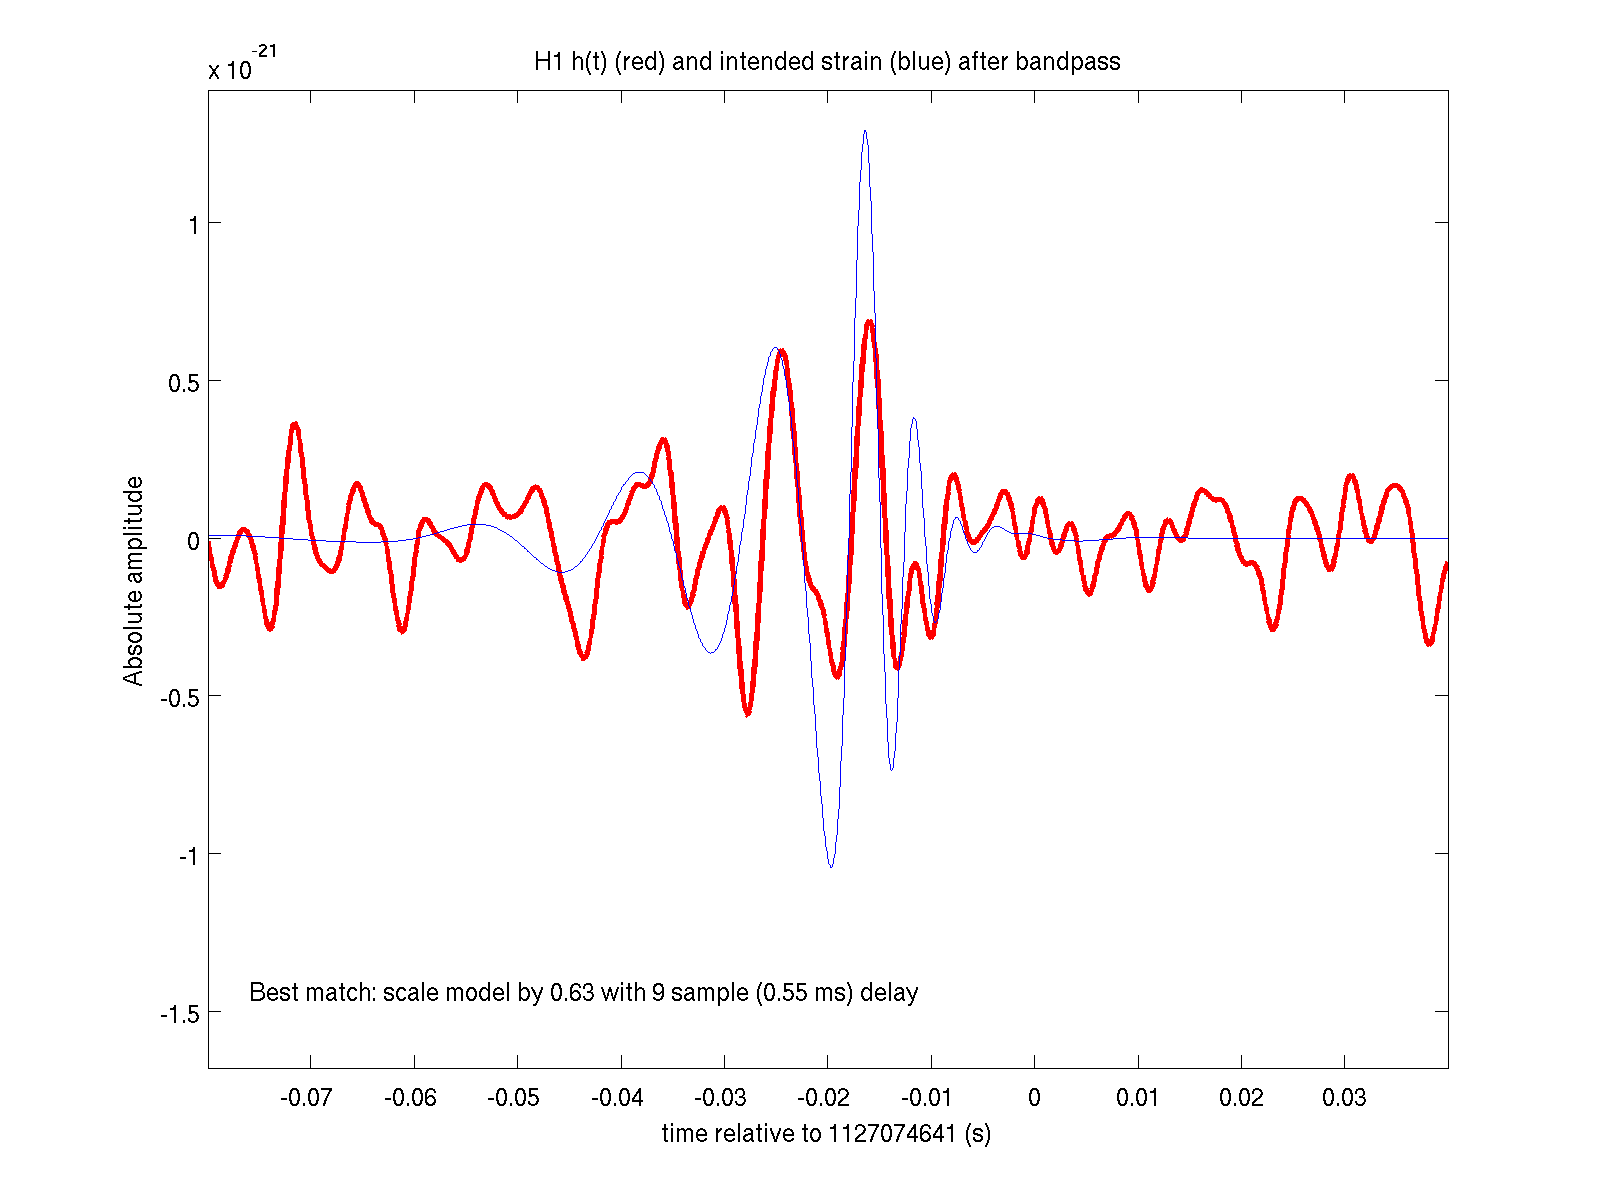
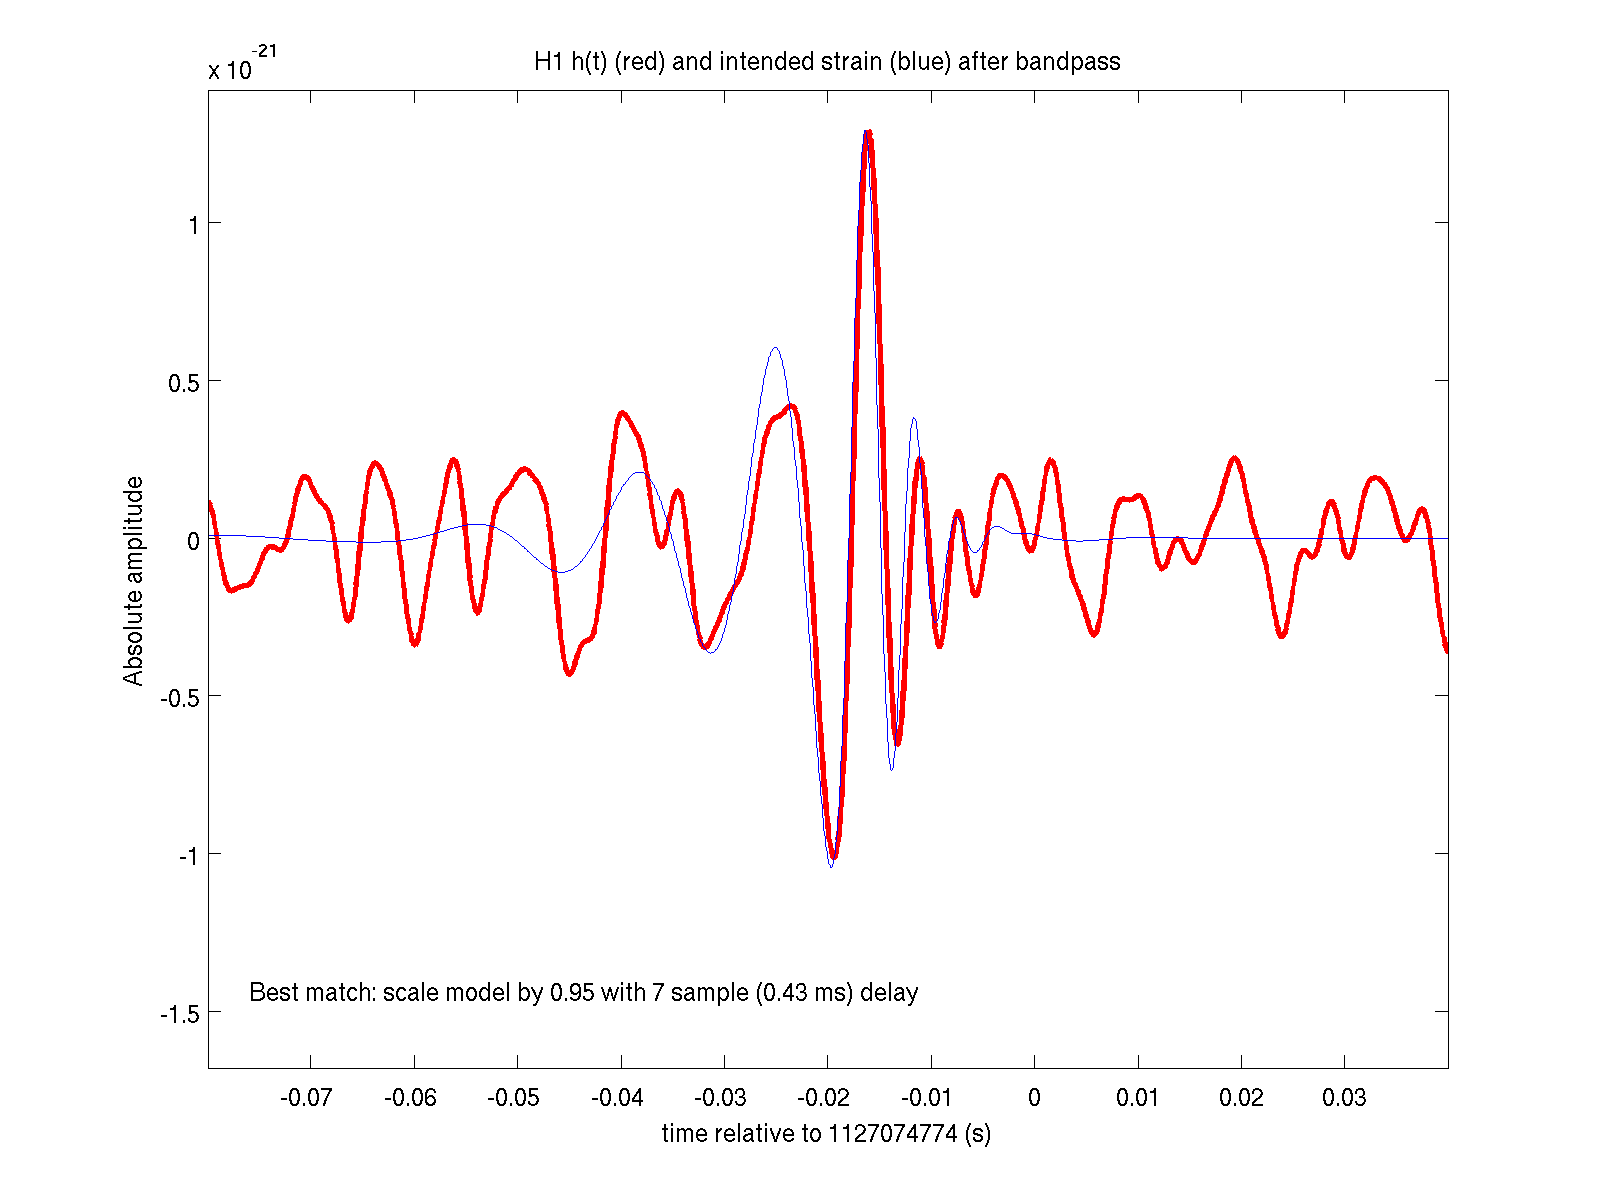
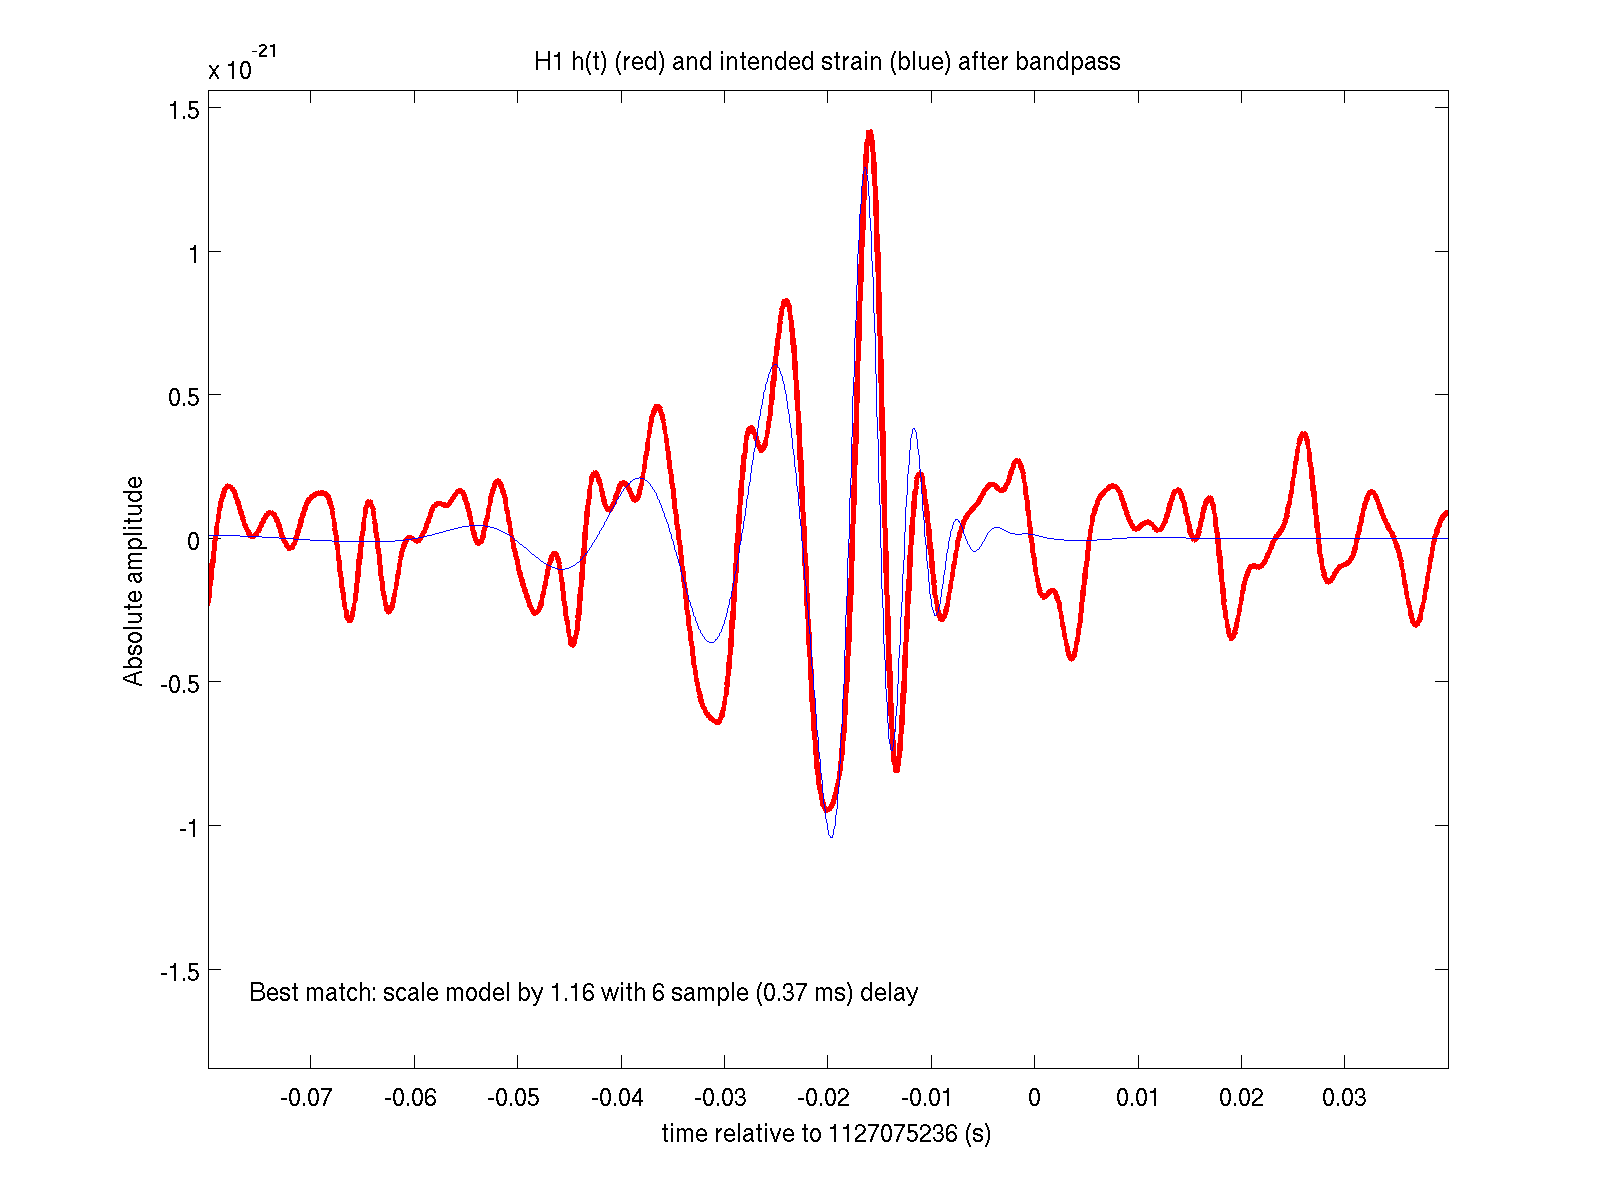
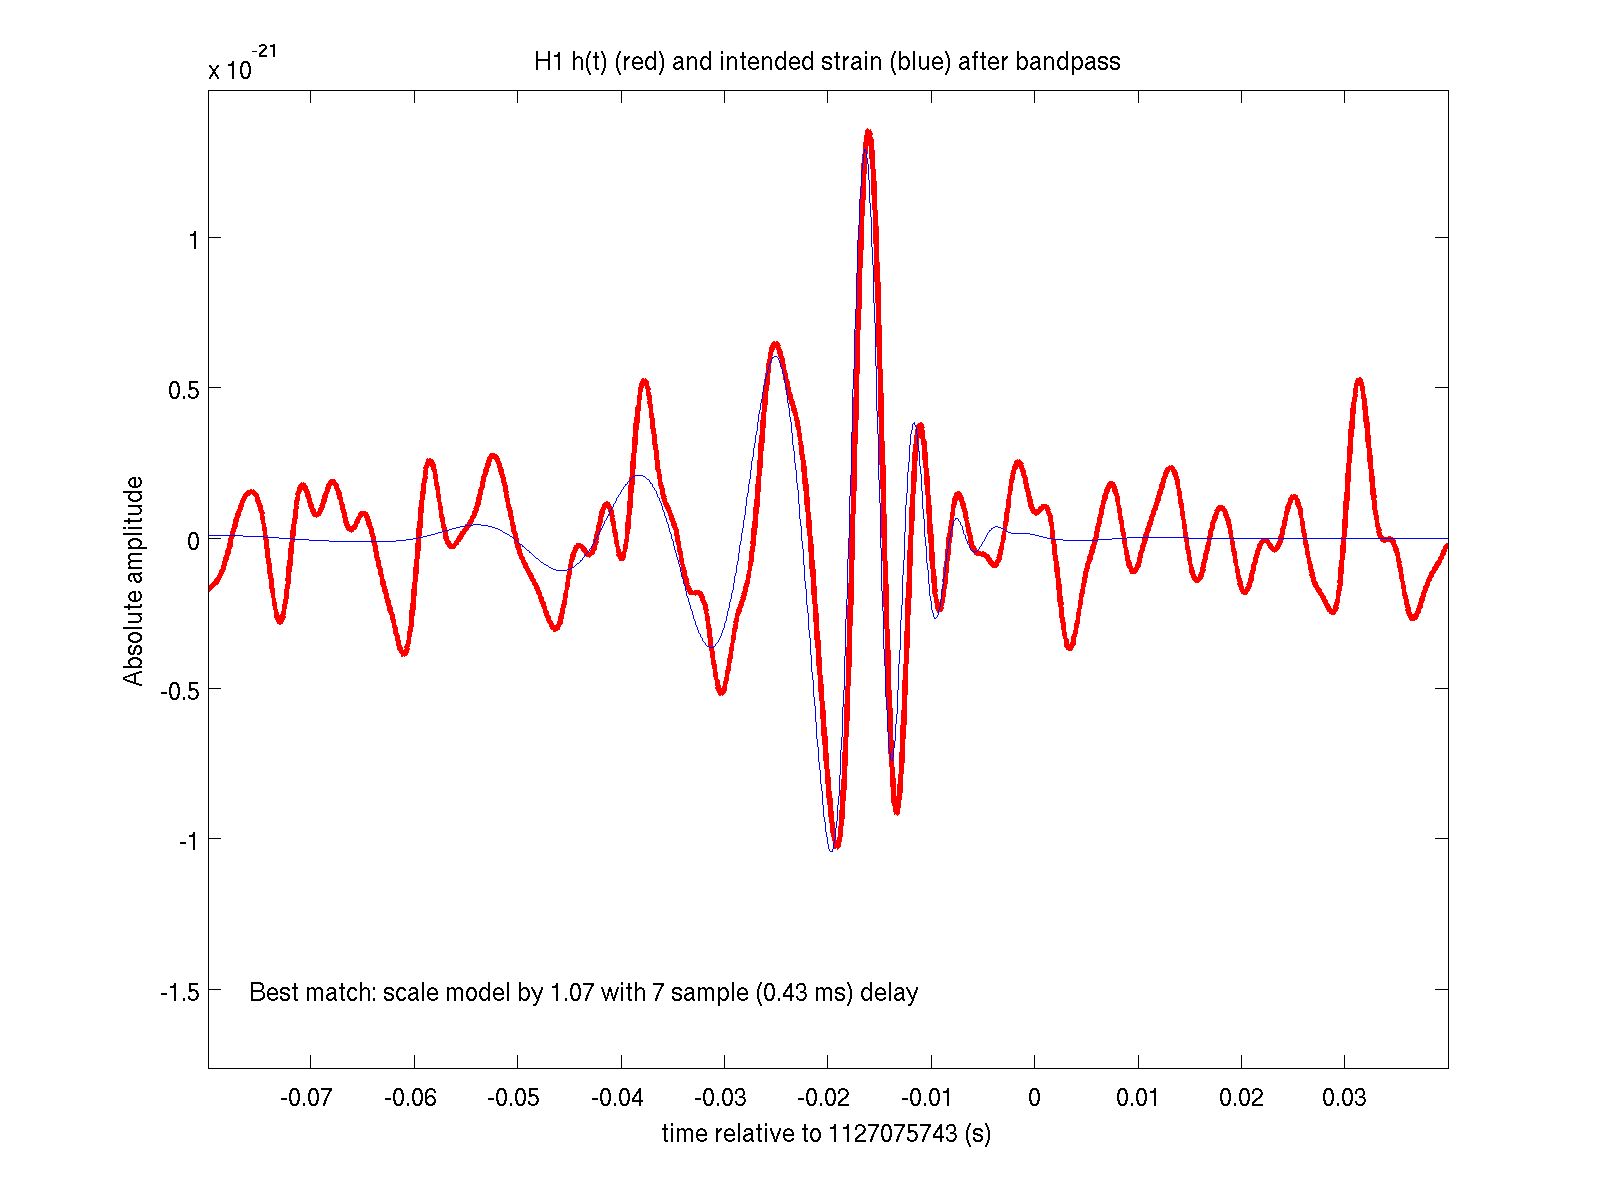
Yes, as John said, all of the end times of the waveforms are just about 1 second later that what's in the original post.

I ran a version my simple bandpass-filtered overlay script for these waveforms.  Filtering both the model (strain waveform injected into the system) and the data from 70-260 Hz, it overlays them, and also does a crude (non-optimal) matched filter to estimate the relative amplitude and time offset.  The four plots attached are for the four injected signals; note that the first one was injected with a scale factor of 0.5 and is not "reconstructed" by my code very accurately.  The others actually look rather good, with reasonably consistent amplitudes and time delays.  Note that the sign of the signal came out correctly!
I ran the daily BBH search with the injected template on the last two injections (1127075235 and 1127075742).

For 1127075235; the recovered end time was 1127075235.986, the SNR was 20.42, the chi-squared was 29.17, and the newSNR was 19.19.
For 1127075242; the recovered end time was 1127075242.986, the SNR was 20.04, the chi-squared was 35.07, and the newSNR was 19.19.
KW sees all the injections with the +1 sec delay, some of them in multiple frequency bands.
From
  /gds-h1/dmt/triggers/H-KW_RHOFT/H-KW_RHOFT-11270/H-KW_RHOFT-1127074624-64.trg
  /gds-h1/dmt/triggers/H-KW_RHOFT/H-KW_RHOFT-11270/H-KW_RHOFT-1127074752-64.trg
  /gds-h1/dmt/triggers/H-KW_RHOFT/H-KW_RHOFT-11270/H-KW_RHOFT-1127075200-64.trg
  /gds-h1/dmt/triggers/H-KW_RHOFT/H-KW_RHOFT-11270/H-KW_RHOFT-1127075712-64.trg

    tcent         fcent significance channel
1127074640.979948   146    26.34      H1_GDS-CALIB_STRAIN_32_2048
1127074774.015977   119    41.17      H1_GDS-CALIB_STRAIN_8_128
1127074773.978134   165   104.42      H1_GDS-CALIB_STRAIN_32_2048
1127075235.980545   199   136.82      H1_GDS-CALIB_STRAIN_32_2048
1127075743.018279   102    74.87      H1_GDS-CALIB_STRAIN_8_128
1127075742.982020   162   113.65      H1_GDS-CALIB_STRAIN_32_2048

Omicron also sees them with the same delay
From :
  /home/reed.essick/Omicron/test/triggers/H-11270/H1:GDS-CALIB_STRAIN/H1-GDS_CALIB_STRAIN_Omicron-1127074621-30.xml
  /home/reed.essick/Omicron/test/triggers/H-11270/H1:GDS-CALIB_STRAIN/H1-GDS_CALIB_STRAIN_Omicron-1127074771-30.xml
  /home/reed.essick/Omicron/test/triggers/H-11270/H1:GDS-CALIB_STRAIN/H1-GDS_CALIB_STRAIN_Omicron-1127075221-30.xml
  /home/reed.essick/Omicron/test/triggers/H-11270/H1:GDS-CALIB_STRAIN/H1-GDS_CALIB_STRAIN_Omicron-1127075731-30.xml

    peak time          fcent      snr
1127074640.977539062  88.77163  6.3716
1127074773.983397960 648.78342 11.41002  <- surprisingly high fcent, could be due to clustering
1127075235.981445074 181.39816 13.09279
1127075742.983397960 181.39816 12.39437

LIB single-IFO jobs also found all the events. Post-proc pages can be found here:

 https://ldas-jobs.ligo.caltech.edu/~reed.essick/O1/2015_09_23-HWINJ/1127074640.98-0/H1L1/H1/posplots.html
 https://ldas-jobs.ligo.caltech.edu/~reed.essick/O1/2015_09_23-HWINJ/1127074773.98-1/H1L1/H1/posplots.html
 https://ldas-jobs.ligo.caltech.edu/~reed.essick/O1/2015_09_23-HWINJ/1127075235.98-2/H1L1/H1/posplots.html
 https://ldas-jobs.ligo.caltech.edu/~reed.essick/O1/2015_09_23-HWINJ/1127075742.98-3/H1L1/H1/posplots.html

all runs appear to have reasonable posteriors.
Here is how Omicron detects these injections:

https://ldas-jobs.ligo-wa.caltech.edu/~frobinet/scans/hd/1127074641/
https://ldas-jobs.ligo-wa.caltech.edu/~frobinet/scans/hd/1127074774/
https://ldas-jobs.ligo-wa.caltech.edu/~frobinet/scans/hd/1127075236/
https://ldas-jobs.ligo-wa.caltech.edu/~frobinet/scans/hd/1127075743/

Here are the parameters measured by Omicron (loudest tile):
1127074640: t=1127074640.981, f=119.9 Hz, SNR=6.7
1127074773: t=1127074773.981, f=135.3 Hz, SNR=11.8
1127075235: t=1127075235.981, f=114.9 Hz, SNR=12.8
1127075742: t=1127075742.981, f=135.3 Hz, SNR=12.4
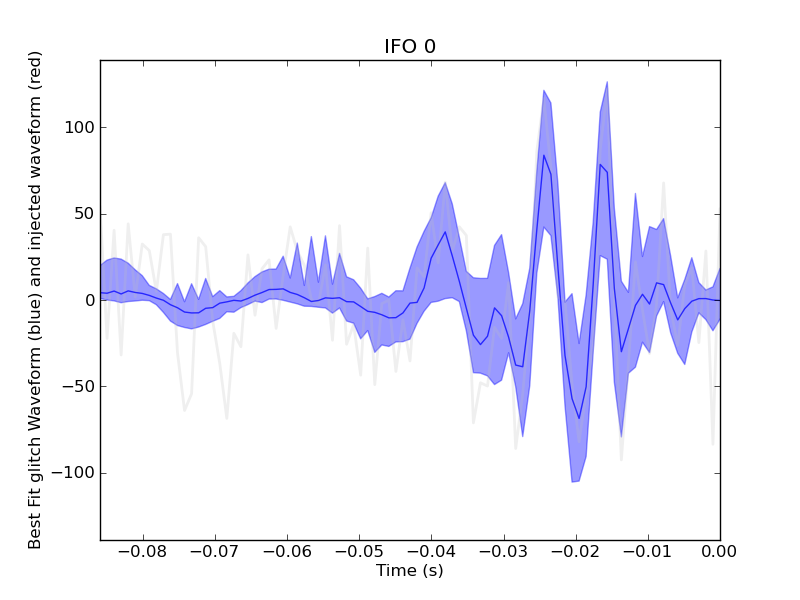
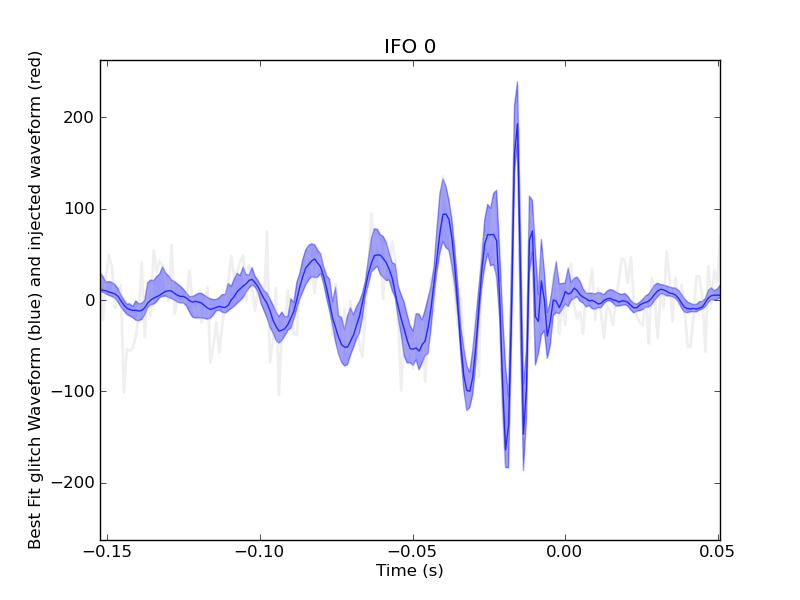
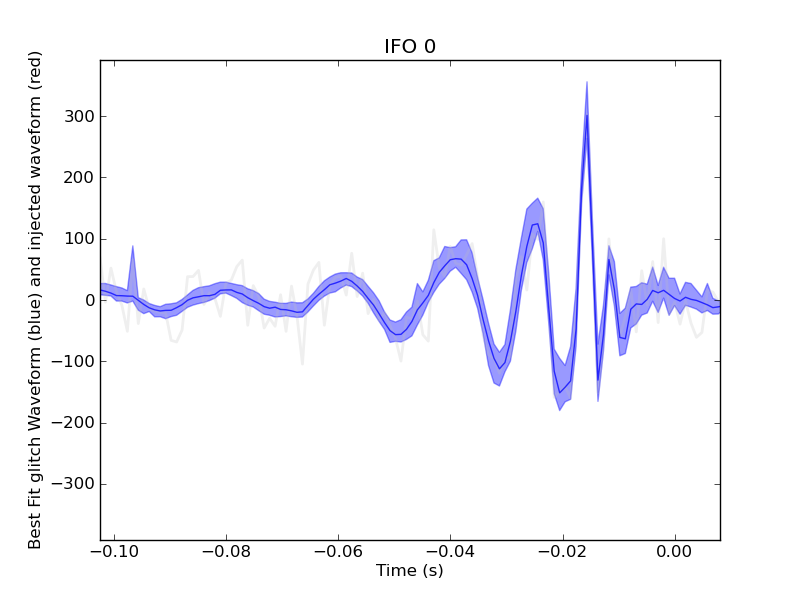
The BayesWave single IFO (glitch only) analysis recovers these injections with the following SNRs:
4640: 8.65535
4773: 19.2185
5253: 20.5258
5742: 20.1666
The results are posted here:
https://ldas-jobs.ligo.caltech.edu/~meg.millhouse/O1/CBC_hwinj/
JeffreyK, SudarshanK, DarkhanT,
Overview
We made comparison plots of a DARM OLG TF and PCAL to DARM TF measurements taken at LHO with H1DARMmodel_ER8 and H1DARMmodel_O1 (uncorrected and corrected with kappa factors).
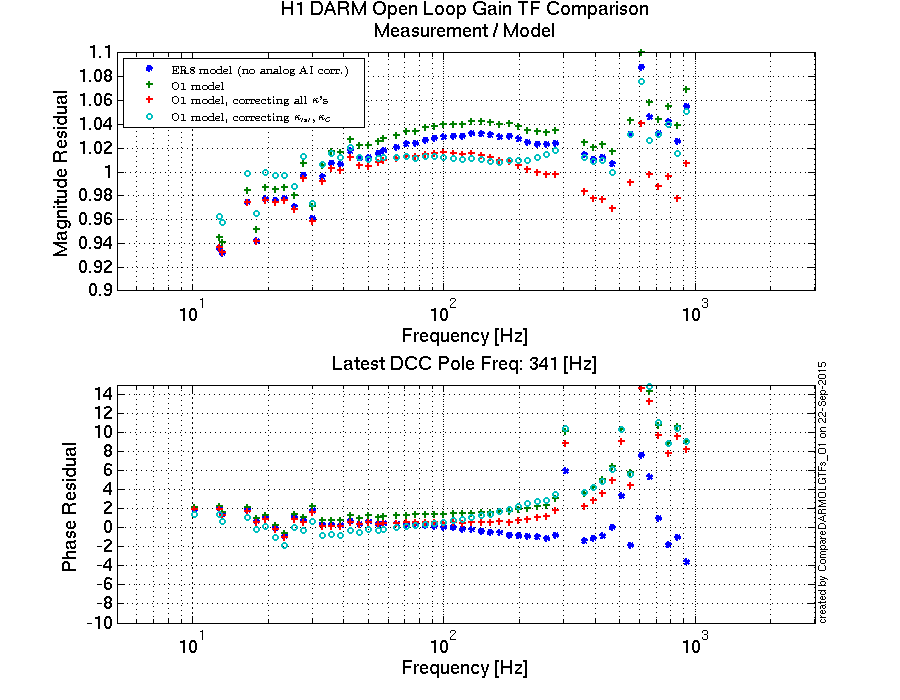
One of the main changes in the DARM model update for O1 compared to ER8 was that in the actuation function for ER8 model we did not account for an analog anti-imaging filter. We included that filter into the O1 model. Adding previously missing analog AI filter into the actuation function model increased the (measurement / model) residual to about 1% in magnitude and to ~6 deg around 500 Hz (~10 deg around 900 Hz). Initally some of the ER8 model parameter estimations (ESD/CD gains) were done to best fit the measurments for actuation function that does not include an analog AI.
We also took kappas calculated from calibration lines within about 20 minutes from DARM OLG TF measurement and plotted DARM model for O1 corrected with kappas in two different ways against the measurement to see how kappa corrections will take care of systematics in the model. At this point we don't have comparison results of the DARM OLG TF and PCAL2DARM TF measurements and kappa estimations to make a distinct statement. For this particular measurement from Sep 10, the DARM model that was corrected with κtst and κC produced smaller DARM OLG TF residual and actuation function residual compared to uncorrected model, but the sensing function residual was did not improve by the correction (see attached pdf's for actuation and sensing residuals).
Details
Some of the known issues / systematics in our DARM OLG TF model include:
- inverse actuation filters need to accout for an extra -1 sign (was fixed, see LHO alog 21703);
- CAL-CS reproduction should have a sign that's opposite from DARM output matrix (at LHO we had this correct, but it needed to be fixed at LLO).
This issue affects EP1 value that's written into Epics record and used for estimation of DARM time-dependent parameters (T1500377). At LHO in the DARM model for ER8 we manually rotated phase of EP1 to +44.4 degrees to account for this discrepancy; we modified both the paramter file and the DARM model script to account for the DAQ downsampling filter TF calculated at the xtst line frequency.
- residuals of actuation function and total DARM OLG TF (systemaic error);
- EP1-9 that are used for estimation of DARM temporal variations.
This variable might have been used in GDS calibration, we need to verify with MaddieW to make sure that this extra time delay is not included into GDS code.
One of the possible sources of systematic error in the sensing function model is using a single-pole TF to approximate IFO response.
Some of the parameters of the actuation functions were estimated without taking into account an analog AI filter (one of the issues listed above). We need to revisit ER8/O1 actuation function analysis results.
A comparison script, an updated DARM model script and DARM paramter files were committed calibration SVN:
CalSVN/aligocalibration/trunk/Runs/O1/H1/Scripts/DARMOLGTFs/
Plots were committed to:
CalSVN/aligocalibration/trunk/Runs/O1/H1/Results/DARMOLGTFs/
P.S. I'll add references later.
Maddie has confirmed that she has used the matlab model parameter par.t.actuation to inform the high-frequency and time-delay corrections to the output of the CAL-CS pipeline.

This confirms that there is a systematic error in the output of the GDS pipeline output at both observatories -- an extra IOP (65 [kHz]) clock cycle, 15 [us] delay on the actuation path, which results in a ~0.5 [deg] phase mismatch between the reconstructed and true actuation and sensing paths at 100 [Hz]. This is small effect, but given our dwindling person-power, and continued pressure to have been done yesterday, we will not quantitatively assess the impact this has on systematic errors. We will instead, merely update the GDS pipeline to use the correct actuation delay (hopefully next Tuesday), and use that as our stopping point for when we stop re-calibrating prior data.
Elli and Stefan showed in aLOG 20827 that the signals measured by AS 36 WFS for SRM and BS alignment appeared to be strongly dependent on the power circulating in the interferometer. This was apparently not seen to be the case in L1. As a result, I've been looking at the AS 36 sensing with a Finesse model (L1300231), to see if this variability is reproducible in simulation, and also to see what other IFO variables can affect this variability.
In the past when looking for differences between L1 and H1 length sensing (for the SRC in particular), the mode matching of the SRC has come up as a likely candidate. This is mainly because of the relatively large uncertainties in the SR3 mirror RoC combined with the strong dependence of the SRC mode on the SR3 RoC. I thought this would therefore be a good place to start when looking at the alignment sensors at the AS port. I don't expect the SR3 RoC to be very dependent on IFO power, but having a larger SR3 RoC offset (or one in a particular direction) may increase the dependence of the AS WFS signals on the ITM thermal lenses (which are the main IFO variables we typically expect to change with IFO power). This might therefore explain why H1 sees a bigger change in the ASC signals than L1 as the IFOs heat up.
My first step was to observe the change in AS 36 WFS signals as a function of SR3 RoC. The results for the two DOFs shown in aLOG 20827 (MICH = BS, SRC2 = SRM) are shown in the attached plots. I did not spend much time adjusting Gouy phases or demod phases at the WFS in order to match the experiment, but I did make sure that the Gouy phase difference between WFSA and WFSB was 90deg at the nominal SR3 RoC. In the attached plots we can see that the AS 36 WFS signals are definitely changing with SR3 RoC, in some cases even changing sign (e.g. SRM Yaw to ASA36I/Q and SRM Pitch to ASA36I/Q). It's difficult at this stage to compare very closely with the experimental data shown in aLOG 20827, but at least we can say that from model it's not unexpected that these ASC sensing matrix elements are changing with some IFO mode mismatches. The same plots are available for all alignment DOFs, but that's 22 in total so I'm sparing you all the ones which weren't measured during IFO warm up.
The next step will be to look at the dependence of the same ASC matrix elements on common ITM thermal lens values, for a few different SR3 RoC offsets. This is where we might be able to see something that explains the difference between L1 and H1 in this respect. (Of course, there may be other effects which contribute here, such as differential ITM lensing, spot position offsets on the WFS, drifting of uncontrolled DOFs when the IFO heats up... but we have to start somewhere).
Can you add a plot of the amplitude and phase of 36MHz signal that is common to all four quadrants when there's no misalignment?
As requested, here are plots of the 36MHz signal that is common to all quadrants at the ASWFSA and ASWFSB locations in the simulation. I also checked whether the "sidebands on sidebands" from the series modulation at the EOM had any influence on the signal that shows up here: apparently it does not make a difference beyond the ~100ppm level.
At Daniel's suggestion, I adjusted the overall WFS phases so that the 36MHz bias signal shows up only in the I-phase channels. This was done just by adding the phase shown in the plots in the previous comment to both I and Q detectors in the simulation. I've attached the ASWFS sensing matrix elements for MICH (BS) and SRC2 (SRM) again here with the new demod phase basis.
**EDIT** When I reran the code to output the sensitivities to WFS spot position (see below) I also output the MICH (BS) and SRC2 (SRM) DOFs again, as well as all the other ASC DOFs. Motivated by some discussion with Keita about why PIT and YAW looked so different, I checked again how different they were. In the outputs from the re-run, PIT and YAW don't look so different now (see attached files with "phased" suffix, now also including SRC1 (SR2) actuation). The PIT plots are the same as previously, but the YAW plots are different to previous and now agree better with PIT plots.
I suspect that the reason for the earlier difference had something to do with the demod phases not having been adjusted from default for YAW signals, but I wasn't yet able to recreate the error. Another possibility is that I just uploaded old plots with the same names by mistake.
To clarify the point of adjusting the WFS demod phases like this, I also added four new alignment DOFs corresponding to spot position on WFSA and WFSB, in ptich and yaw directions. This was done by dithering a steering mirror in the path just before each WFS, and double demodulating at the 36MHz frequency (in I and Q) and then at the dither frequency. The attached plots show what you would expect to see: In each DOF the sensitivity to spot position is all in the I quadrature (first-order sensitivity to spot position due to the 36MHz bias). Naturally, WFSA spot position doesn't show up at WFSB and vice versa, and yaw position doesn't show up in the WFS pitch signal and vice versa.
For completeness, the yaxis is in units of W/rad tilt of the steering mirror that is being dithered. For WFSA the steering mirror is 0.1m from the WFSA location, and for WFSB the steering mirror is 0.2878m from the WFSB location. We can convert the axes to W/mm spot position or similar from this information, or into W/beam_radius using the fact that the beam spot sizes are at 567µm at WFSA and 146µm at WFSB.
As shown above the 36MHz WFS are sensitive in one quadrature to spot position, due to the constant presence of a 36MHz signal at the WFS. This fact, combined with the possibility of poor spot centering on the WFS due to the effects of "junk" carrier light, is a potential cause of badness in the 36MHz AS WFS loops. Daniel and Keita were interested to know if the spot centering could be improved by using some kind of RF QPD that balances either the 18MHz (or 90MHz) RF signals between quadrants to effectively center the 9MHz (or 45MHz) sideband field, instead of the time averaged sum of all fields (DC centering) that is sensitive to junk carrier light. In Daniel's words, you can think of this as kind of an "RF optical lever".
This brought up the question of which sideband field's spot postion at the WFS changes most when either the BS, SR2 or SRM are actuated.
To answer that question, I:
Some observations from the plots:
I looked again at some of the 2f WFS signals, this time with a linear sweep over alignment offsets rather than a dither transfer function. I attached the results here, with detectors being phased to have the constant signal always in I quadrature. As noted before by Daniel, AS18Q looks like a good signal for MICH sensing, as it is pretty insensitive to beam spot position on the WFS. Since I was looking at larger alignment offsets, I included higher-order modes up to order 6 in the calculation, and all length DOFs were locked. This was for zero SR3 RoC offset, so mode matching is optimal.


