In this morning, I checked the OMC DCPD electronics chain (for both A and B) by injecting known sine wave analog signal. This was one of those items that Keita suggested me a while ago.
According to the data, I am concluding that our calibration model needs to add another pole at 10-ish kHz for accurately simulating the OMC whitening circuits.
Method
The measurement method is straightforward -- it is a swept sine measurement in a manual way.
I had a function generator by the HAM6 electronics rack which drove a single-ended-to-differential convertor (D1000931, technically speaking this is a coil driver test box). Then the differential signal is sent to the input of the OMC DCPD whitening board (D1002559, S1101603) by some clipping technique. By the way, the actual cable for connecting the OMC DCPDs were unplugged during the measurement. The excitation amplitude was set to 2 Vp-p at the function generator which resulted in 2 Vp-p in both positive and negative paths at the input of the whitening board as expected accroding to the schematic of the coil driver test box.
I then recorded the data in IOP at the full sample rate using dataviewer for 1 sec for a selected excitation frequency (and for some reason, diaggui did not want to run and hence dataviewer this time). Keeping the same excitation amplitude, I manually stepped the freqyency from 8 kHz to 100 Hz. After every step, I saved the time series of the IOP so that I can make a transfer function later. In addition, I had an oscilloscope with me which kept monitoring the excitation ampitude at the input of the whitening board. The scope told me that the excitation ampltude stayed constant at 2.02 Vp-p in each channel throughtout the measurement. The OMC DCPD had
Analysis and result
To get a transfer function from the data that I took in time series, I decided to do a sine-wave fitting for each data chunk to get the amplitude information. I wrote a small matlab script to do it. It can be found at:
aligocalibration/trunk/Runs/ER8/H1/Scripts/OMCDCPDs/Matlab/OMC_DCPD_AnalogChain_TimeSeries.m
The script utilizes fminsearch and spits out the best fit amplitude for each frequency measurement. Additionally, it places uncertainty or error bar by taking the standard deviation of the residual. Note that this is not a standard way to place an error bar since it does not take the number of measurement points into consideration. According to the fit, the residuals were found to be usually a few counts which is much smaller than the amplitude of signals which was about 2000 counts. So it typically places 0.1% uncertainty after all.
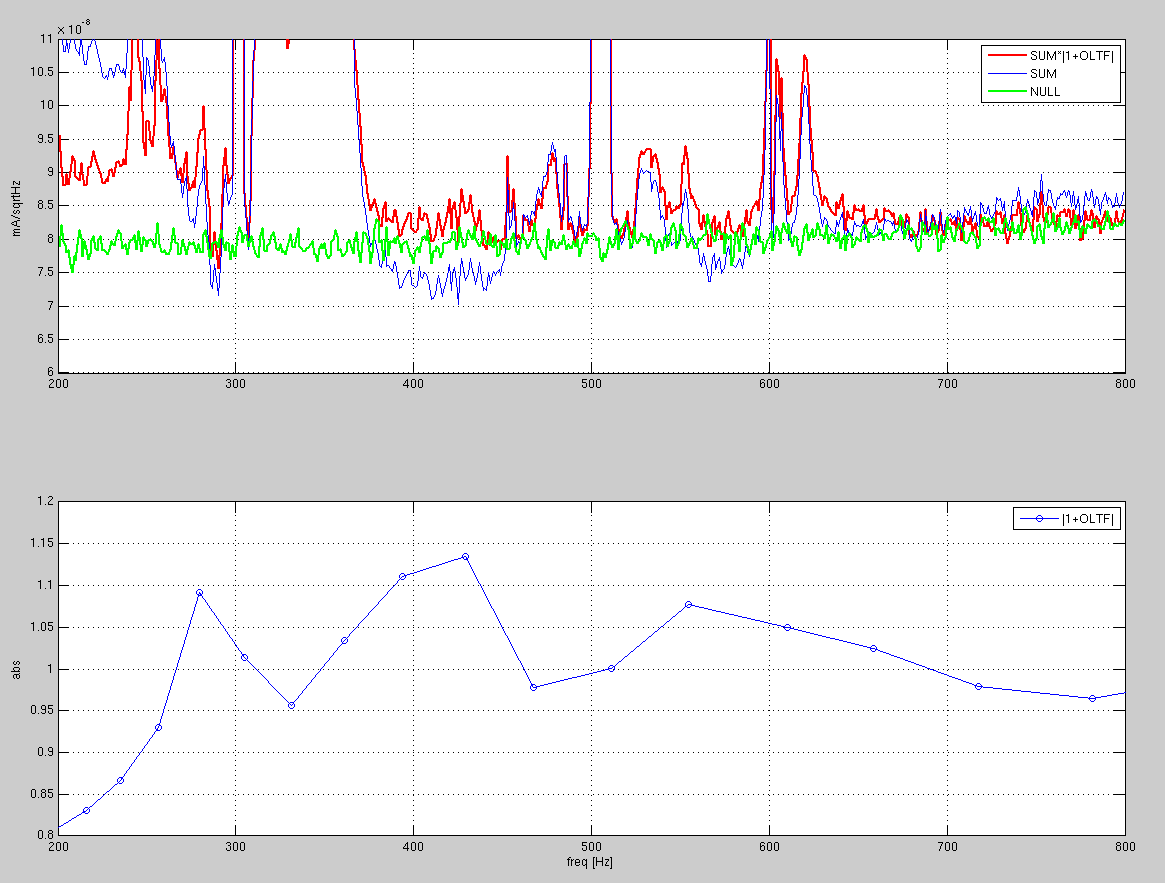
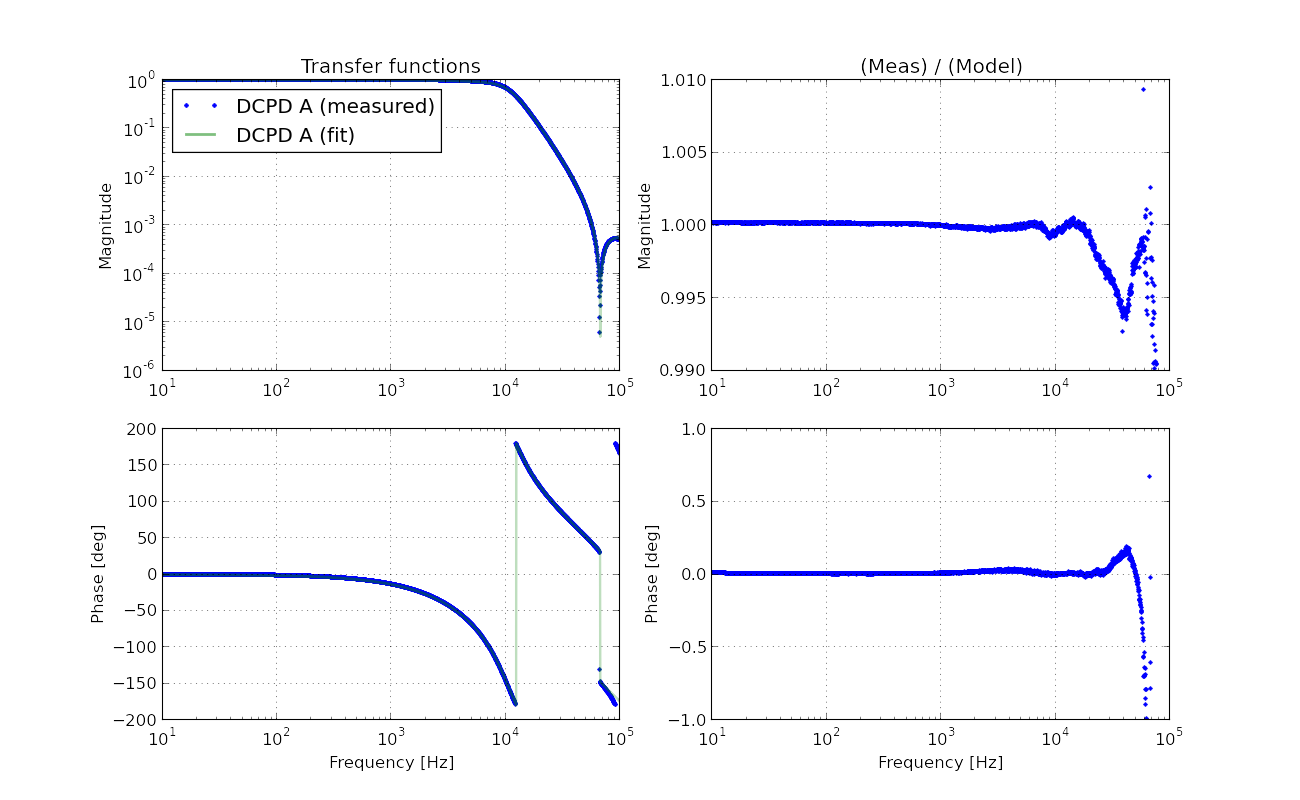
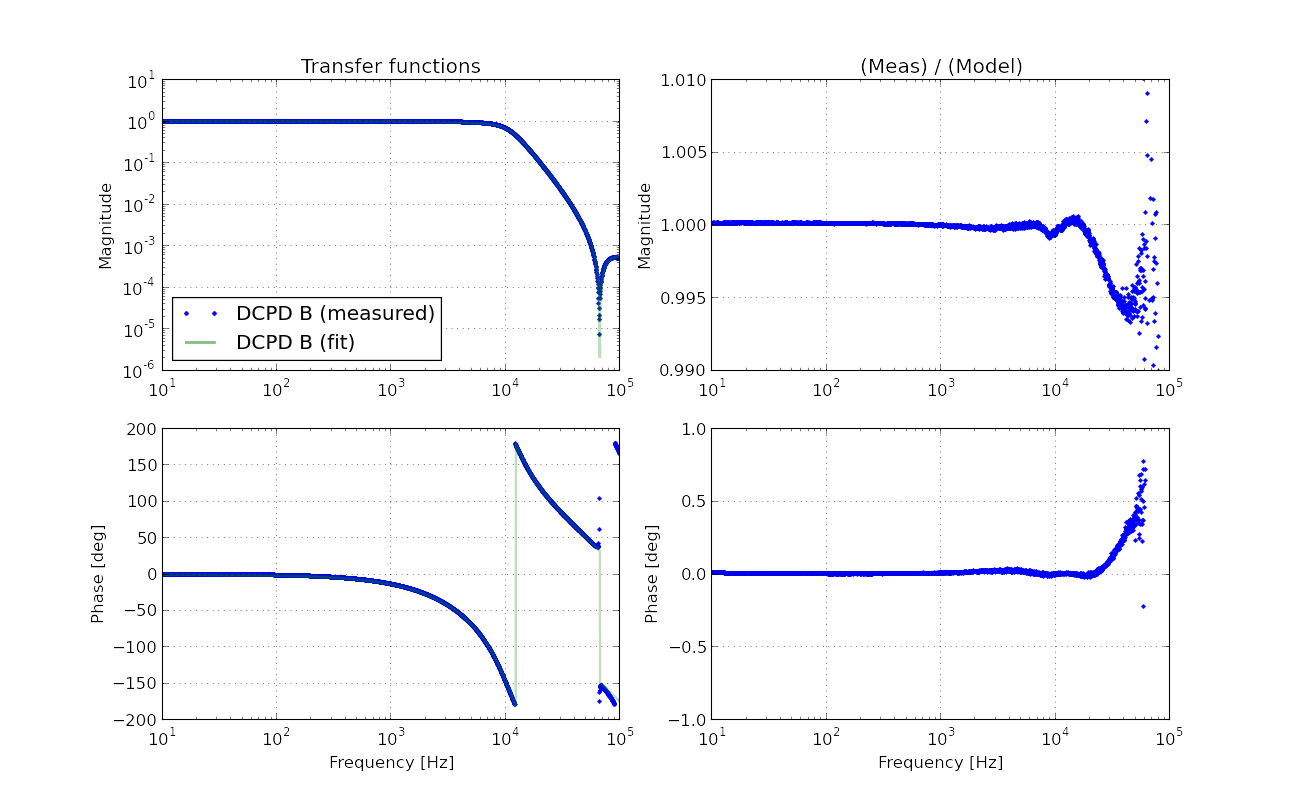
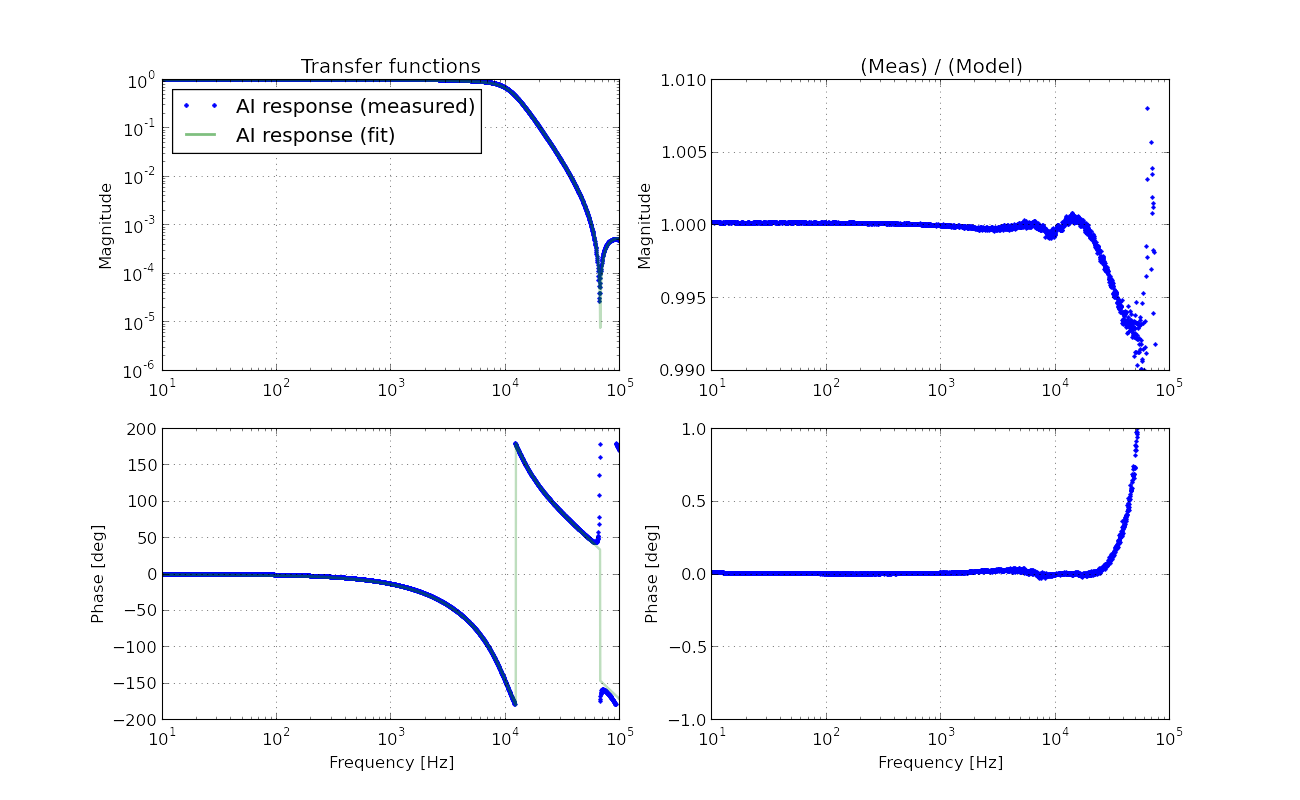
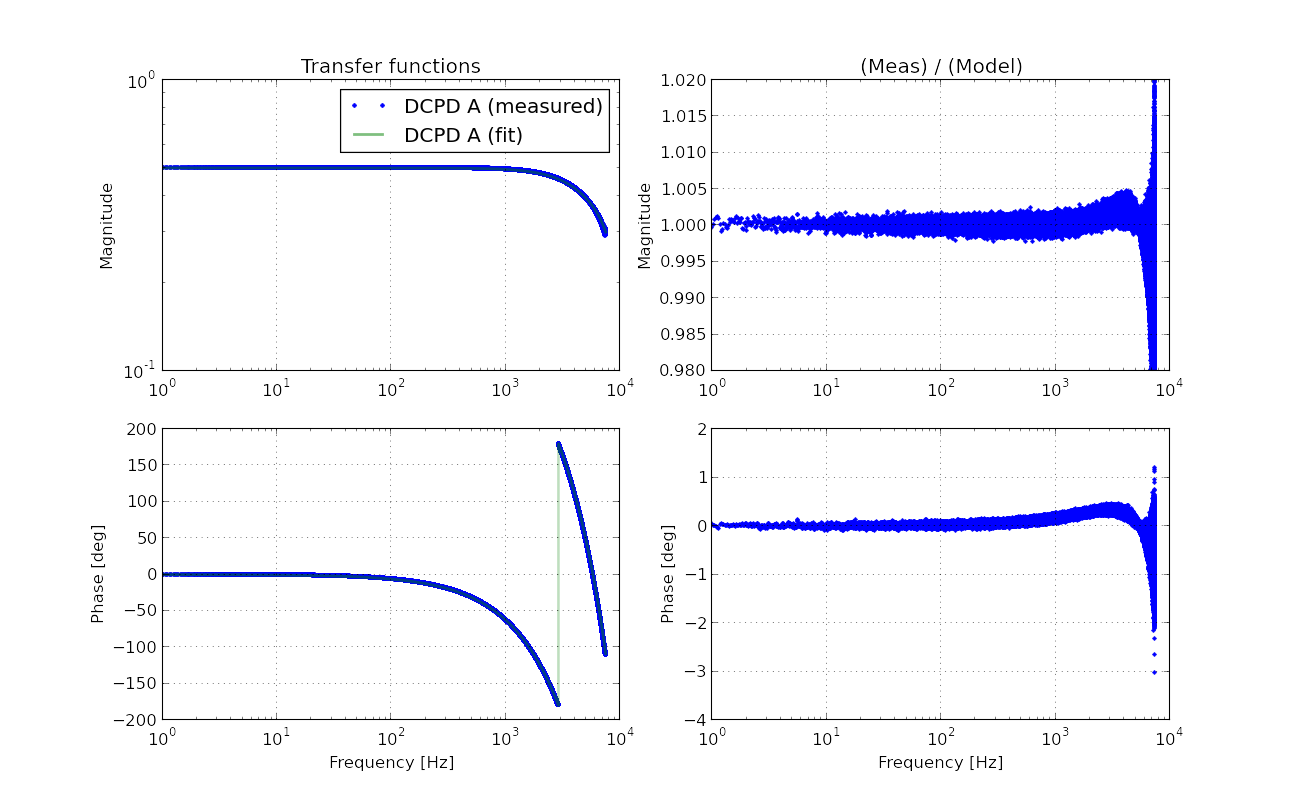
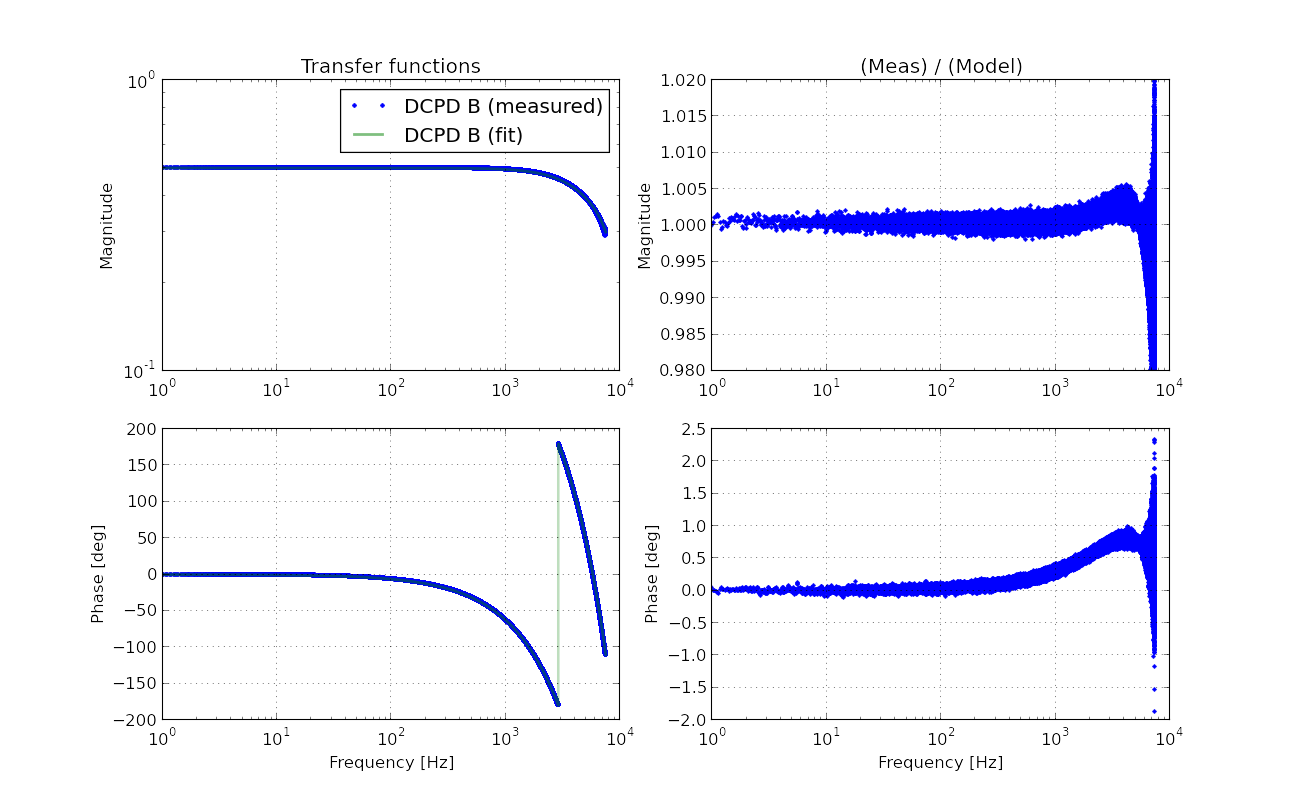
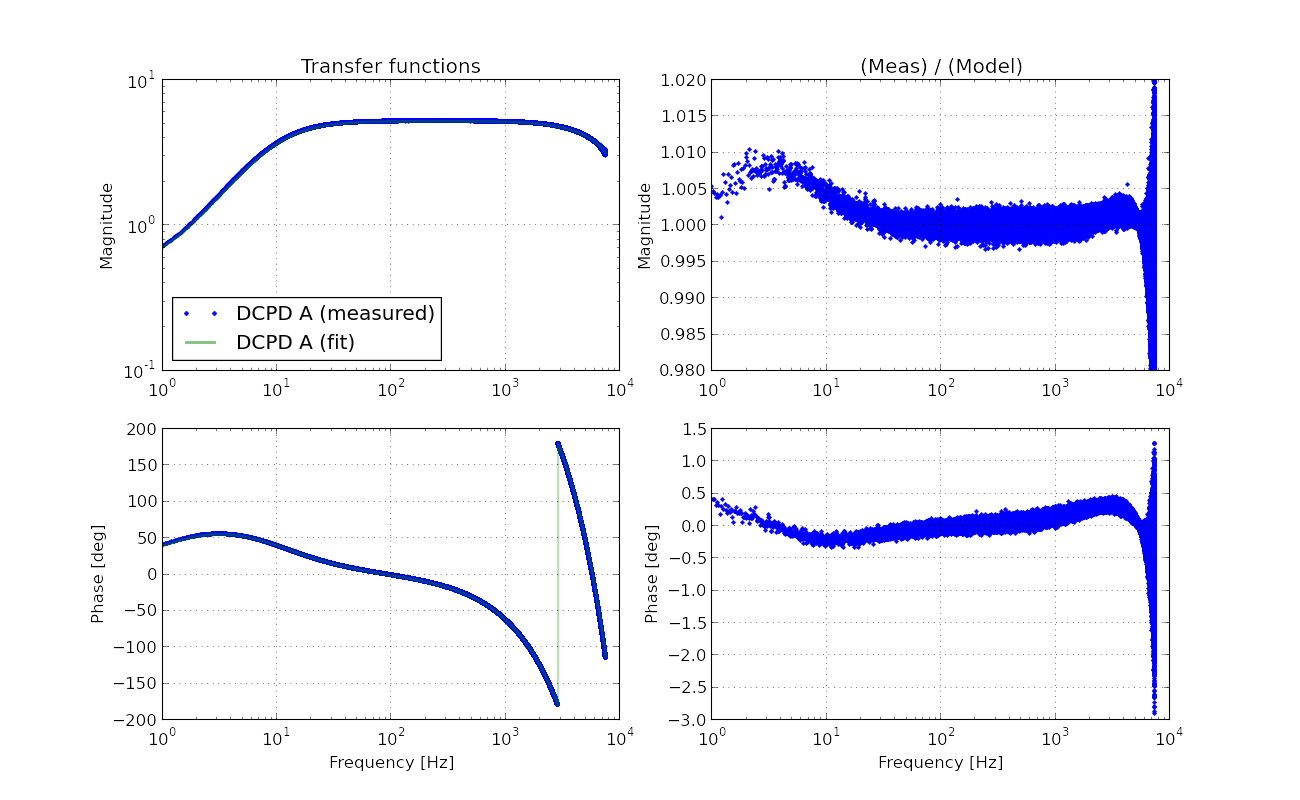
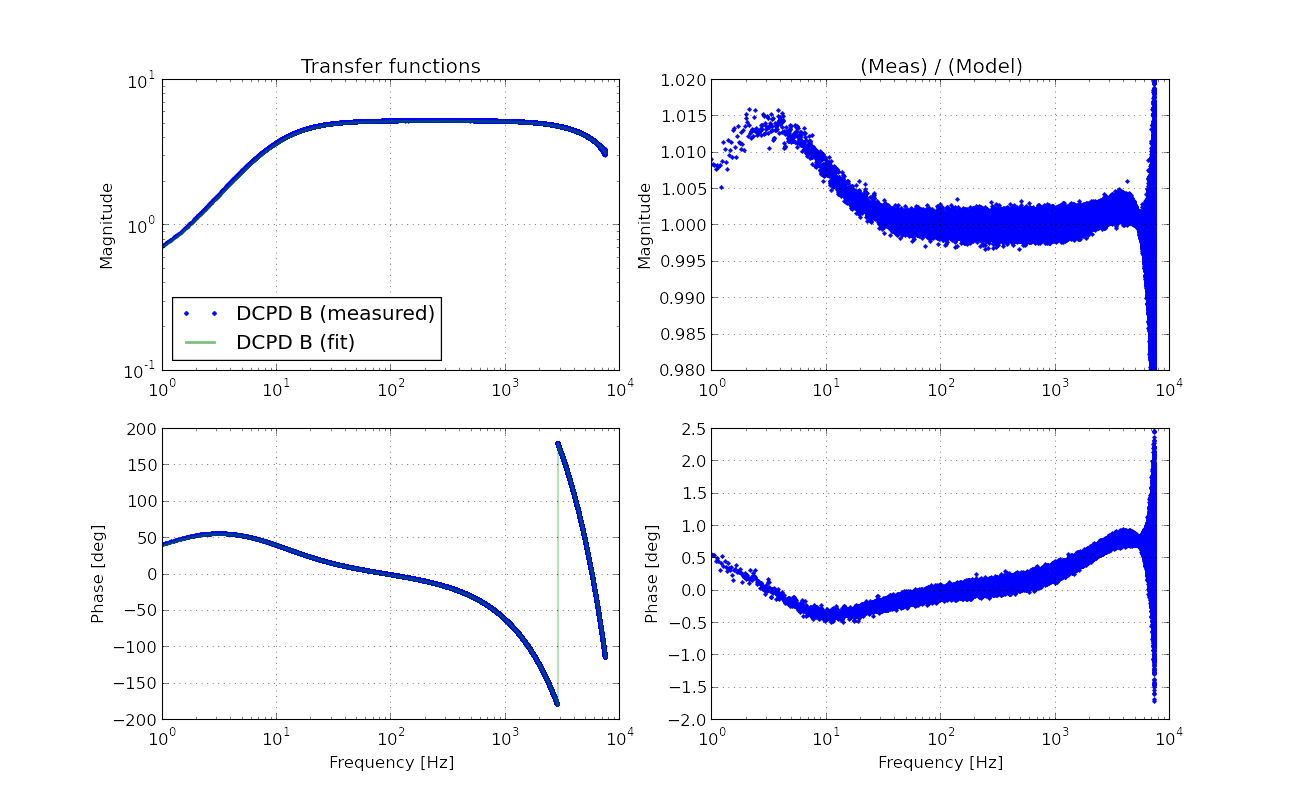
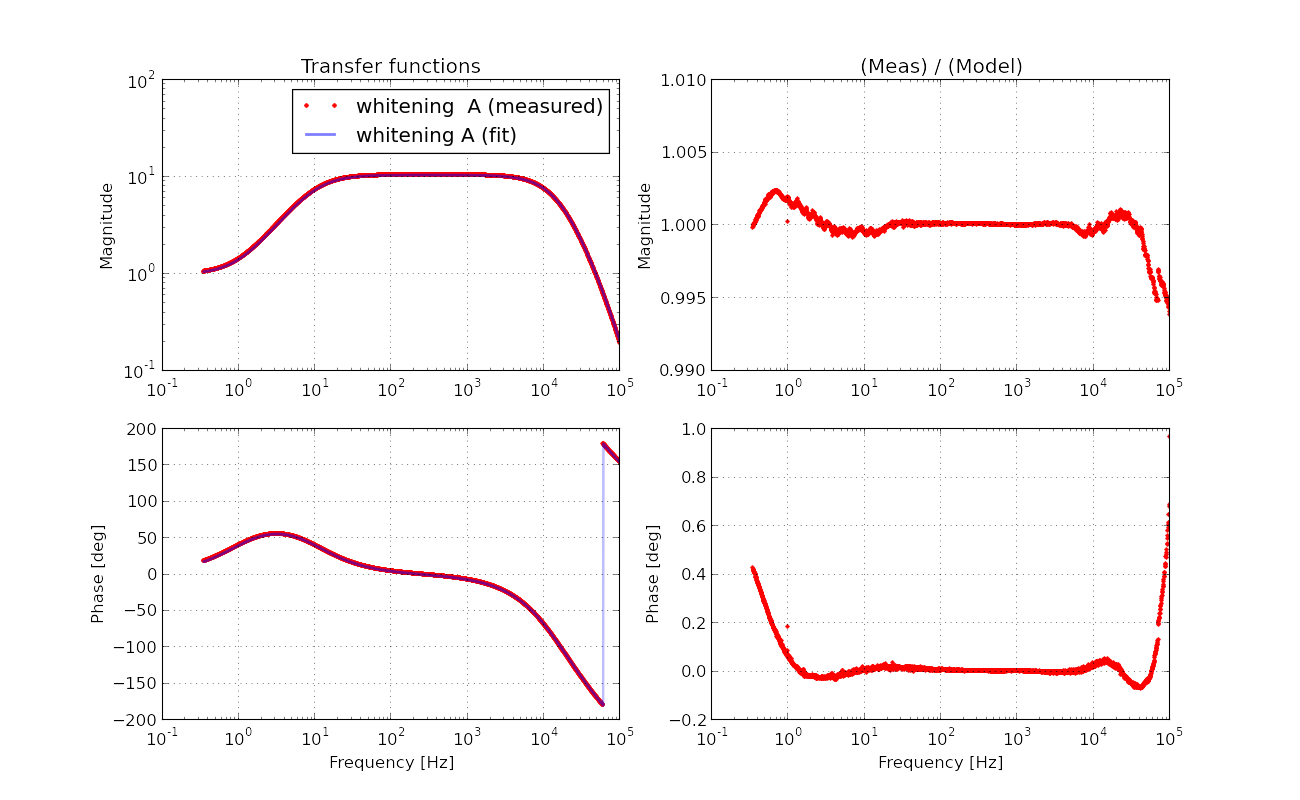
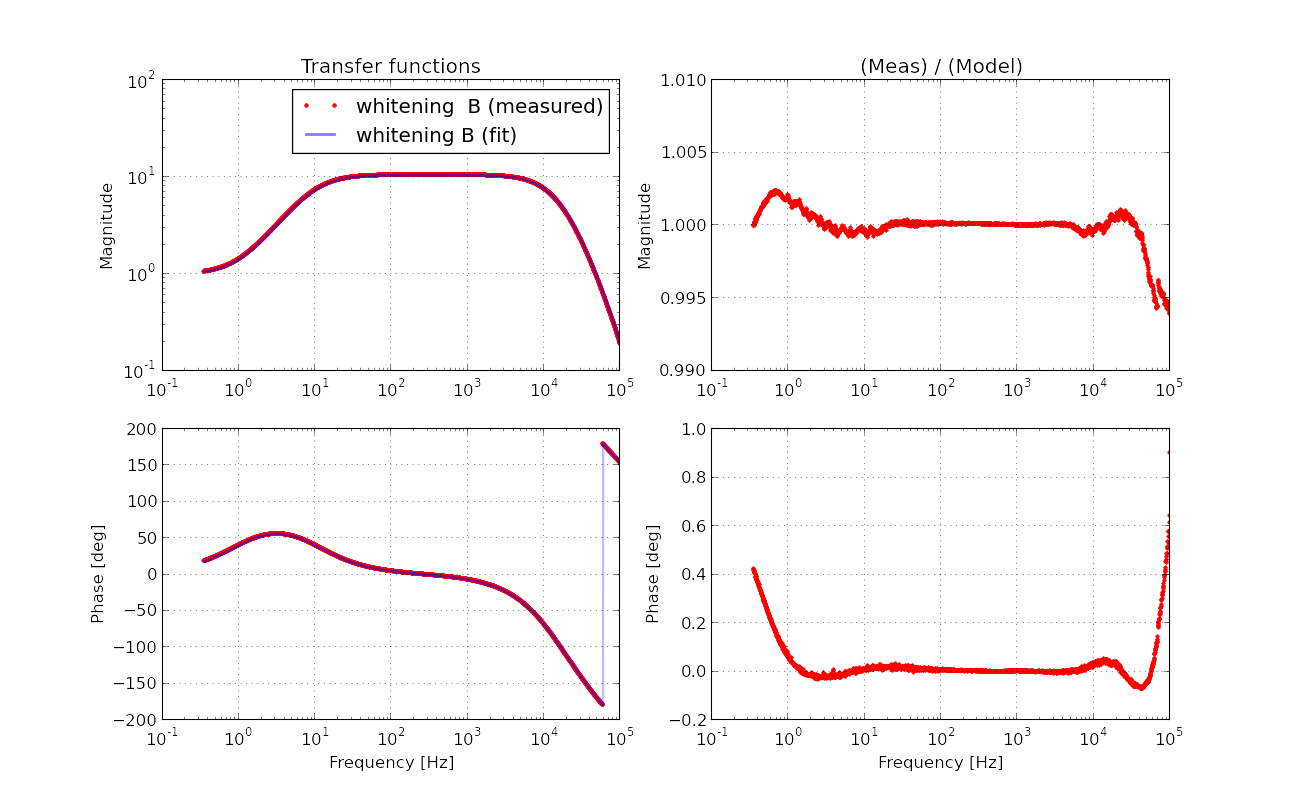
The result is shown in the attached pdf. By the way the lower panel in the plot says, "residual", but it should read "(measured)/(model)" instead. It shows the measured transfer function together with the expected model transfer function for comparison. It is very obvious that the measurement suggests that our model is missing some high frequency pole. The model is merely made of the analog AA response which I have already measured and fitted. Adding some random pole, I could see an extra pole at around 10.7 kHz making the fitting much better. In fact, I sort of knew that there seemed to be a high frequency pole by some other measurements which I did not post. We probably need to add this high frequency pole in our calibration model.


 .
.
I've attached the result.
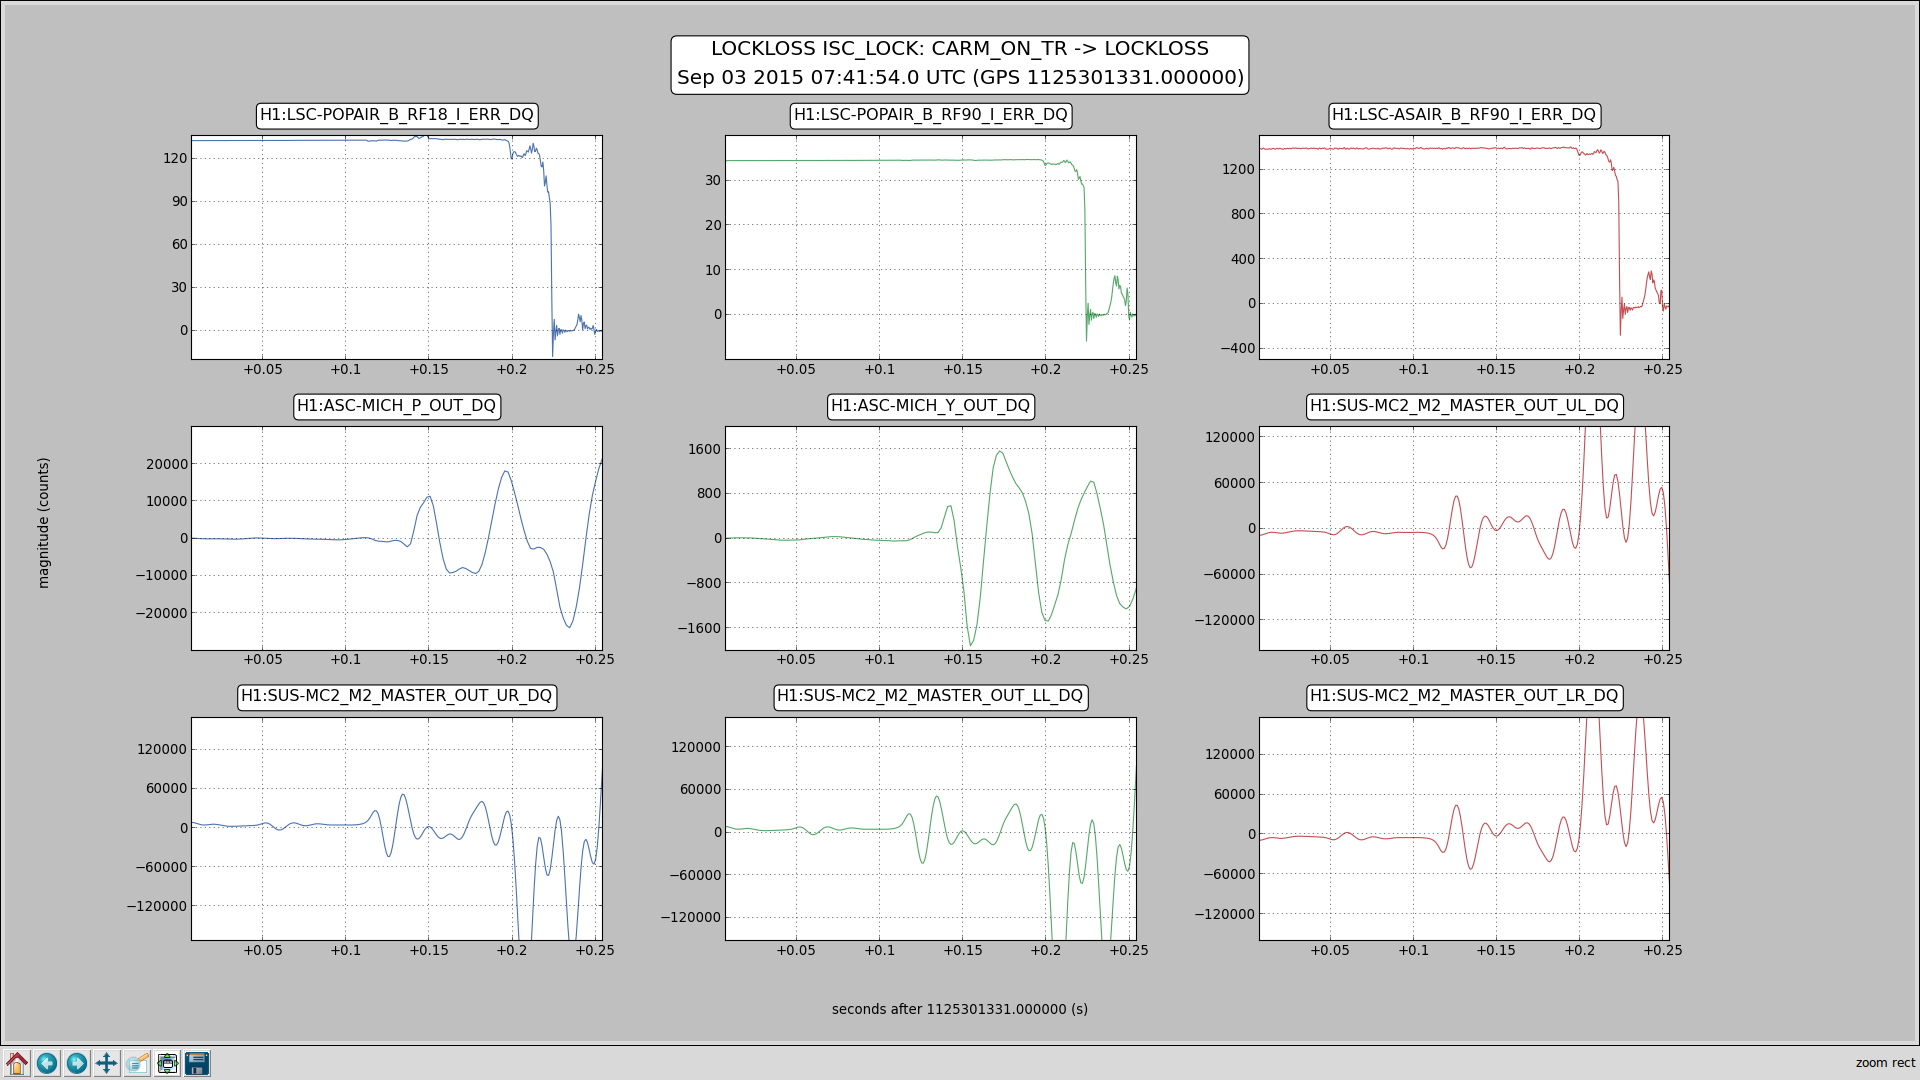
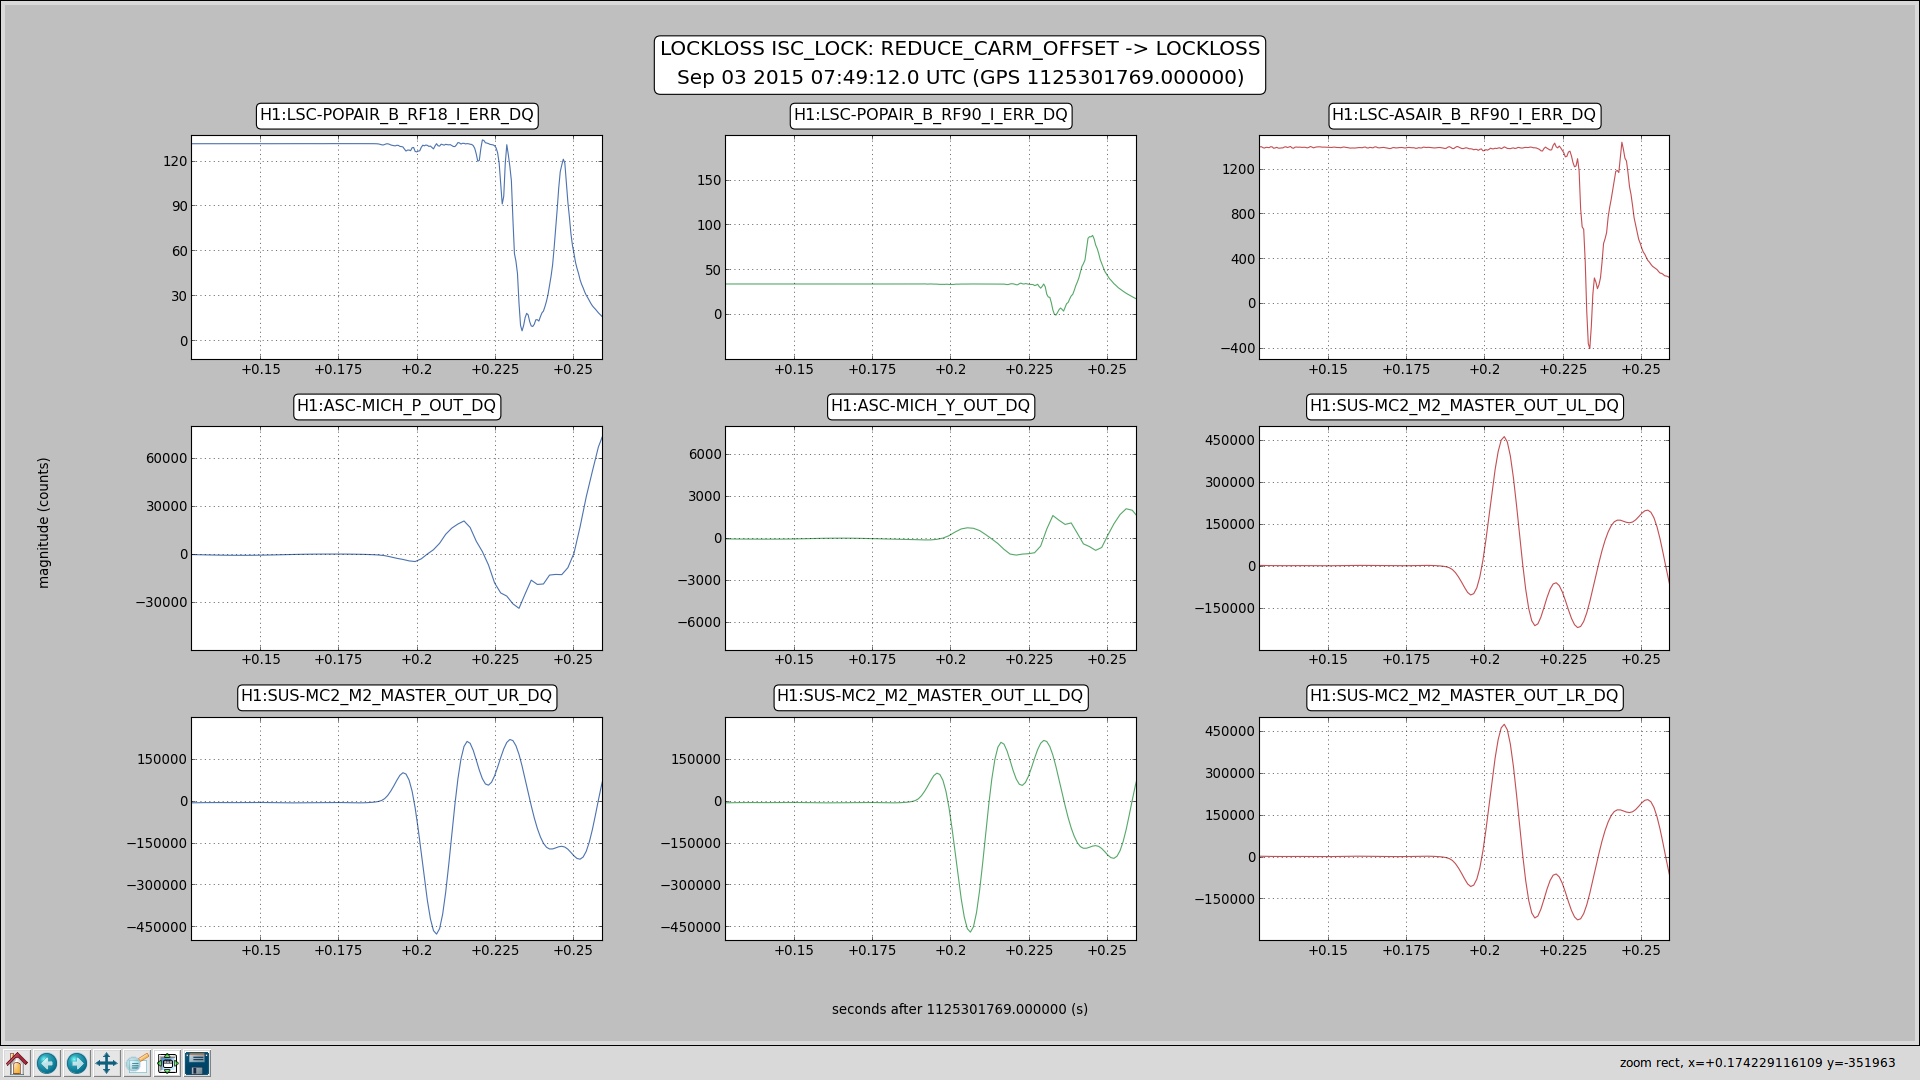
Quick conclusion: Dropping large super ball and people jumping in control room coupled into DARM.
In case people wonder what's the super ball looks like, I've attached a photo as well.
No more super ball during observing run =(