sheila.dwyer@LIGO.ORG - posted 17:25, Tuesday 11 August 2015 (20447)
offloading full lock ASC
We made a state a week or so ago that offloads the ASC in full lock to the alingment sliders. This offloads the top mass of every optic that we control with ASC (except PR3) to the alignment sliders. We are not offloading PR3 since it moves so much due to wire heating.
We've tried this a few times and it works and we are able to relock afterwards, so I've added it to the main guardian path, ater the transition to DC readout.


CDS overview is nice and green. The only red we expect are the TIM bits on the ETM Quad Suspension models now they are running on slower computers (a rate of about four per day is anticipated). We are investigating offloading the violin mode monitors from these models to resolve this.
I have updated the RCG Versions MEDM screen, all models are running RCG SVN version 4054 (2.9.6)
Dave mentioned to me if you notice a red TIM error on the ETM models (i.e. H1SUSEY [EX]), click the button for the offending ETM (i.e. H1SUSETMX_GDS_TP.adl). Here you will notice a red CPU Max value. To clear this, hit the Diag Reset button on the upper right of the window (under the GPS time).
I did this for ETMx at around 6:50utc (23:50pt).
model restarts logged for Tue 11/Aug/2015
2015_08_11 08:37 h1calcs
2015_08_11 08:57 h1iopsusex
2015_08_11 08:57 h1susetmx
2015_08_11 08:57 h1susetmxpi
2015_08_11 08:57 h1sustmsx
2015_08_11 09:00 h1alsex
2015_08_11 09:00 h1calex
2015_08_11 09:00 h1hpietmx
2015_08_11 09:00 h1iopiscex
2015_08_11 09:00 h1iopseiex
2015_08_11 09:00 h1iscex
2015_08_11 09:00 h1isietmx
2015_08_11 09:00 h1pemex
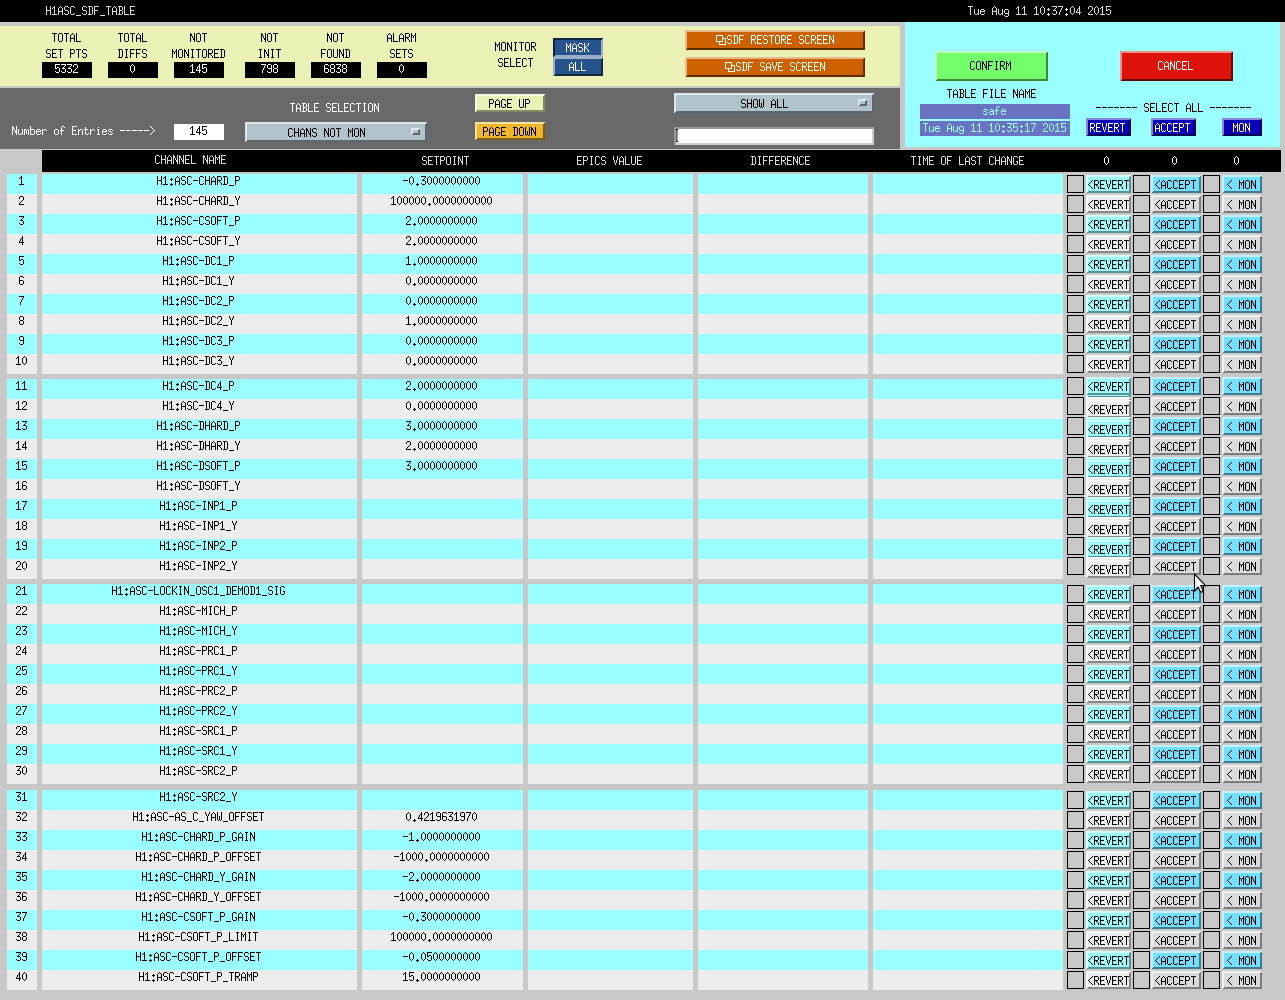
2015_08_11 10:15 h1asc
2015_08_11 12:03 h1tcscs
2015_08_11 12:54 h1broadcast0
2015_08_11 12:54 h1dc0
2015_08_11 12:54 h1fw0
2015_08_11 12:54 h1fw1
2015_08_11 12:54 h1nds0
2015_08_11 12:54 h1nds1
no unexpected restarts. CAL model change, SUS-EX computer swap-out, ASC model change, TCS-CS model change, supporting DAQ restart.