Dan, Jeff, Jenne, Sheila, TJ
As part of the SUS model restarts, safe.snap restores, and other business, some of the TMs were driven with large broadband signals for a short time. This has rung up two of the violin modes which we have, until now, never been able to damp.
Part of the issue with recovery today was due to safe.snap files that had recorded the wrong filter settings for the violin mode damping. When the Guardian turned on the gains, the filters were in the wrong state. This tripped the L2 watchdogs and led to a fun evening of team-building and shared struggle.
We followed Nutsinee's wiki page and restored the correct filters. Most of the modes damped rapidly and we were able to transition to DC readout with one stage of whitening on the DCPDs.
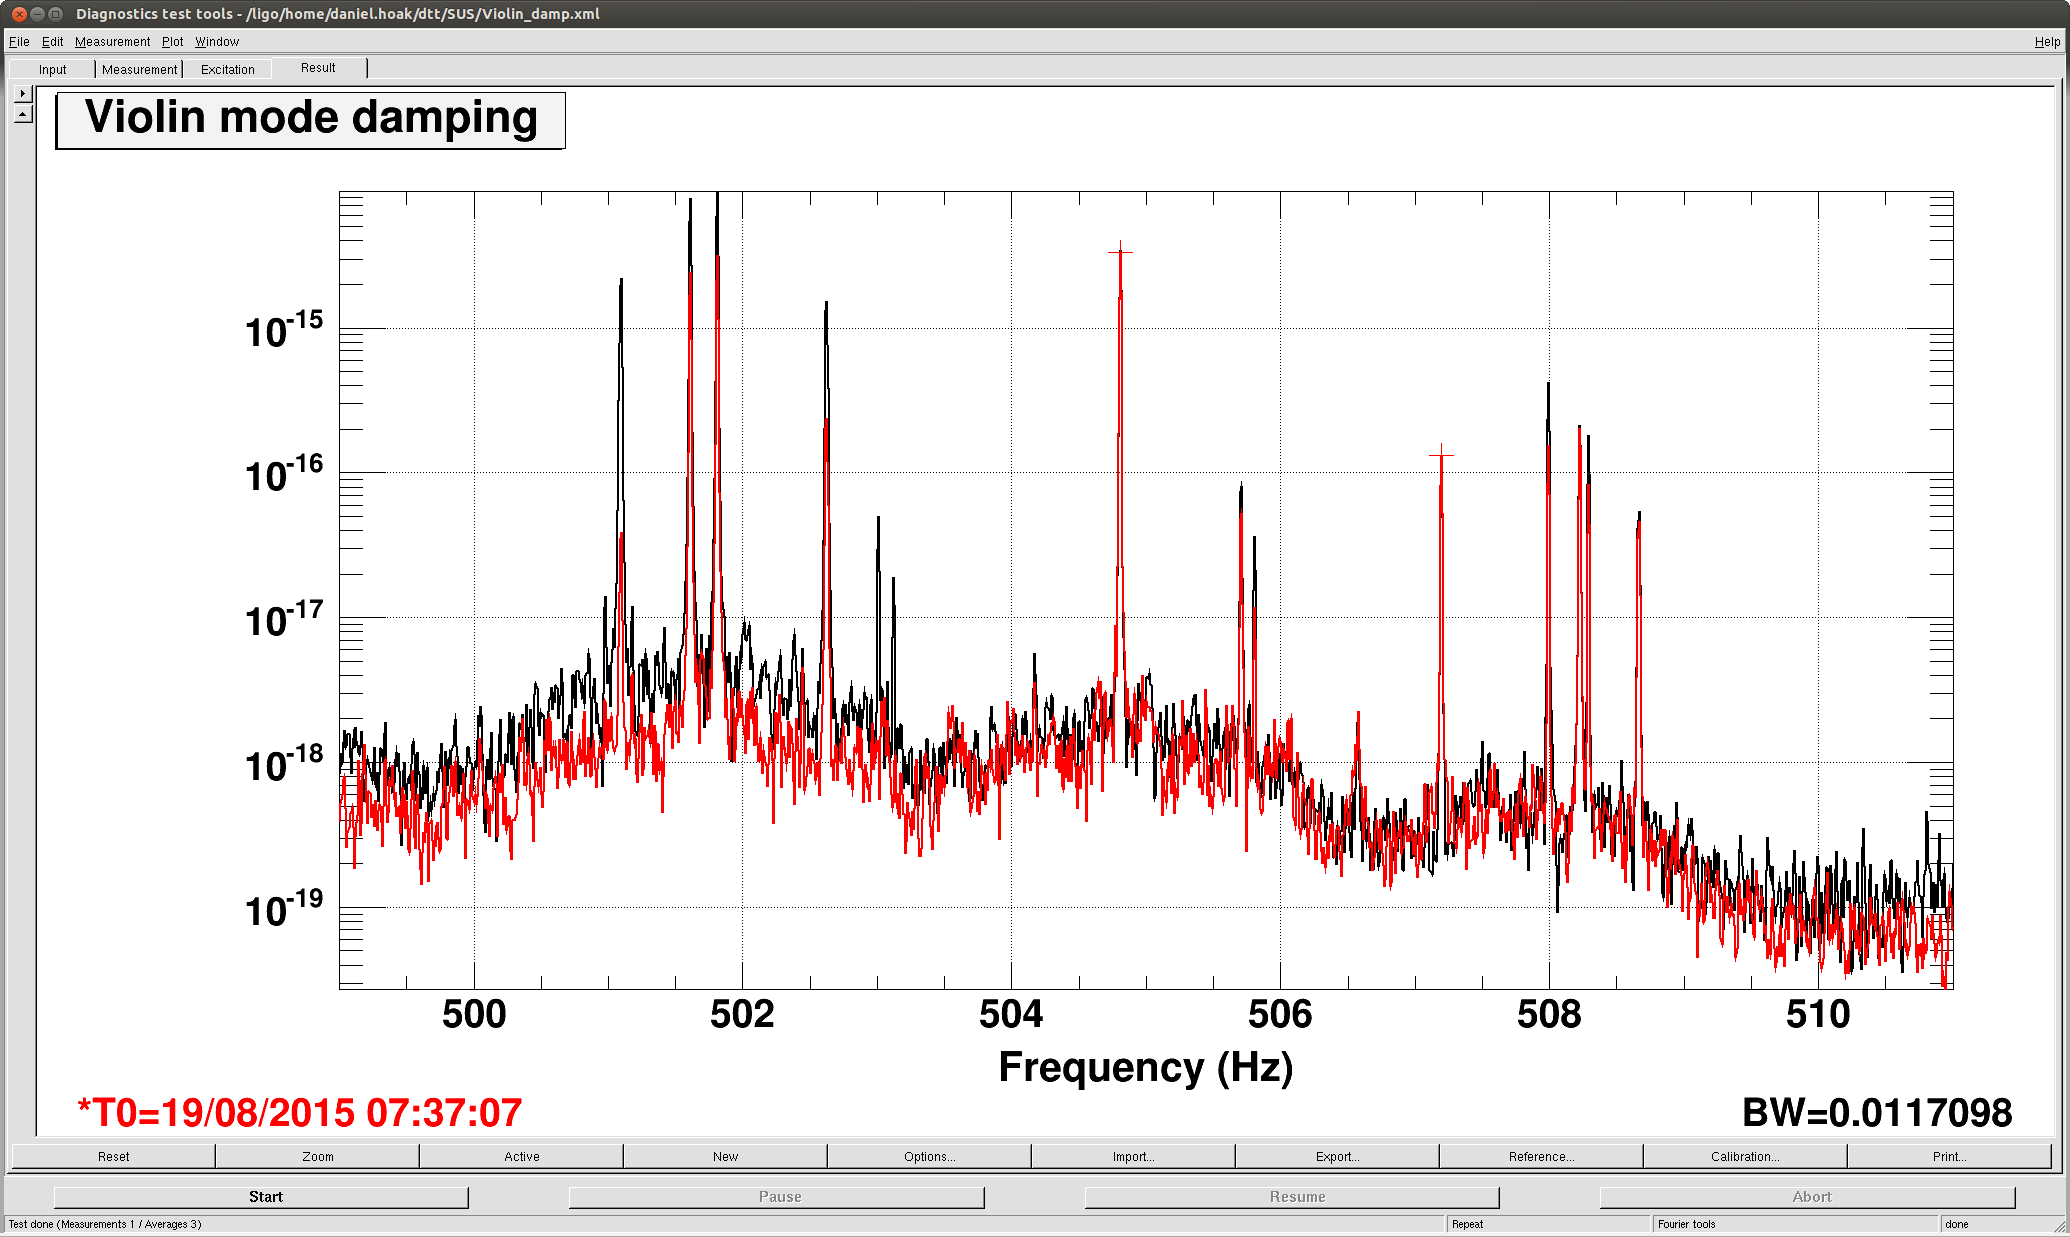
However, the excess drive to the ETMs has excited two modes which we've never been able to damp (and, until today, were small enough that we didn't mind). These are 504.805 and 507.195 Hz. Right now they're not terribly high, but we'll need to damp them if we want to enable a second stage of DCPD whitening. Probably damping these modes will be another painful story like 508.289. Between the two, 504.805 is worse, by a factor of twenty. Based on the accounting of modes so far I think we can be certain this is an ITMY line.
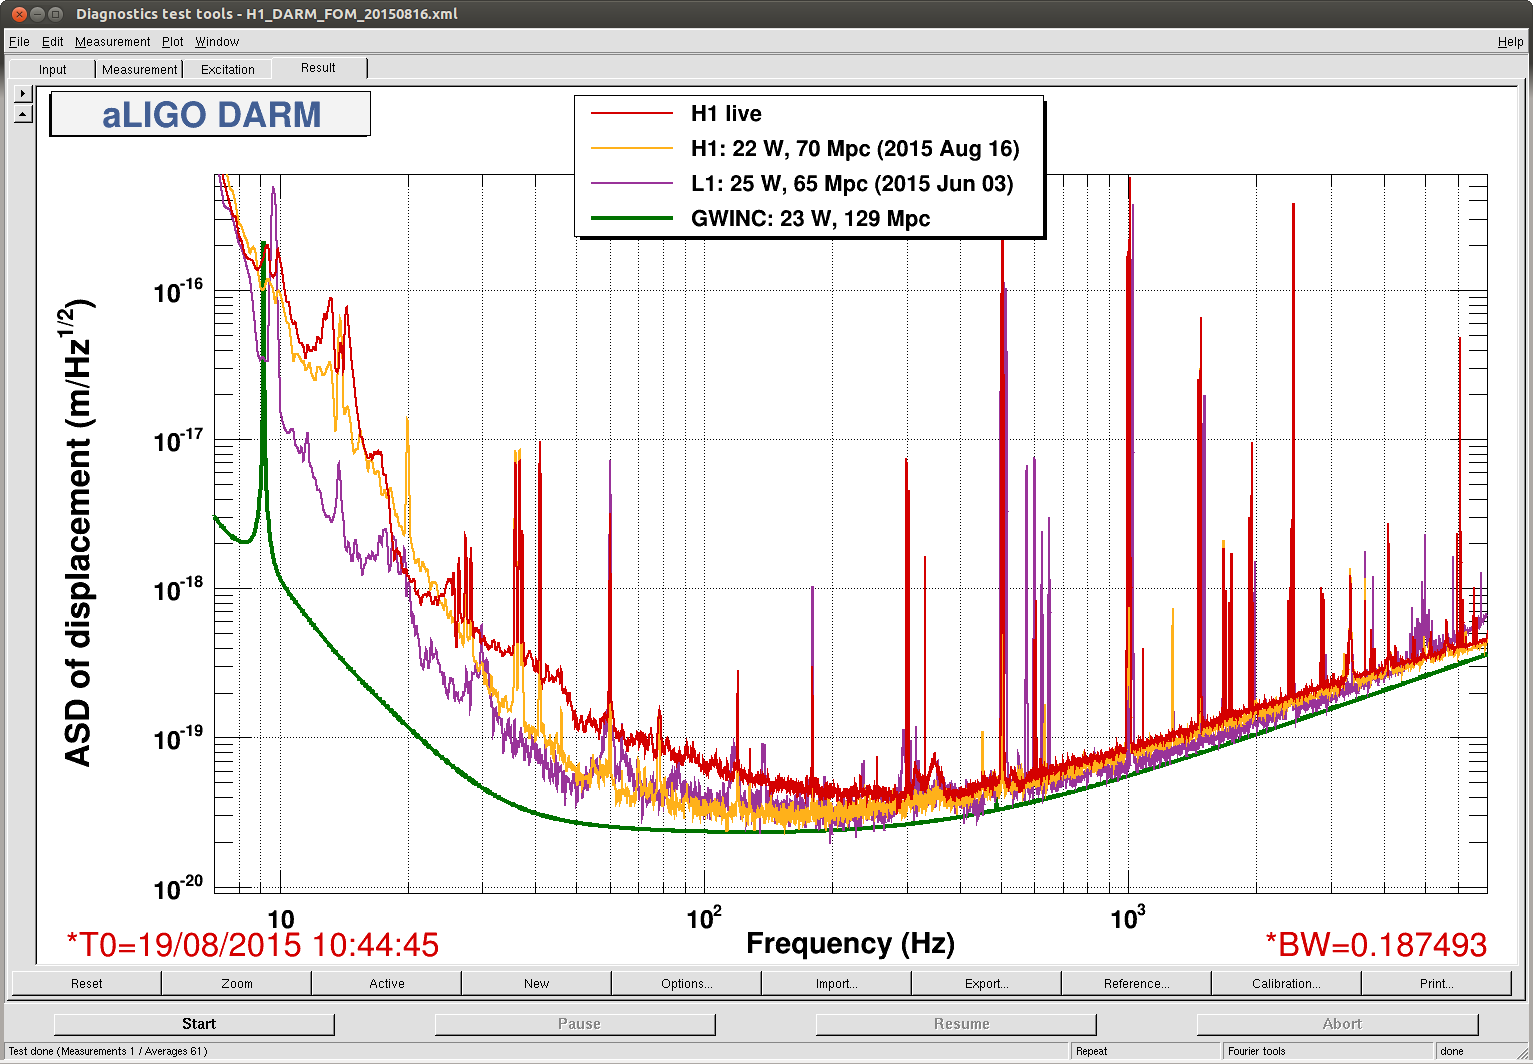
The attached plot shows that, compared to the black reference from earlier today, many of the modes have been damped, except for the two marked by the crosses.
The other two modes which we've not been able to damp, 501.811 and 507.992, are also excited, but these are slowly damping. We'll have to see how they evolve over the next couple of days. I think we can also be sure that 501.881 is an ITMY line.