Summery:
DRMI_1F would not lock until I paused ISC_LOCK and ISC_DRMI
The majority of the morning was spent trying to get past DRMI_1F. What eventally did it was pausing ISC_LOCK and ISC_DRMI.
Overview:
When I arrived this morning, ISC_LOCK was stuck on CARM_ON_TR with a message saying that there was no IR in arms. Sheila had an alog from last night (alog 19821) which mentions this problem and her work around. I switched to manual and reran the PREP_TR_CARM state but that did not fix the problem.
I brought ISC_LOCK to Down and went to redo the green alignment but I couldn't get ALS_YARM to get out of the Unlocked state. To fix this I had to Unmanage ALS_YARM because it would stall and immediately go to the unlocked state.
Relocked green and then tried to lock the whole IFO again.
This time it would not get passed DRMI_1F. The AS_AIR cam looked round but it would not lock. Just incase, I tried slightly tweaking the PRs and SRs but no luck.
Went through IA since I wasn't sure what else to do. All went well there, but I had to take ALS_YARM to unmanged again.
It got through DRMI but lost lock a second time on PREP_TR_CARM. Laser powere was 1.7W , not sure if that was too big a problem.
Round 3. FIND_IR took quite a bit longer than usual but it eventually made it. Got stuck on DRMI_1F, alignment didn't look so good this time, a fair amount of pitch. I touched BS and PR2 and it almost caught a few times but no luck.
I decided to bring it back to Down and get the laser power where it should be. I found home for the rotation stage and then brought it back to 2.3W.
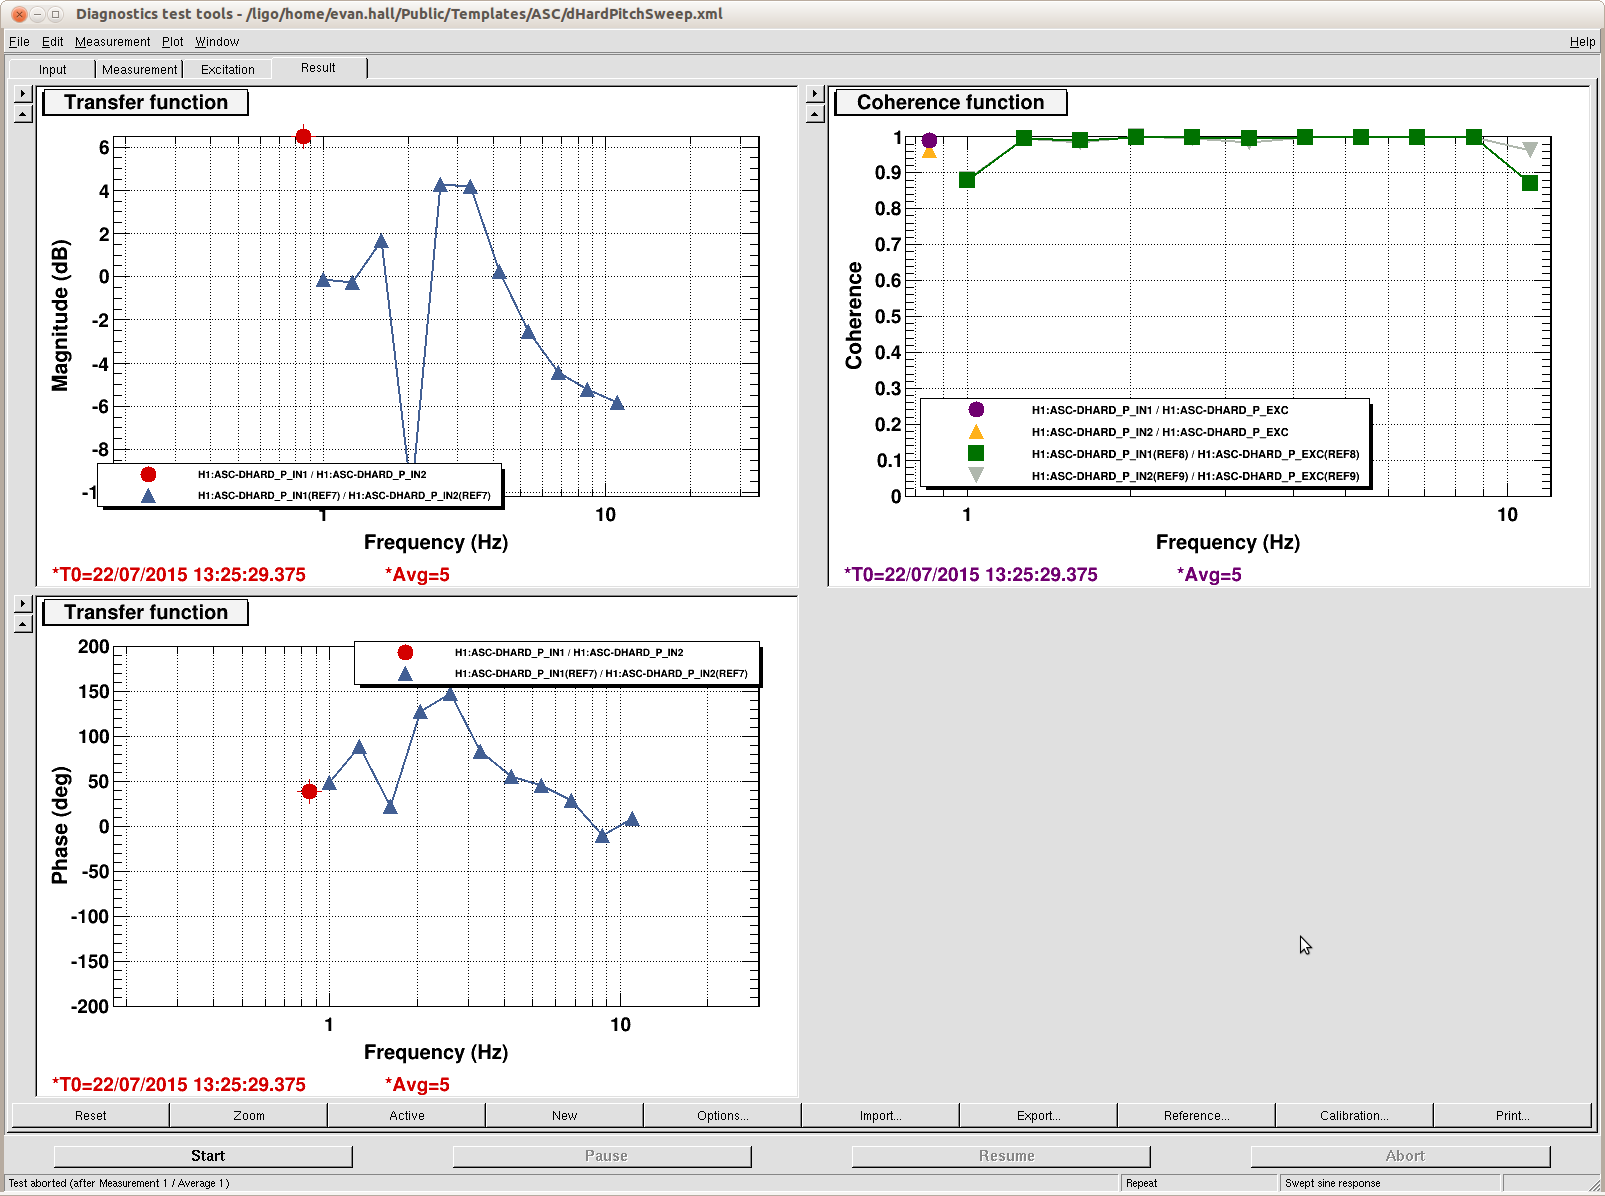
Round 4. FIND_IR taking its time again, but made it. Stuck on DRMI_1F again. The AS_AIR cam looked better than last time and StripTool was showing good flashes, but it wouldn't lock. Ed suggested to Misalign SRM and try to lock as a PRMI. I got it to lock as a PRMI in an odd mode, and I was able to bring the traces for ASAIR RF90 and POPAIR RF18 up. When I tried to realign SRM it broke lock. Ed talked to Kiwamu and found out that since we did not pause the Guaridans this realignment kicked it too hard.
Round 5. Stuck on DRMI_1F again so we went to pause ISC_LOCK and ISC_DRMI so that I could misalign SRM and see if I could get a PRMI again. Soon as I paused these guardians, the ASAIR cam looked like it was locked... because DRMI was locked! ASAIR RF90 and POPAIR RF18 looked good as well. Odd. I unpaused the guardians and it moved right on to DC readout no problem.
Elli said to wait at DC Readout for ~15min to allow the ASC loops to work their magic (paraphrased)
NOMINAL_LOW_NOISE @ 10:22 PST
Kiwamu broke lock loading some new filters and this time, ISC_LOCK went right through DRMI_1F.
NOMINAL_LOW_NOISE @ 11:05 PST