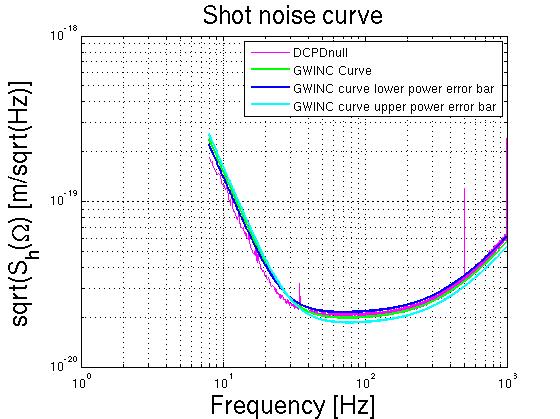
I have been working on putting together a power dudget for Hanford IFO. I have calulcated the power on the beamsplitter using abolute power on vaious photodiodes, and put this into a shot noise curve model. I have compared this to shot curve is measured using DCPD null readout.The shot noise curve is taken from the GWinc model. The parameter file I am using is attached. These files are available in /ligo/home/eleanor.king/PowerBudget.
I calculated the power on the beamsplitter using the TR QPDS (TR_X/Y_QPD_A/B) to determine the power in the arms, and using the POP sensors(POP_A_QPD, POP_B_QPD POP_A_LF). The resuts are summarized in the table below. There is a matlab script with my actual calculations in /ligo/home/eleanor.king/PowerBudget/PowerOnBS. The recycling gain for the TR is larger than that measured with the POP_PDs. If calibrate the POP_A PDs to a single shot, same result. I am assuming the TR QPDs are correct. The resylsing gain calculated by the absolute powers on these PDs agrees with the recycling gain calculated by the relative power change before and after locking using both TR and POP photodiodes.
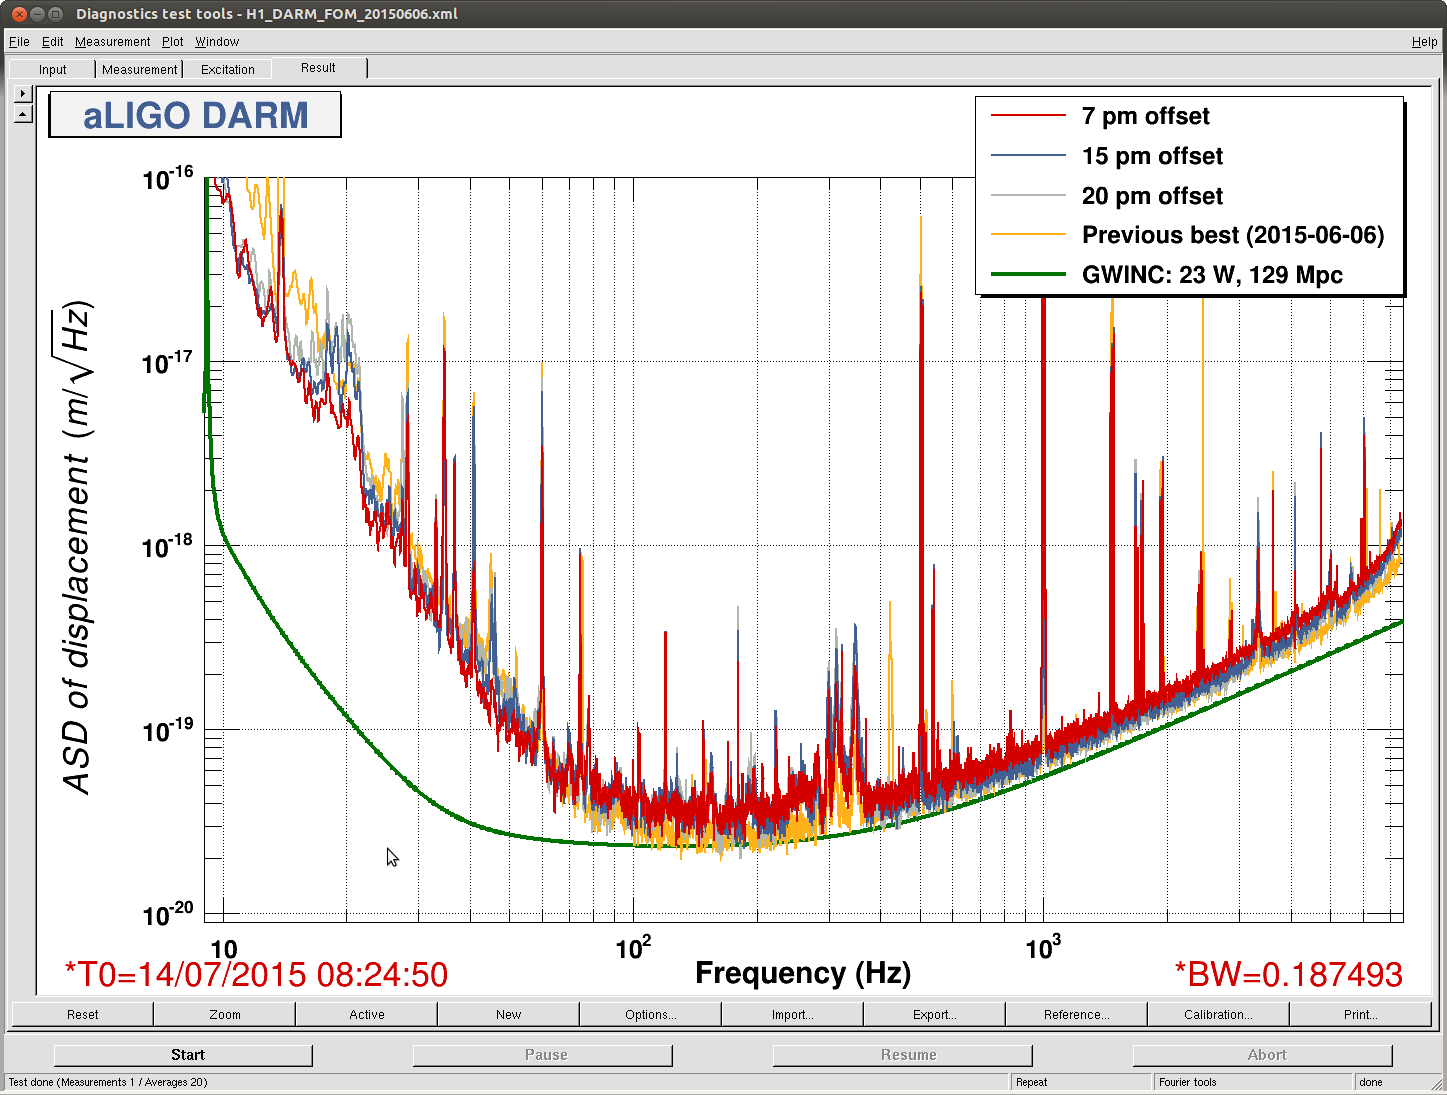
I have taken an average value of all of the TR QPDs, which is 41(+/-15%). I have also included lines showing +/- 1 standard deviation in the plot of the shot noise curve. The photodecetctor quantum effieciency is 85%, and the losses in the arms are 120ppm, measured alog 16579. Next I plan get a better understanding of the mode matching numbers used for generating the shot noise curve. (Mode matching into arms and mode matching into SRC, which is currently assume dto be perfect.)
|
Sensor |
Caculated power on BS [W] |
Calculated
Recycling Gain
15_06_07 0:00:00 UTC
|
|
LSC-POP_A_LF
|
751.3 |
33.6 |
|
ASC-POP_A_QPD
|
723.1 |
32.4 |
|
ASC-POP_B_QPD
|
662.0 |
29.6 |
|
ASC-X_TR_A
|
716.8 |
32.0 |
|
ASC-X_TR_B
|
940.6 |
42.1 |
|
ASC-Y_TR_A
|
963.9 |
43.2 |
|
ASC-Y_TR_B
|
1026.2 |
45.9 |
-------
Additional Comments:
Propagation of arm power to recycling gain:
Assume losses in arms 0f 120ppm, alog 16579.
Recycling gain from power on the beamsplitter:
Pinput=IMC_input_power*0.88*Tprm. (It is power on the beamsplitter that I am calculateing from the photodiodes and putting into the GWINC noise model. But I find it easier to convert from this to recycling gain, and think in terms of recycling gain.
Some comments on the current photodiode calibrations:
POP LSC Photodiodes were calibrated by Kiwamu in alog 13905, based on the transimpedence of this photdiode. [cnts/W] = 0.76 [A/W] x 200 [Ohm] x 216 / 40 [cnts/V]
TR_QPDs and POP_QPD calibrated using Dan's calibration alog 15432. Note the whitening gain changes on these during full lock, so it is important to keep track of the multiple dewhitining filter banks.