kyle.ryan@LIGO.ORG - posted 13:15, Sunday 14 June 2015 (19137)
0900-1315 hrs local -> Prepping end stations for this week's vent activites
1315 hrs. local -> Leaving site now
1315 hrs. local -> Leaving site now
Kyle enterd the X end VEA at 17:00 UTC, according to Gerardo. I set the intent bit to commisioning a few minutes later, but the data should be considered potentially disturbed from 17:00 UTC.
model restarts logged for Sat 13/Jun/2015
no restarts reported
End of Engineering Run 7.
All was quite for my shift after the measurements. The range shows many glitches, but a nice, long lock. Keeping the Intent Bit on Undisturbed until Im told otherwise.
(times in PST)
0:04 - Locked @ LSC_FF, started PCAL swept line measurement
0:29 - PCAL measurment done, started DARM OLGTF measurement
0:50 - Both measurements done and no more for now it seems, Intention Bit set to Undisturbed
The transfer functions that TJ measured for us have been renamed to be more obvious names as follows:
According to trend data, both mesurements seemed to have done at 17 W. The first file currently resides in aligocalibration/trunk/Runs/PreER7/H1/Measurements/DARMOLGTFs. The other one is in aligocalibration/trunk/Runs/ER7/H1/Measurements/PCAL_TRENDS.
By the way, according to what we had in the calibration svn, TJ must have accidently updated Jeff's DARM OL and Pcal Y sweep measurements with the above latest measurements. I restored Jeff's two measurements back to the previous revisions in the svn. So we now have both Jeff's and TJ's measurements checked in the SVN.
There were eight separate locks during this shift, with typical inspiral ranges of 60 - 70 Mpc. Total observation time was 28.2 hours, with the longest continuous stretch 06:15 - 20:00 UTC on June 11. Lock losses were typically deliberate or due to maintenance activities.
The following features were investigated:
1 – Very loud (SNR > 200) glitches
Omicron picks up roughly 5-10 of these per day, coinciding with drops in range to 10 - 30 Mpc. They were not caught by Hveto and appear to all have a common origin due to their characteristic OmegaScan appearance and PCAT classification. Peak frequencies vary typically between 100 - 300 Hz (some up to 1 kHz), but two lines at 183.5 and 225.34 Hz are particularly strong. These glitches were previously thought to be due to beam tube cleaning, and this is supported by the coincidence of cleaning activities and glitches on June 11 at 16:30 UTC. However, they are also occurring in the middle of the night, when there should be no beam cleaning going on. Tentative conclusion: they all have a common origin that is somehow exacerbated by the cleaning team's activities.
2 – Quasi-periodic 60 Hz glitch every 75 min
Omicron picks up an SNR ~ 20 - 30 glitch at 60Hz which seems to happen periodically every 70 - 80 min. Hveto finds that SUS-ETMY_L2_WIT_L_DQ is an extremely efficient (use percentage 80-100%) veto, and that SUS-ETMY_L2_WIT_P_DQ and PEM-EY-MAG-EBAY-SEIRACK-X_DQ are also correlated. This effect is discussed in an alog post from June 6 (link): "the end-Y magnetometers witness EM glitches once every 75 minutes VERY strongly and that these couple into DARM". Due to their regular appearance, it should be possible to predict a good time to visit EY to search for a cause. Robert Schofield is investigating.
3 – Non-stationary noise at 20 - 30Hz
This is visible as a cluster of SNR 10 - 30 glitches at 20 - 30 Hz, which became denser on June 11 and started showing up as short vertical lines in the spectrograms as well. The glitches are not caught by Hveto. Interestingly, they were absent completely from the first lock stretch on June 10, from 00:00 – 05:00 UTC. Daniel Hoak has concluded that this is scattering noise, likely from alignment drives sent to OMC suspension, and plans to reduce the OMC alignment gain by a factor of two to stop this (link to alog).
4 – Broadband spectrogram lines at 310 and 340 Hz
A pair of lines at 310 and 340 Hz are visible in the normalized spectrograms, strongest at the beginning of a lock and decaying over a timescale of ~1 hr as the locked interferometer settles into the nominal alignment state. According to Robert Schofield, these are resonances of the optic support on the PSL periscope. The coupling to DARM changes as the alignment drifts in time (peaks decay beacuse the alignment was tuned to minimize the peaks when the IFO is settled.) Alogs about this: link, link, link.
There are lines of Omicron triggers at these frequencies too, which interestingly are weakest when the spectrogram lines are strongest (probably due to a 'whitening' effect that washes them out when the surrounding noise rises). Robert suspects that the glitches are produced by variations in alignment of the interferometer (changes in coupling to the interferometer making the peaks suddenly bigger or smaller).
5 – Wandering 430 Hz line
Visible in the spectrograms as a thin and noisy line, seen to wander slightly in Fscan. It weakened over the course of the long (14h) lock on June 11. Origin unknown.
6 – h(t) calibration
Especially noisy throughout the shift, with the ASD ratio showing unusually high variance. May be related to odd broadband behavior visible in the spectrogram. Jeff Kissel and calibration group report that nothing changed in the GDS calibration at this time. Cause unknown.
Attached PDF shows some relevant plots.
More details can be found at the DQ shift wiki page.
I believe the 430 Hz wandering line is the same line Marissa found at 415 Hz (alog18796). Which turns out, as Gabriele observed, to show coherence with SRCL/PRCL.
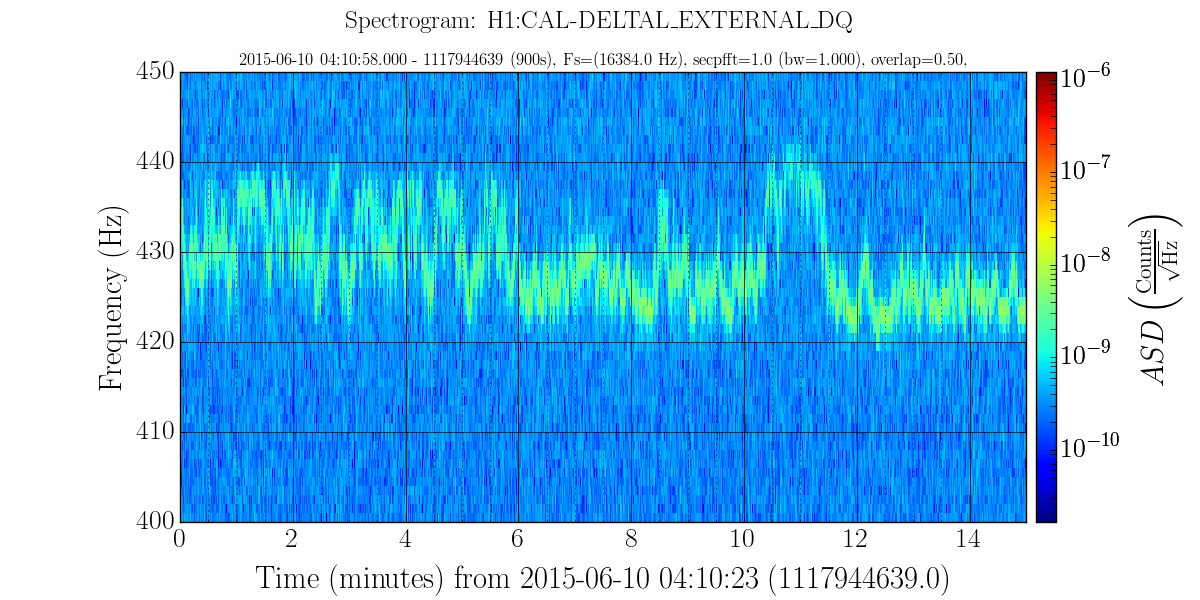
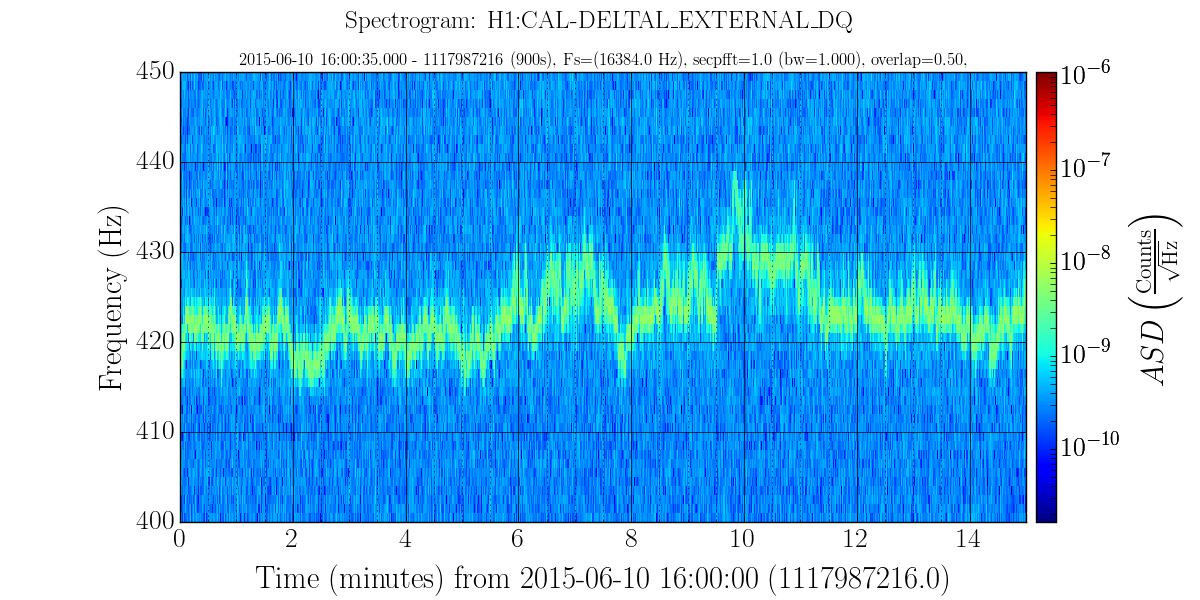
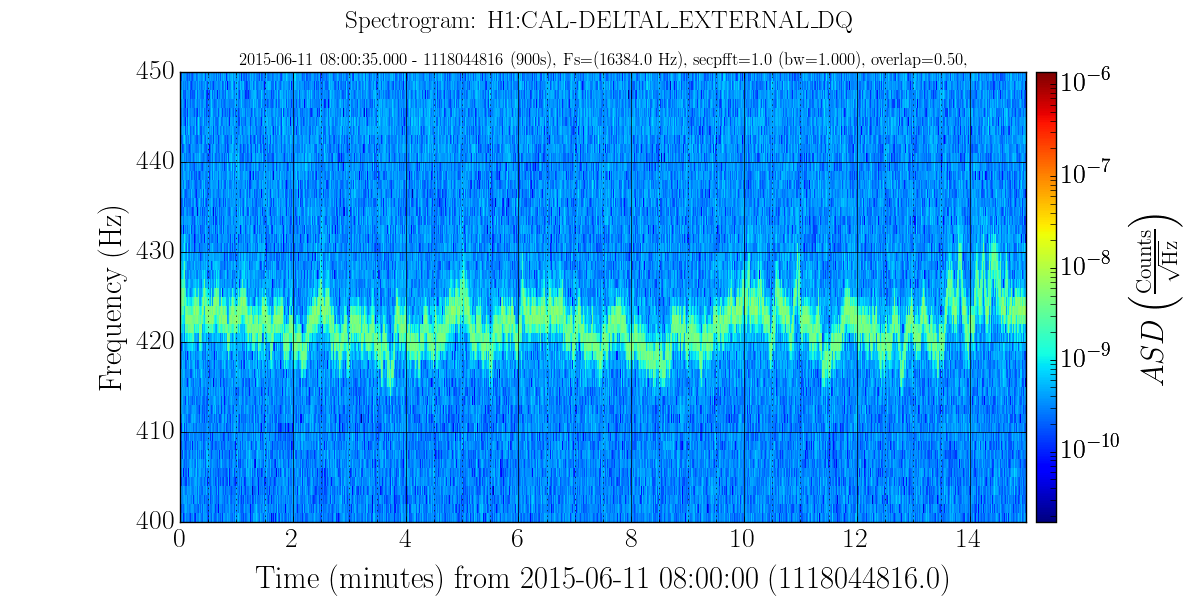
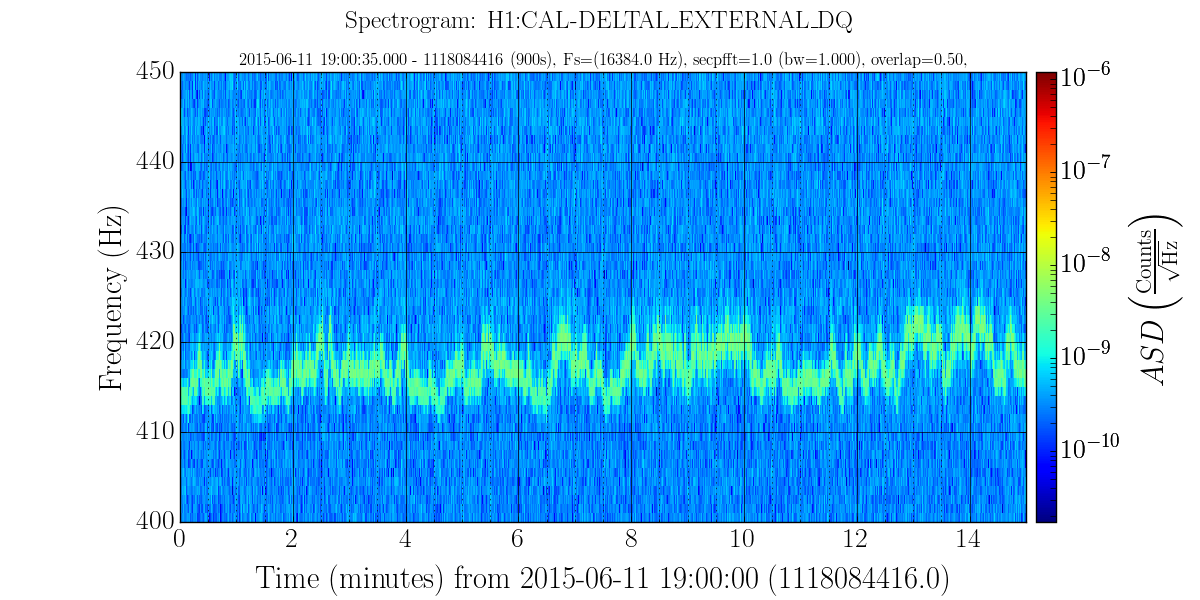
Ross Kennedy, my Ph.D. student, implemented tracking of this line over 800 seconds using the iWave line tracker. Overlaid with a spectrogram, you can see that there is quite good agreement as the frequency evolves. We're working on automating this tool to avoid hand-tuning parameters of the line tracker. It would also be interesting to track both this line and PSL behaviour at the same time, to check for correlation.

In the attached document there are two spectrograms - in each case the black overlay is the frequency estimate from iWave.
Times UTC
3:12 Locked LSC_FF @ 23W by request of Evan. Evan running measurments.
4:00 Lockloss.
6:00 Locked LSC_FF. Still at 23W and Evan and Dan still taking measurements.
6:55 Back to LSC_FF @ 16W. Starting remaining PCal and OLGTF measurements.
7:00 Handing off to TJ to bring ER7 home.
Times UTC
23:00 Still locked LSC_FF.
23:05 Jeff K taking OLGTF measurements and working on OMC calibration.
23:23 Jeff K taking PCal measuements.
0:05 Lockloss. Appears to be due to EQ in Canada.
0:45 Lockloss on the way up at BOUNCE_VIOLIN_MODE_DAMPING.
0:51 GRB/SN alarm. Unfortunately, not locked at the time.
1:22 Paused locking sequence at DC_READOUT_TRANSITION so Dan can take some OMC measurements.
3:00 Dan done with measurements.
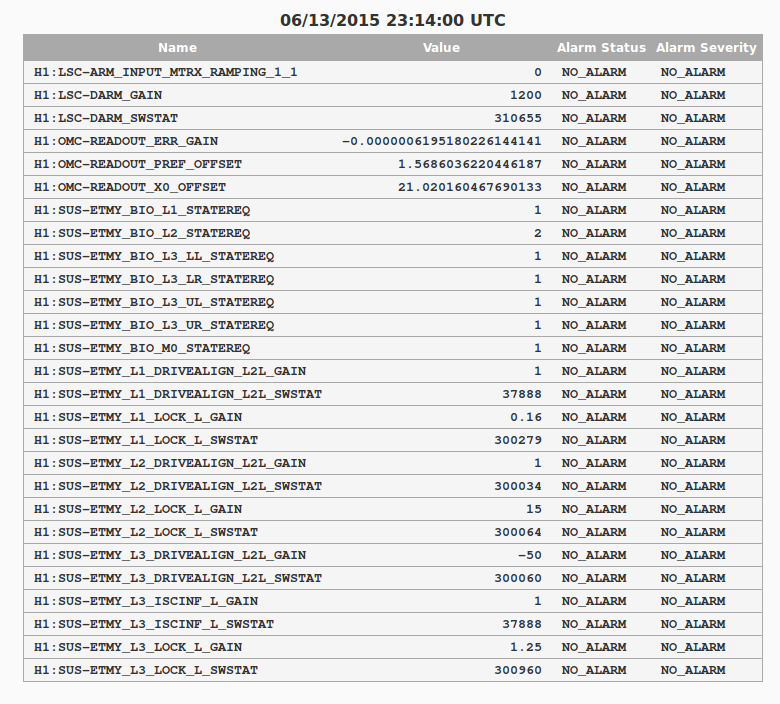
J. Kissel, T. Sadecki, D. Hoak, E. Merilh

As a last ditch effort to be able to recocile the calibration for the rest of the run, given the drastic change to the ETMY ESD, I've completed a DARM OLGTF, and also tuned and completed a PCAL EX to DARM transfer function. I got halfway through the same transfer function using PCAL EY, but the lock broke from some sort of seismic disturbance. The interferometer was at 17 [W] requested input power for all of the below measurements, I attach the relevant digital parameters that are relevant (sadly the list is growing! as so many things are changing!).

Analysis to come, but the measurements have been committed to the CalSVN repo here:
/ligo/svncommon/CalSVN/aligocalibration/trunk/Runs/PreER7/H1/Measurements/DARMOLGTFs
2015-06-13_H1_DARM_OLGTF_LHOaLOG19128_ETMYL3LPOFF.xml

/ligo/svncommon/CalSVN/aligocalibration/trunk/Runs/ER7/H1/Measurements/PCAL_TRENDS
2015-06-13_H1PCALEX_2_DARM.xml
2015-06-13_H1PCALEX_2_DARM_stronger.xml

/ligo/svncommon/CalSVN/aligocalibration/trunk/Runs/ER7/H1/Measurements/PCAL_TRENDS
2015-06-13_H1PCALEY_2_DARM_stronger.xml

For the PCAL sweeps, I've modified the following settings from what Sudarshan had set up (2015-06-12_pcal_sweep_X.xml in the same folder) such that (a) the measurement would complete in a reasonable amount of time, (b) we'd get coherence over the entire band of measurement, and (c) that the frequency vector would match the DARM OLGTF:
- Changed the frequency range to 5 to 5000 [kHz]
- Changed the frequency vector from linear to logarithmic
- Changed the user-defined amplitude format to Envelope
- Increased the number of cycles to 25
- Increased the duration of a cycle to 1 [sec]
- Increase the drive strength in various frequency bands where there remained no coherence
I took one more DARM OLG at 22.1 Watts, it is in the svn at /ligo/svncommon/CalSVN/aligocalibration/trunk/Runs/PreER7/H1/Measurements/DARMOLGTFs/2015-06-14_H1_DARM_OLGTF_LHOaLOG191138_ETMYL3LPOFF.xml
LHO ER7 data quality shift Wednesday 6/3 to Friday 6/5 (1117378816-1117584015). TJ Massinger was the shift mentor.
Things we noticed:
- Thursday the sensemon was incorrectly generating the inspiral range, which has since been fixed. The range was between 45 and 55 Mpc on Thursday.
- The calibration accuracy seemed to be more widely varying than in previous days, with large departures (factor of >5) at the high frequency (~6kHz) end.
- We saw the 14Hz roll mode ringing down at the beginning of each lock, except for the 11:00-13:00 UTC segment Thursday, where a ring-down measurement was being performed. Nothing to see here.
- Some ugly wandering lines in CARM around 600Hz that also showed up through their 4th harmonic.
- A particularly glitchy segment just before 18:00 UTC Friday. We tracked down the loudest glitch which was identified as 2.16kHz (SNR 3,190). A time plot shows this was actually high frequency glitches riding on a much larger ~7.7 Hz blip. The high frequency components also showed up in the PRM M2 suspension control signals. Some discussion in the aLog about this: https://alog.ligo-wa.caltech.edu/aLOG/index.php?callRep=18918
A link to the shift report: https://wiki.ligo.org/DetChar/DataQuality/DQShiftLHO20150603
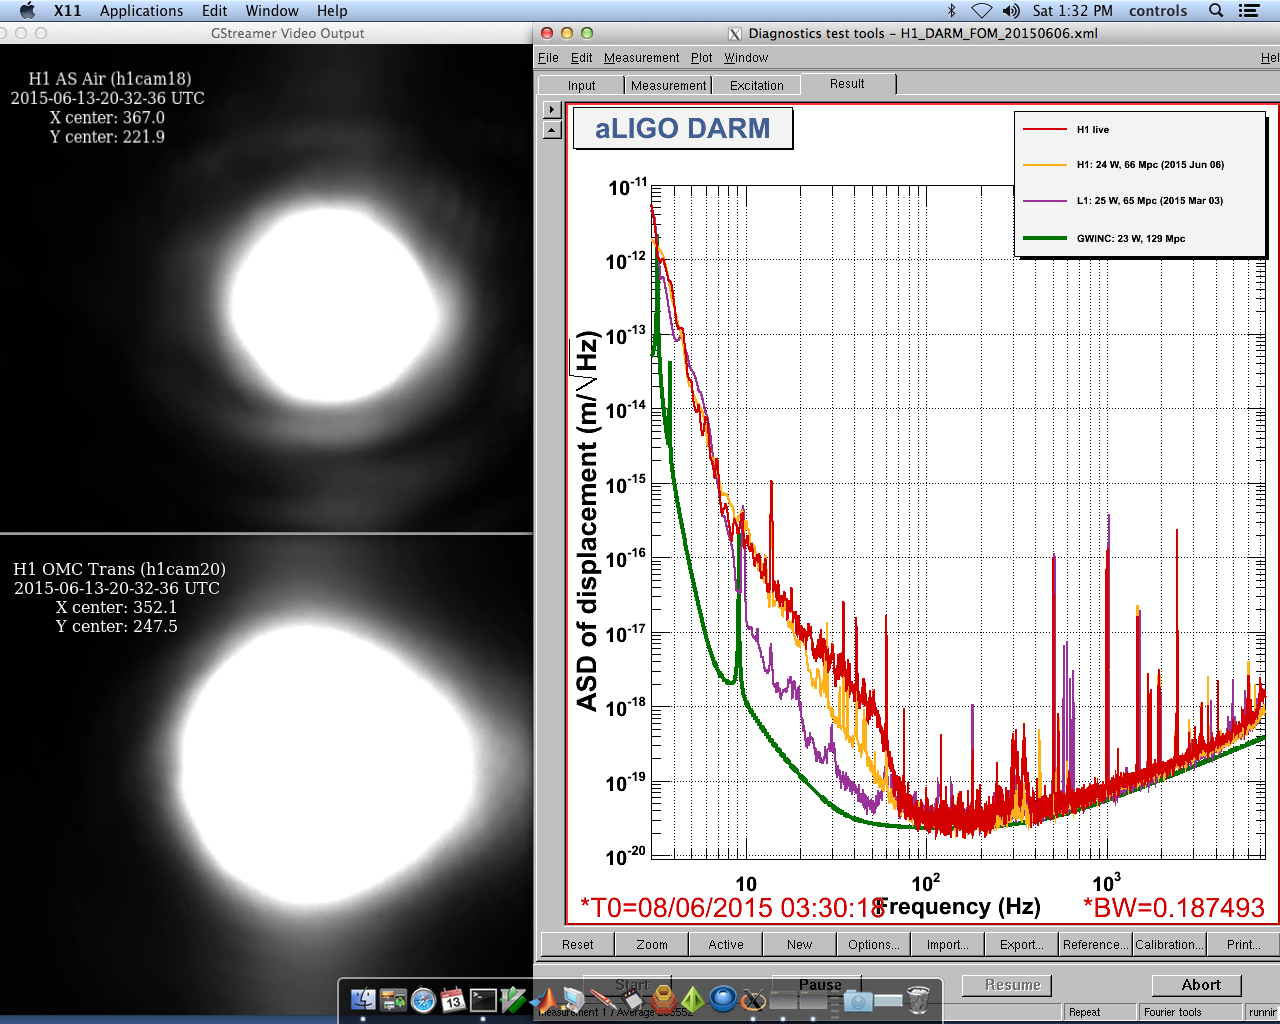
The calibratinon is wrong at the moment, I think the OMC's automatic scaling during the hand off failed. Dan confirms that he's changed the order o power scaling / gain matching yesterday.

On the phone with sheila, I measure the DARM OLG, to be a factor of 0.63 too low, so with her advice, I've rescaled the sensing gain (in the LSC input matrix) by that same factor,
13.20723*1.5737 = 20.78447
then reconfirmed that both the DARM UGF is correct, as well as the DARM ASD on the wall matches the reference, and we're back in the reasonable Mpc range of ~55 [Mpc].

I'm now taking the full DARM OLGTF sweep, and if that's successful, I'll get the PCAL sweep as well.
Just to clarify - while the DARM OLG did change due to the OMC-READOUT_ERR_GAIN setting, this wasn't due to edits to the OMC_LOCK code. It's not clear why the gain-matching calculation missed on this lock, it worked fine for subsequent locks. Looks like a one-off error.
LLO was down at the beginning but came up during the injections. I did most of what I had hoped to do in the first round.
22:09UTC H1 is in science mode:
LLO showed up on DMT at ~ 20:48UTC
Robert into LVEA @ 20:47UTC
Jeff K into control room with a tour group @ 21:48
We had four known reasons for having difficulty locking today, one is an unsolved mystery that might be hurting us more often than we realize.
I reloaded both ISC_DRMI and ISC_LOCK guardians today, to incorporate these changes.
Good luck TJ!
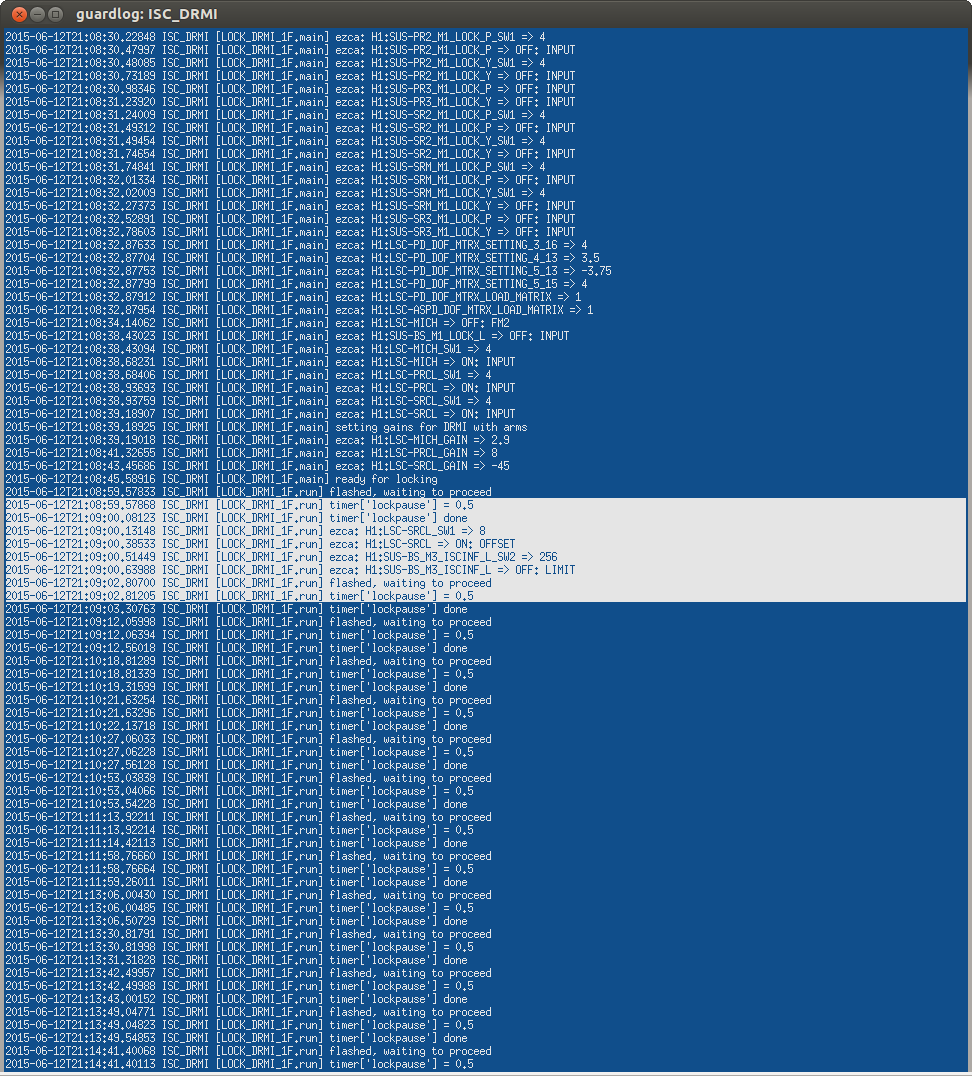
I don't think the log snippet included above shows the problem, but I found where in the log it does:
2015-06-13T05:36:35.76316 ISC_LOCK [LOWNOISE_ESD_ETMY.enter]
2015-06-13T05:36:35.78009 ISC_LOCK [LOWNOISE_ESD_ETMY.main] ezca: H1:SUS-ETMY_L3_LOCK_L_TRAMP => 0
2015-06-13T05:36:35.78025 ISC_LOCK [LOWNOISE_ESD_ETMY.main] Preparing ETMY for DARM actuation transition...
2015-06-13T05:36:36.03624 ISC_LOCK [LOWNOISE_ESD_ETMY.main] ezca: H1:SUS-ETMY_M0_LOCK_L => OFF: INPUT
2015-06-13T05:36:36.03791 ISC_LOCK [LOWNOISE_ESD_ETMY.main] ezca: H1:SUS-ETMY_L1_LOCK_L_GAIN => 0.16
2015-06-13T05:36:36.03886 ISC_LOCK [LOWNOISE_ESD_ETMY.main] ezca: H1:SUS-ETMY_L3_LOCK_L_GAIN => 0
2015-06-13T05:36:36.04021 ISC_LOCK [LOWNOISE_ESD_ETMY.main] ezca: H1:SUS-ETMY_L1_LOCK_L_SW1S => 20804
2015-06-13T05:36:36.29496 ISC_LOCK [LOWNOISE_ESD_ETMY.main] ezca: H1:SUS-ETMY_L1_LOCK_L => ONLY ON: INPUT, FM2, FM3, FM5, FM6, FM7, FM8, OUTPUT, DECIMATION
2015-06-13T05:36:36.55096 ISC_LOCK [LOWNOISE_ESD_ETMY.main] ezca: H1:SUS-ETMY_L2_LOCK_L => ONLY ON: INPUT, FM6, OUTPUT, DECIMATION
2015-06-13T05:36:36.55229 ISC_LOCK [LOWNOISE_ESD_ETMY.main] ezca: H1:SUS-ETMY_L3_LOCK_L_SW1S => 16388
2015-06-13T05:36:36.80324 ISC_LOCK [LOWNOISE_ESD_ETMY.main] ezca: H1:SUS-ETMY_L3_LOCK_L => ONLY ON: INPUT, FM6, FM8, FM9, FM10, OUTPUT, DECIMATION
2015-06-13T05:36:37.05938 ISC_LOCK [LOWNOISE_ESD_ETMY.main] ezca: H1:SUS-ETMY_L2_DRIVEALIGN_L2L => ONLY ON: INPUT, FM2, OUTPUT, DECIMATION
2015-06-13T05:36:37.31538 ISC_LOCK [LOWNOISE_ESD_ETMY.main] ezca: H1:SUS-ETMY_L3_DRIVEALIGN_L2L => ONLY ON: INPUT, FM3, FM4, FM5, OUTPUT, DECIMATION
2015-06-13T05:36:37.31694 ISC_LOCK [LOWNOISE_ESD_ETMY.main] ezca: H1:SUS-ETMY_L3_LOCK_L_TRAMP => 10
2015-06-13T05:36:37.32341 ISC_LOCK [LOWNOISE_ESD_ETMY.main] ezca: H1:SUS-ETMX_L1_LOCK_L_SW1 => 16
2015-06-13T05:36:37.57613 ISC_LOCK [LOWNOISE_ESD_ETMY.main] ezca: H1:SUS-ETMX_L1_LOCK_L => OFF: FM1
2015-06-13T05:36:38.57792 ISC_LOCK [LOWNOISE_ESD_ETMY.main] ezca: H1:SUS-ETMY_L3_LOCK_L_GAIN => 0.7
2015-06-13T05:36:38.57846 ISC_LOCK [LOWNOISE_ESD_ETMY.main] ezca: H1:SUS-ETMX_L3_LOCK_L_GAIN => 0.5
2015-06-13T05:36:49.58941 ISC_LOCK [LOWNOISE_ESD_ETMY.main] ezca: H1:SUS-ETMY_L1_LOCK_L_SW1 => 16
2015-06-13T05:36:49.84053 ISC_LOCK [LOWNOISE_ESD_ETMY.main] ezca: H1:SUS-ETMY_L1_LOCK_L => ON: FM1
2015-06-13T05:36:50.84245 ISC_LOCK [LOWNOISE_ESD_ETMY.main] ezca: H1:SUS-ETMY_L3_LOCK_L_GAIN => 1.25
2015-06-13T05:36:50.84585 ISC_LOCK [LOWNOISE_ESD_ETMY.main] ezca: H1:SUS-ETMX_L3_LOCK_L_GAIN => 0
2015-06-13T05:36:50.84640 ISC_LOCK [LOWNOISE_ESD_ETMY.main] timer['ETMswap'] = 10.0
2015-06-13T05:36:50.85290 ISC_LOCK [LOWNOISE_ESD_ETMY.main] ezca: H1:SUS-ETMY_L3_LOCK_L_TRAMP => 0
2015-06-13T05:36:50.85341 ISC_LOCK [LOWNOISE_ESD_ETMY.main] Preparing ETMY for DARM actuation transition...
2015-06-13T05:36:51.10580 ISC_LOCK [LOWNOISE_ESD_ETMY.main] ezca: H1:SUS-ETMY_M0_LOCK_L => OFF: INPUT
2015-06-13T05:36:51.11470 ISC_LOCK [LOWNOISE_ESD_ETMY.main] ezca: H1:SUS-ETMY_L3_LOCK_L_GAIN => 0
2015-06-13T05:36:51.11670 ISC_LOCK [LOWNOISE_ESD_ETMY.main] ezca: H1:SUS-ETMY_L1_LOCK_L_SW1S => 20804
2015-06-13T05:36:51.37015 ISC_LOCK [LOWNOISE_ESD_ETMY.main] ezca: H1:SUS-ETMY_L1_LOCK_L => ONLY ON: INPUT, FM2, FM3, FM5, FM6, FM7, FM8, OUTPUT, DECIMATION
2015-06-13T05:36:51.62486 ISC_LOCK [LOWNOISE_ESD_ETMY.main] ezca: H1:SUS-ETMY_L2_LOCK_L => ONLY ON: INPUT, FM6, OUTPUT, DECIMATION
2015-06-13T05:36:51.88017 ISC_LOCK [LOWNOISE_ESD_ETMY.main] ezca: H1:SUS-ETMY_L3_LOCK_L => ONLY ON: INPUT, FM6, FM8, FM9, FM10, OUTPUT, DECIMATION
2015-06-13T05:36:52.13170 ISC_LOCK [LOWNOISE_ESD_ETMY.main] ezca: H1:SUS-ETMY_L2_DRIVEALIGN_L2L => ONLY ON: INPUT, FM2, OUTPUT, DECIMATION
2015-06-13T05:36:52.38753 ISC_LOCK [LOWNOISE_ESD_ETMY.main] ezca: H1:SUS-ETMY_L3_DRIVEALIGN_L2L => ONLY ON: INPUT, FM3, FM4, FM5, OUTPUT, DECIMATION
2015-06-13T05:36:52.39457 ISC_LOCK [LOWNOISE_ESD_ETMY.main] ezca: H1:SUS-ETMY_L3_LOCK_L_TRAMP => 10
2015-06-13T05:36:52.65332 ISC_LOCK [LOWNOISE_ESD_ETMY.main] ezca: H1:SUS-ETMX_L1_LOCK_L => OFF: FM1
2015-06-13T05:36:53.65498 ISC_LOCK [LOWNOISE_ESD_ETMY.main] ezca: H1:SUS-ETMY_L3_LOCK_L_GAIN => 0.7
2015-06-13T05:36:53.65562 ISC_LOCK [LOWNOISE_ESD_ETMY.main] ezca: H1:SUS-ETMX_L3_LOCK_L_GAIN => 0.5
2015-06-13T05:37:04.66682 ISC_LOCK [LOWNOISE_ESD_ETMY.main] ezca: H1:SUS-ETMY_L1_LOCK_L_SW1 => 16
2015-06-13T05:37:04.91783 ISC_LOCK [LOWNOISE_ESD_ETMY.main] ezca: H1:SUS-ETMY_L1_LOCK_L => ON: FM1
2015-06-13T05:37:05.91955 ISC_LOCK [LOWNOISE_ESD_ETMY.main] ezca: H1:SUS-ETMY_L3_LOCK_L_GAIN => 1.25
2015-06-13T05:37:05.92183 ISC_LOCK [LOWNOISE_ESD_ETMY.main] ezca: H1:SUS-ETMX_L3_LOCK_L_GAIN => 0
2015-06-13T05:37:05.92216 ISC_LOCK [LOWNOISE_ESD_ETMY.main] timer['ETMswap'] = 10.0
2015-06-13T05:37:05.94222 ISC_LOCK [LOWNOISE_ESD_ETMY.run] MC not locked
Based on the ezca and log output during LOWNOISE_ESD_ETMY.main it does in fact look like main() was executed twice in a row. That should never happen under any circumstances. I'm investigating.
I think that there are potentially two different issues, one being what is shown in the original alog, where the run should return true, but the guardian state doesn't change even though the current state is not the requested state. We could re-wrtie the guardains (or at tleast this state) to reduce the harm from this, but it still seems like a bug in the way the gaurdian is working.
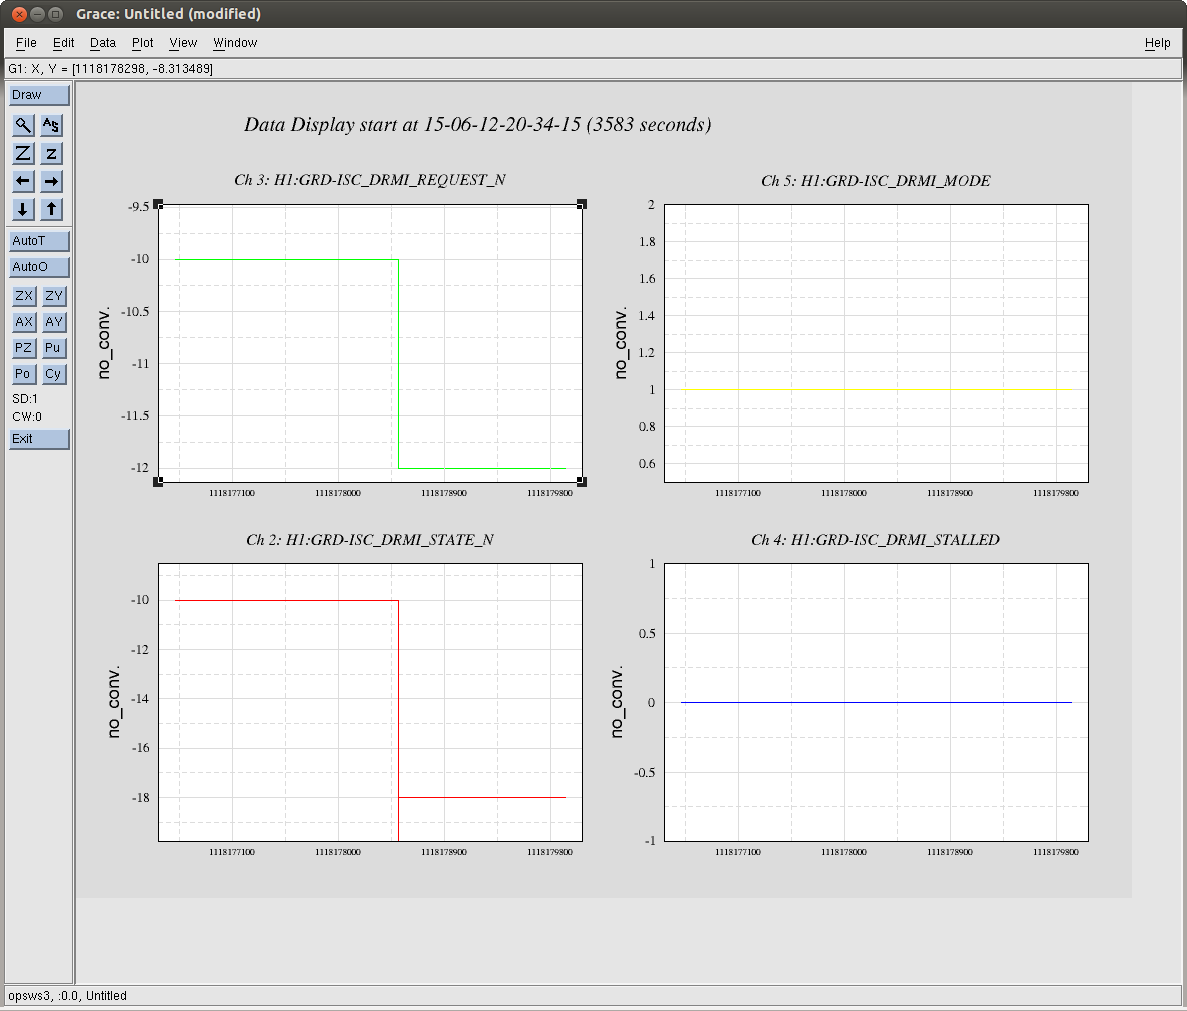
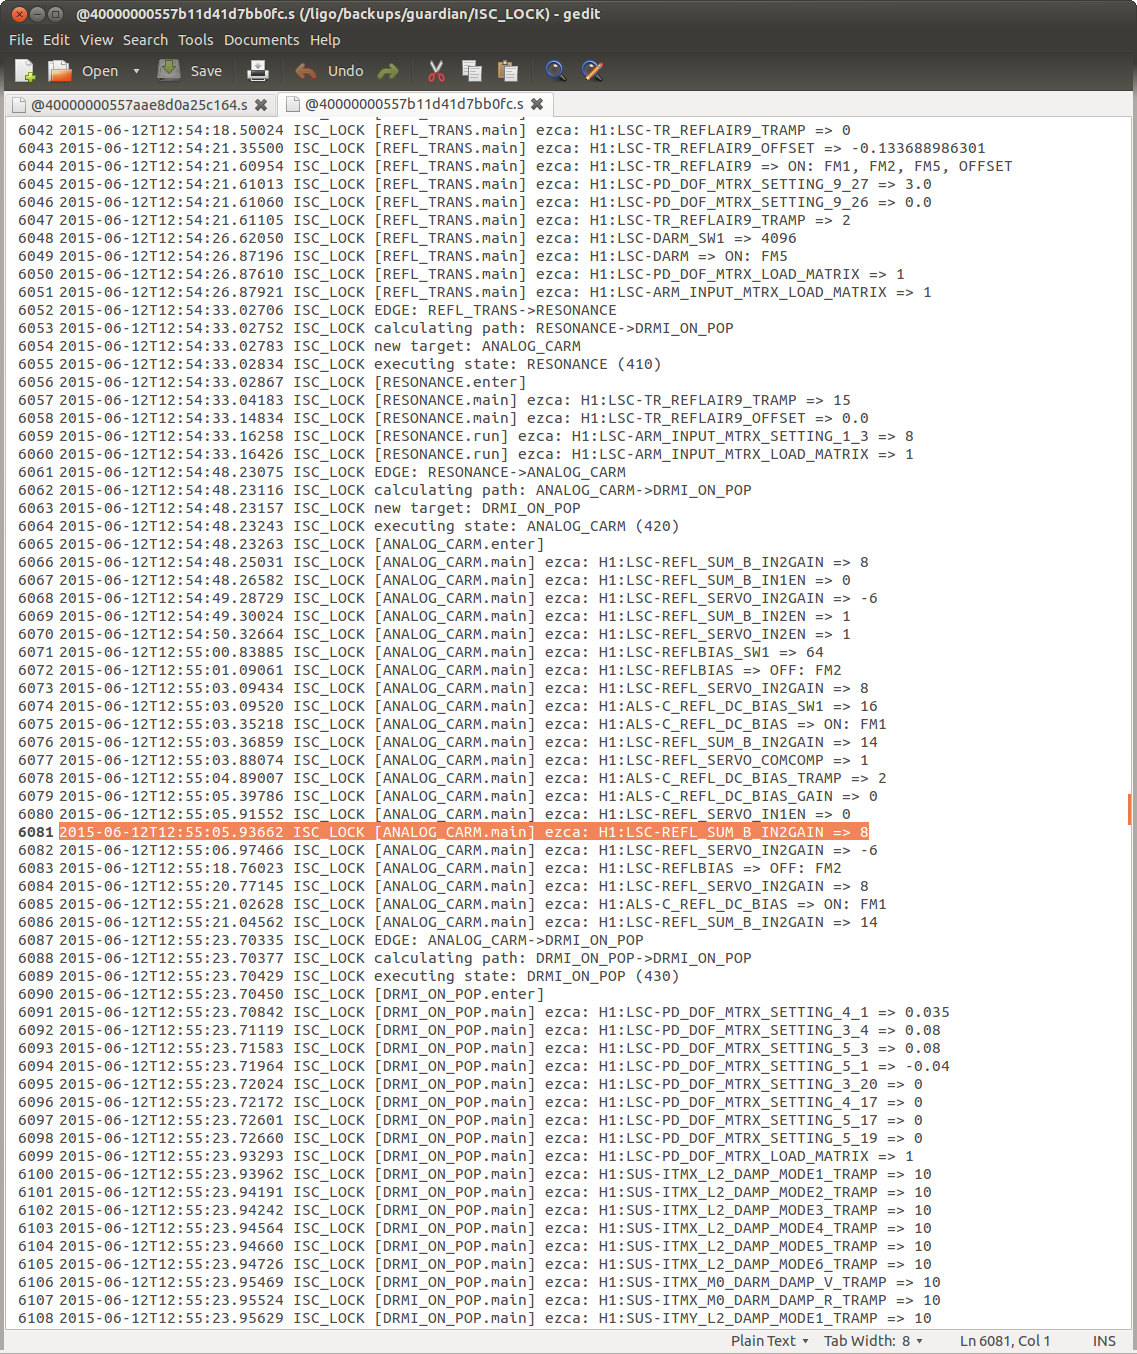
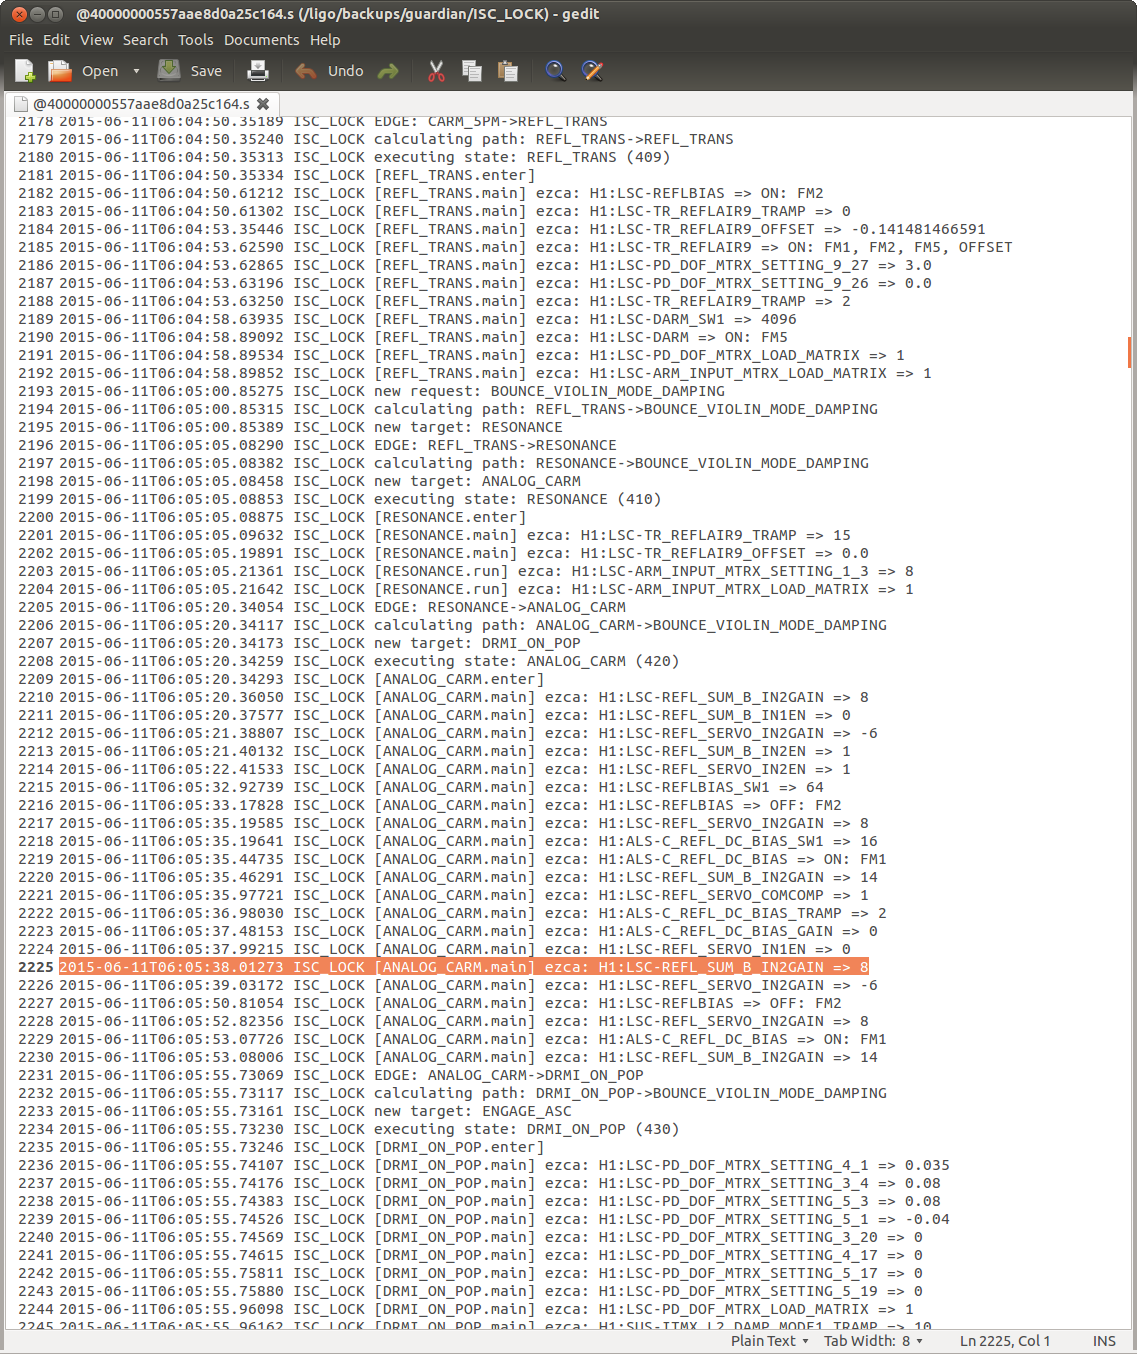
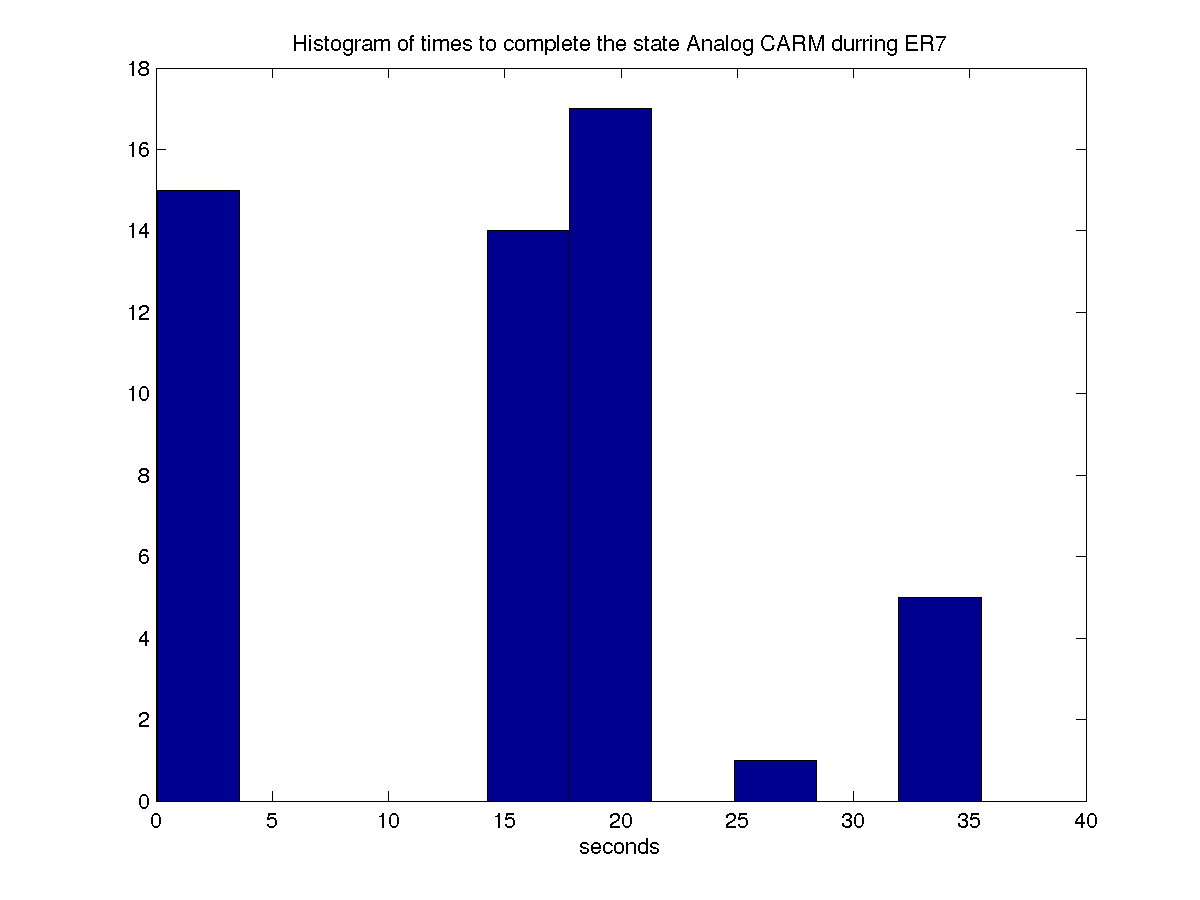
On the other hand, the problem that Jamie pointed out is more serious. For other reasons, I have been looking at histograms of how long the guardian spends in each state. Some states should take the same amount of time to execute each time, but analog carm for example has 3 possibilities. We often detect a lockloss in the first second of the state, if the state executes normally it takes 18 seconds, but there were 5 times that it took 35 seconds because it repeated main. GPS times of these events are:
1117983542.06250
> 1118037936.06250
> 1118148903.93750
> 1118294947.06250
> 1118295997.06250

I looked at guardian log for the first three of these events, and indeed they
are times when the main was repeated. These are mosly sucsesfull locks, so the bug isn't causing locklosses here although it easily could.

The ISC_LOCK code that was running at the time is in the svn as revision 10776.

actually, the data from 9 am local time (16 UTC) should be considered suspect, the X end cleanroom has been on for part of this time.