Sheila, Koji, Dan, Evan
Summary
Today we recovered a 35 Mpc lock and put the necessary steps in the Guardian.
Details
Bounce mode damping
For EY bounce mode damping, the DARM→EY element in the LSC output matrix is set to −1 and L3 ISCINF is enabled. Length feedback is entirely disabled on EY at this point. Then in the M0 DARM damping filter module, the +60° rotator and the bandpass are enabled, and the gain is −0.1.
Since this new damping feedback topology is not fully implemented on the ITMs, the DARM error signal is routed through LSC-YARM and into IX L3. In M0 DARM filter module, there is no phase rotation, only the bandpass at 9.7 Hz. I found that I needed to flip the sign of the gain compared to what we used to use; −80 seemed to damp the mode alright. Since this is a hack and likely will not be necessary 24 hours from now, it has not been put into the Guardian.
In both cases I have removed the 120 dB of gain from the bandpass FM and put it in a separate FM. This 120 dB is no longer sensible when using DARM control rather than DARM error.
Sheila has pointed out that any test mass which uses this damping scheme is ineligible to be used for feedfoward subtraction of other length DOFs, unless we come up with some workaround.
OMC ASC
As mentioned yesterday, we reverted the HAM6 centering scheme so that we could keep the interferometer ASC working.
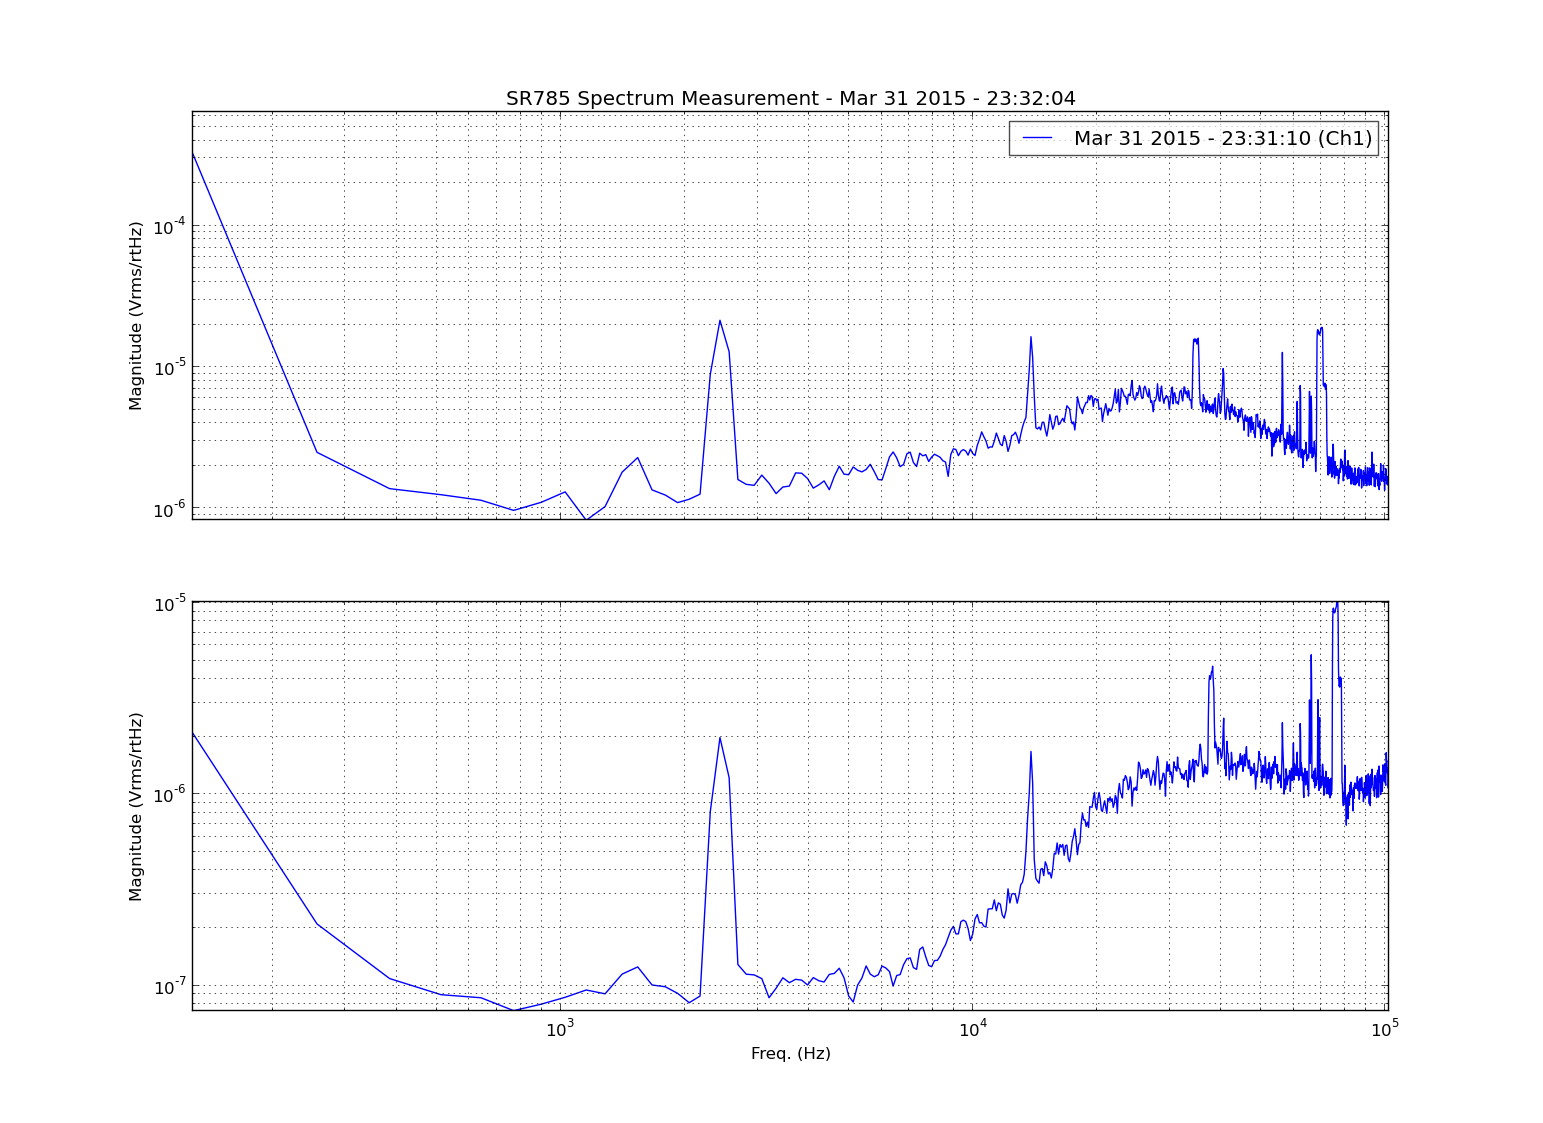
Consequently, we now see scattering shelves in the DARM spectrum if the OMC ASC gain is set to 1. Setting it to 0.2 makes the DARM spectrum less painful to look at.
MICH coupling
Although tonight's campaign of noise coupling measurements was cut short by the PSL tripping, Koji and I managed to get a MICH→DARM transfer function with good coherence from 20 Hz to 400 Hz. The DTT files are attached.
For quiet data, one can look at 2015-04-01 07:50:15 to 07:55:15.
Automation
Now that we have a reliable readback of the EY ESD state, the EX→EY transition has been reenabled in the Guardian.
The new final state is LSC_FF, which enables the MICH and SRCL feedforward and adds a cutoff to the SRCL loop.