J. Oberling, R. Savage, E. Merilh
Summary
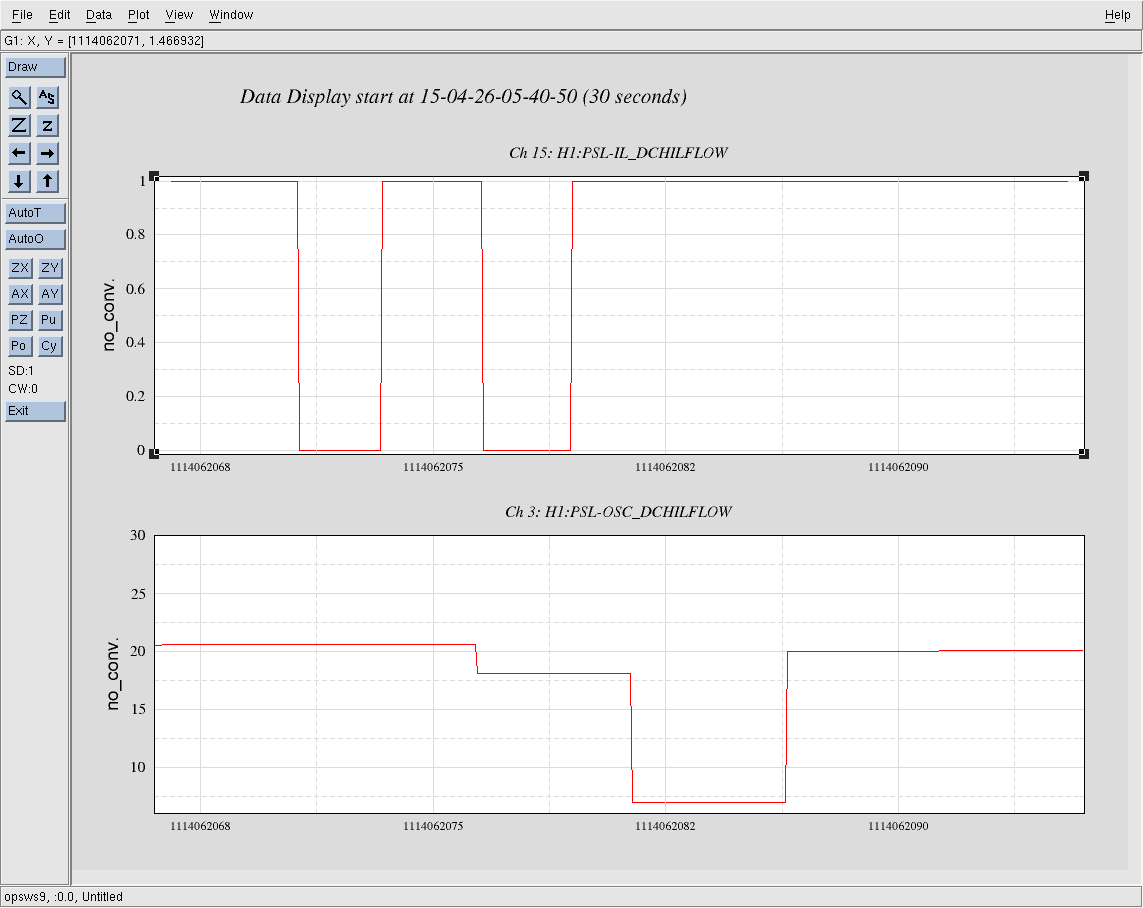
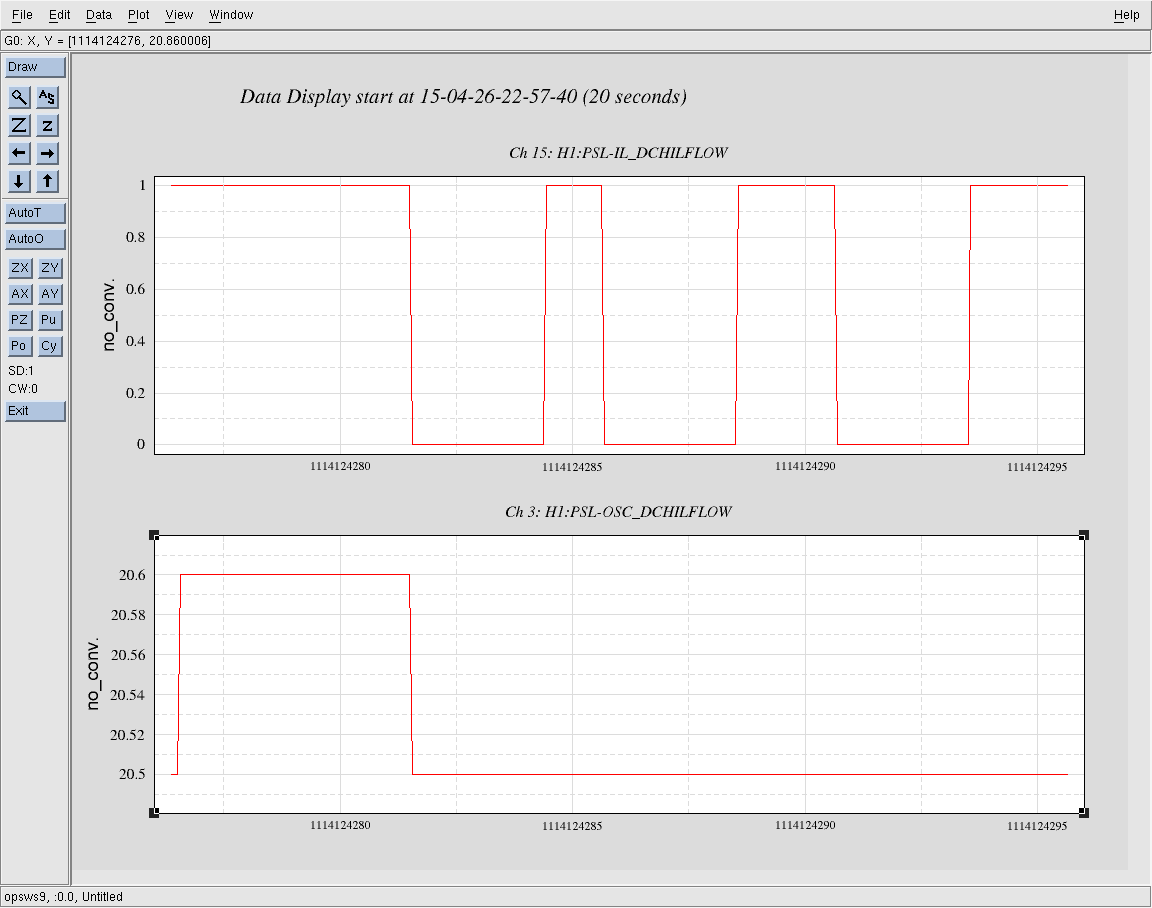
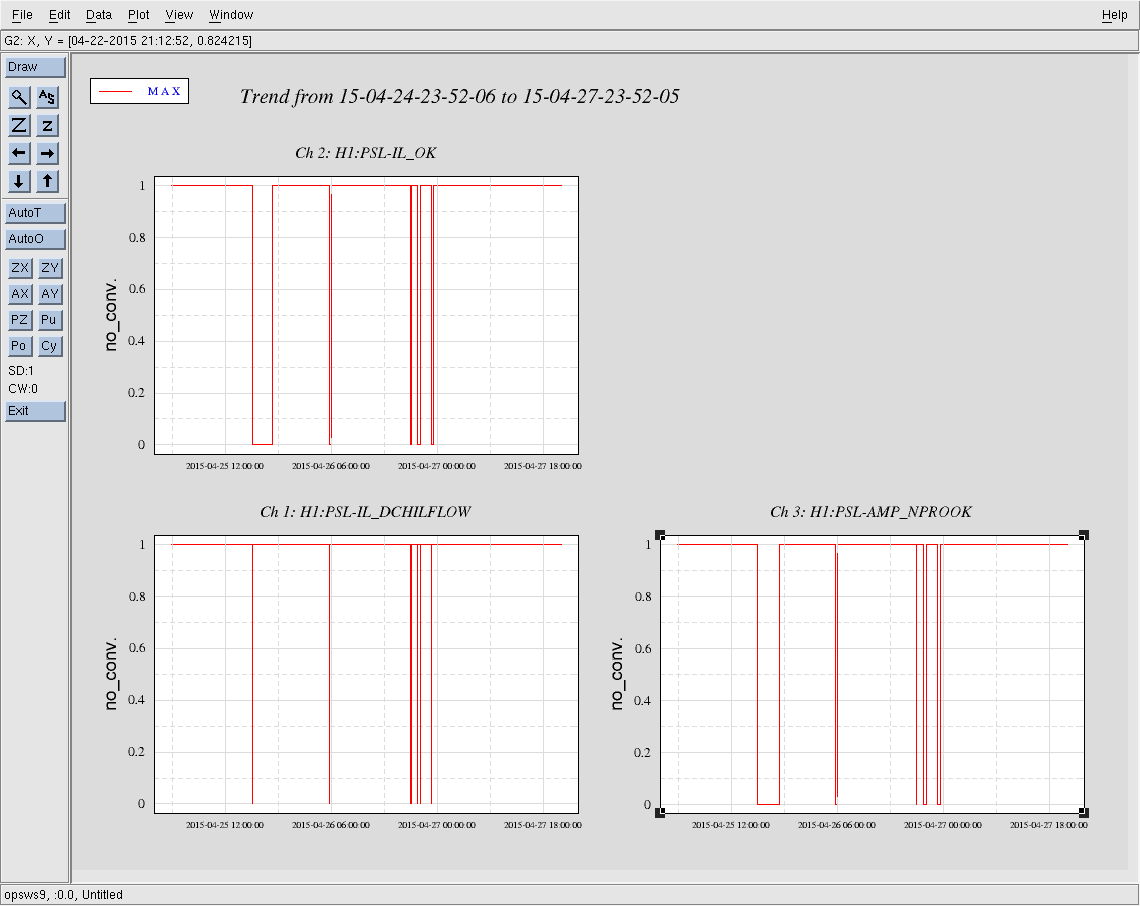
After looking at the diode box chiller interlock signal H1:PSL-IL_DCHILFLOW and the actual flow sensor H1:PSL-OSC_DCHILFLOW we are starting to wonder if there might be a problem with the flow sensor. It seems the interlock trips don't correlate to a drop in flow, but the other way around: an interlock trip triggers the drop in flow, which makes sense if the interlock is programmed to shut off the chiller in the case of an interlock trip, except this is not always the case and there doesn't seem to be a change in the flow rate before the interlock trips. Details follow, investigation continues.
Details
In an effort to determine why the PSL tripped so many times over the weekend (see LHO alog 18063 and associated comments) we looked at the diode box chiller interlock signal H1:PSL-IL_DCHILFLOW and tried to correlate that to actual drops in the water flow of this chiller using the signal H1:PSL-OSC_DCHILFLOW. Some examples from the weekend trips are attached below (I unfortunately forgot to save an overall picture of all 5 PSL trip events (6 diode box chiller flow interlock trips); will go back to the control room and attach as a comment).
PSL diode interlock trip event #1 - The interlock trips and after a few seconds either resets itself or someone was really on the ball. The flow rate does not drop until several seconds after the initial trip (and after the interlock reset), and there is no change in the flow rate before the interlock trips. Flow rate does not drop to zero but restores itself slowly.
PSL diode interlock trip event #2 - 2 interlock trips in quick succession, lasting just a few seconds each, once again with no change in the flow rate before the first interlock trip. The flow rate of the chiller did not change until several seconds after the first initial trip; the second trip could be a result of the lower flow rate at the time of the trip. Flow rate does not go to zero but restores itself (chiller shut off then back on?).
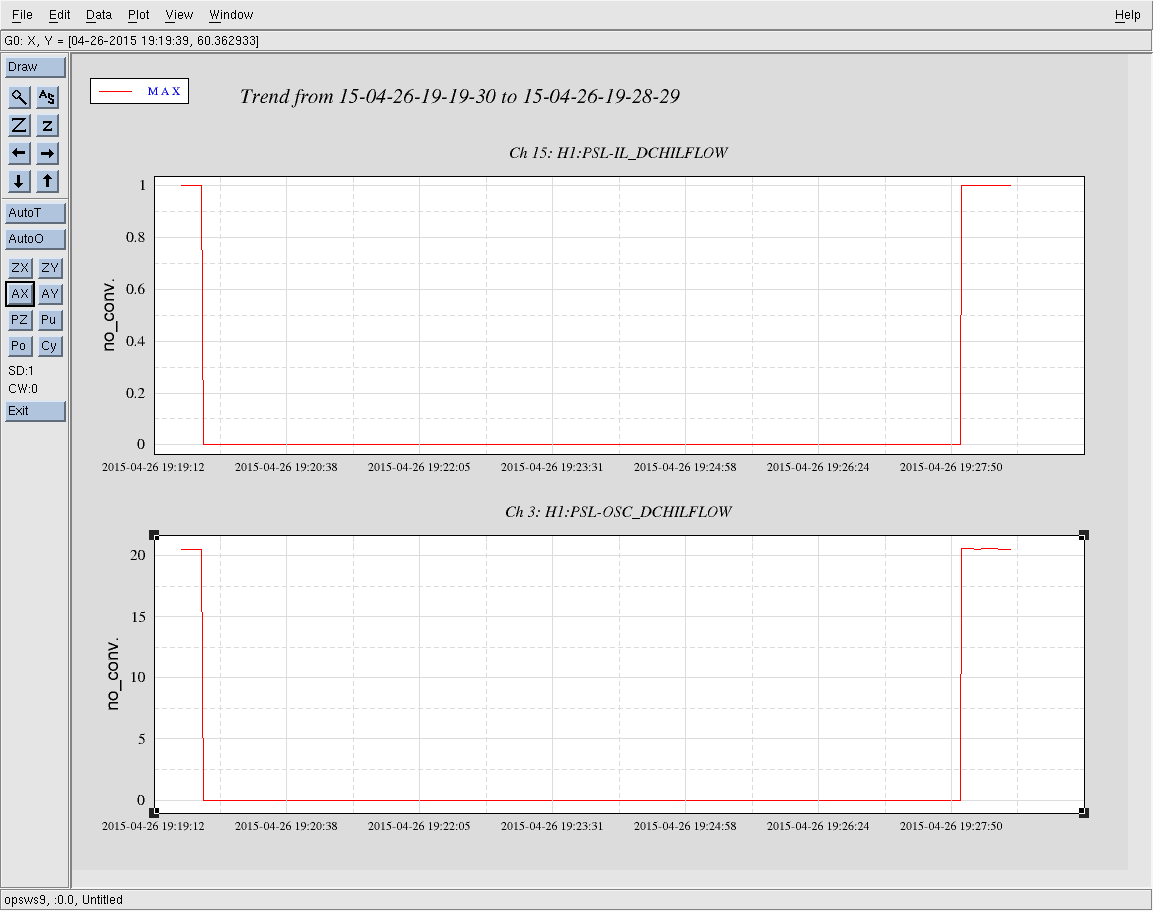
PSL diode interlock trip event #3 - One long trip for >8 minutes. Hard to see on this plot but the interlock tripped a full 2 seconds before the flow actually stopped. No change in flow rate before the interlock tripped. Flow rate does go to zero this time and is restored shortly before the interlock resets.
PSL diode interlock trip event #6 - 3 interlock trips in short succession, each lasting just a few seconds. Unlike the others, there is no associated drop in the chiller flow before or after the trip; the flow is being reported as within an acceptable range for operation with no obvious reason for the chiller flow interlock to trip. Problem with the flow sensor?
Investigation ongoing, more to come.


Actually, that Oplev stopped working 2 plus weeks ago around the 10th. Attached is a 20 day trend showing it gasping on the 10th.