Dave, Jeff, Rick, Alexa, Sheila, Elli
This morning we discovered the PSL watchdog had tripped last night aroun 9.40 UTC. Sheila says this was not a flow error, but we don't know what caused the trip. To recover the PSL we did the following steps:
...
-With Rick's help over the phone, we restarted PSL at 12.15 in the fiber room. We then set about waiting an hour for the laser temperature to settle before we turned the PSL watcdogs back on.
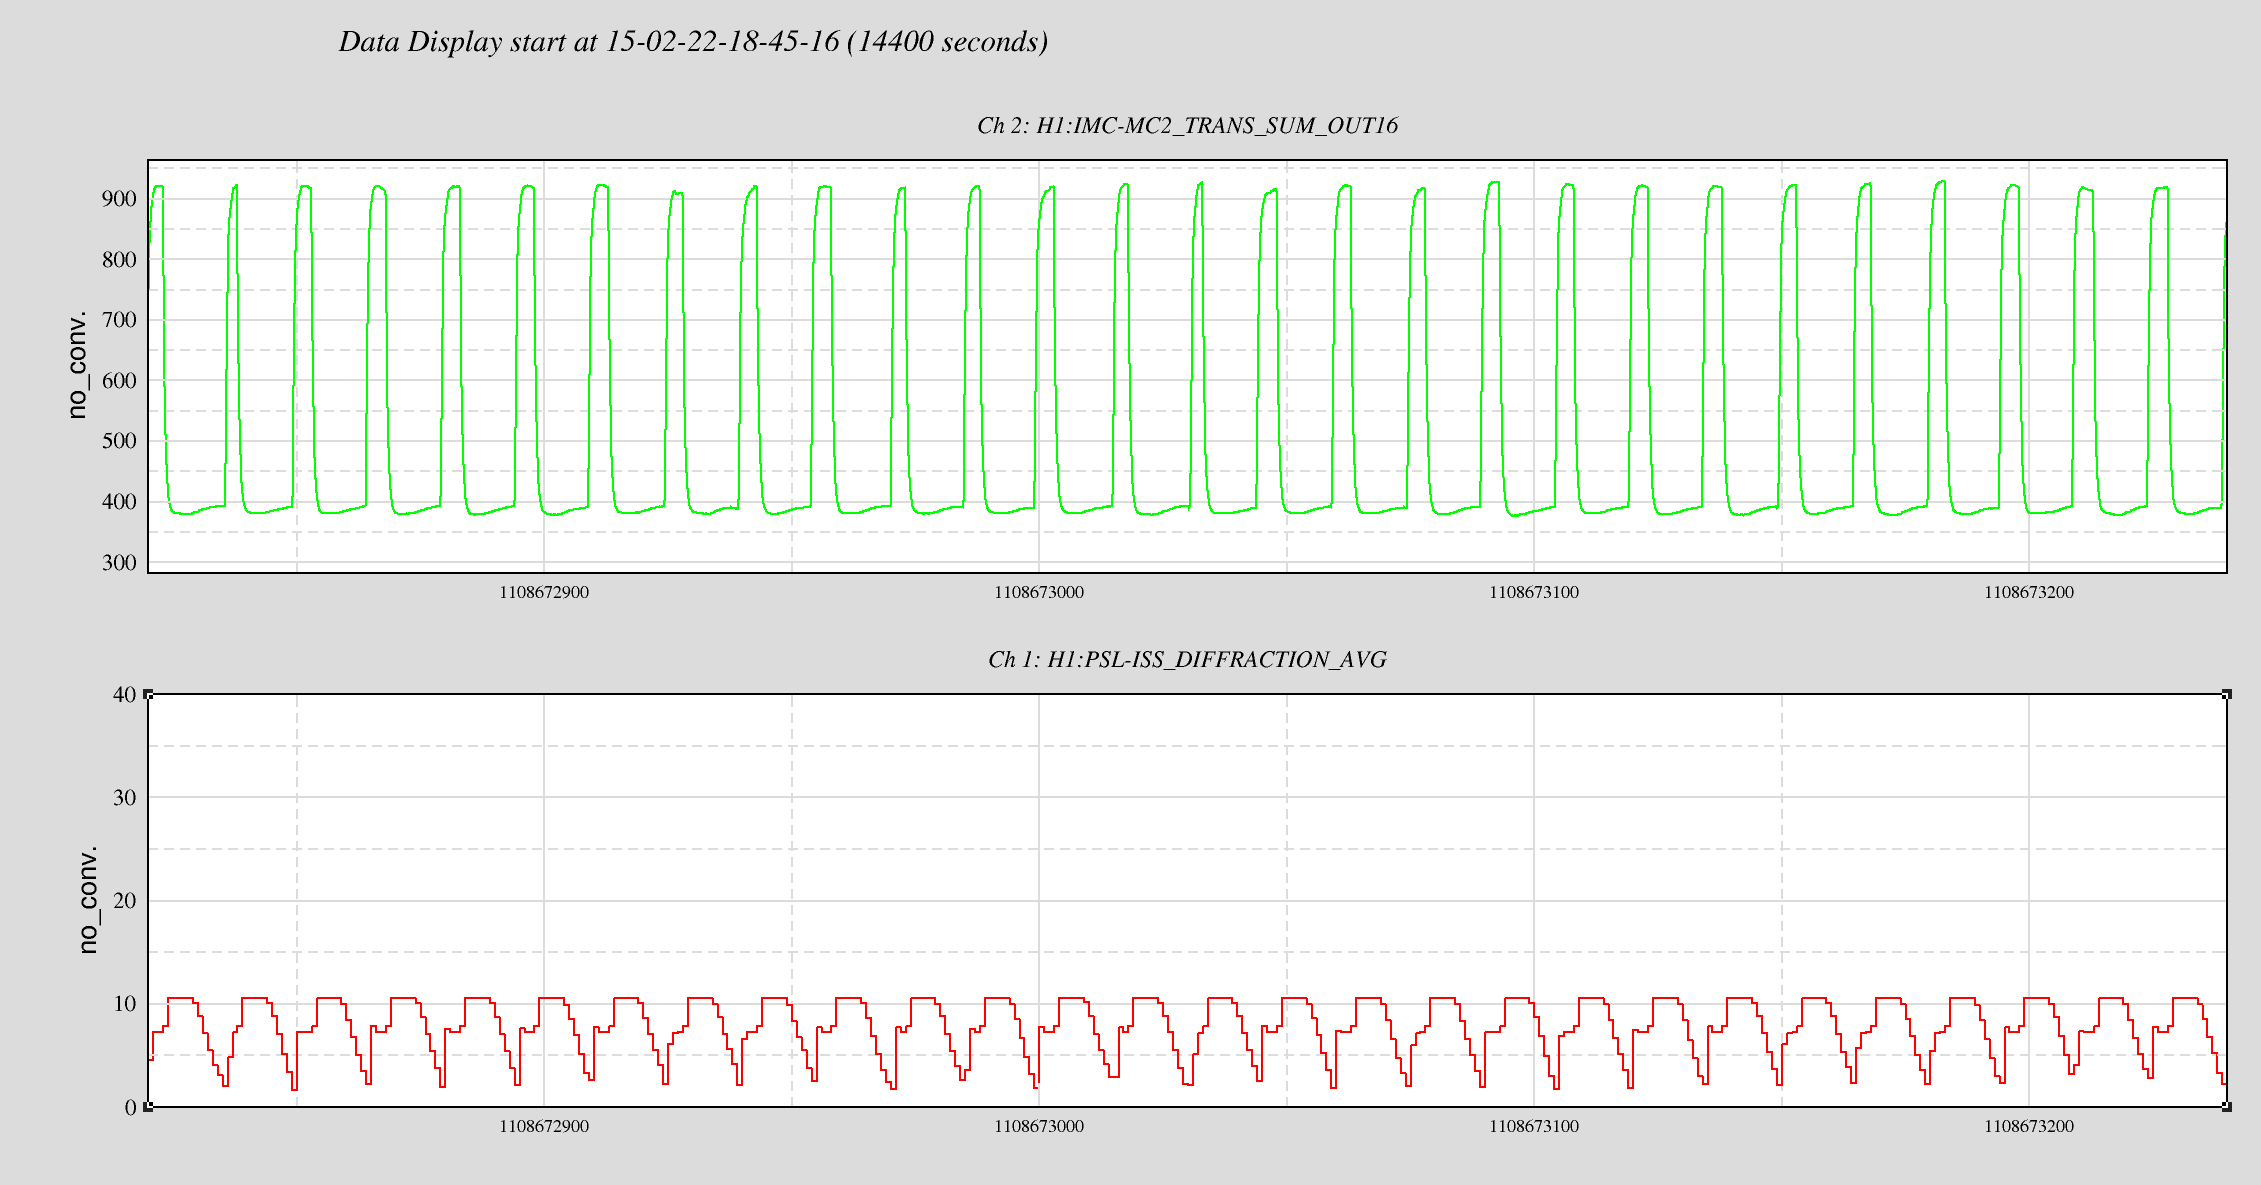
-During this hour, we observed an oscillation build up in IMC-MC2_TRANS_SUM_OUTPUT trace. This built up to oscillations between 300-990 counts with a 30 sec period over the hour (see picture). IMC_PWR_IN_OUT16 also oscillating, suggesting a problem downstream of the IMC. (We eventually fixed this by changing the H1:PSL-ISS_REFSIGNAL so that the diffracted power was around 8%.)
-We noticed BS ISI tripped at 6.41 PST and Ham3 ISI triped at 12.06 PT, so we reset these watchdogs.. Big Earthquake at 6am PST which caused the BS trip.
-At this point we turned off IMC WFS by switching H1:IMC-WFS_GAIN from 0.1 to 0, and took the IMC lock guardian from locked to down, and turned off Input 1 on IMC servo board. We cleared the history of the IMC_ASC MC1,MC2,MC3 and PZT loops. As it later turned out, clearing the PZT history was not helpful as clearing this hstory removed a necessary alignment offset.
-We looked at the ISS. Diffracted pw in % ( H1:PSL-ISS_DIFFRACTION_AVG) was also spiking in a saw-toothed wave shape (see picture). We turned off autolock and IMC input power settled down. We reduced H1:PSL-ISS_REFSIGNAL from -2.11V to -2.07V, untill the H1:PSL-ISS_DIFFRACTION_AVG was around 8%. Before this change the diffracted power was getting close to 0%. This changed fixed the strange oscillations we were seeing in IMC-MC2_TRANS_SUM.
-Once the ISS was behaving again, we re-locked theIMC and turned the IMC WFS back on. Because we had cleared the PZT history, turning on the WFS did not bring us back to full IMC power buildup. The beams on WFS-A and WFS-B were not centered, again because the IMC PZT mirror was not correctly aligned. We adjusted PZT H1:IMC-PZT_PIT_OFFSET ( from 2650 to 3535) and H1:IMC-PZT_YAW_OFFSET (from 5774 to 5970) to compensate for the history we cleared. This brought the IMC-IM2_TRANS power back up to its expected value, and WFS-A and WFS_B were again centered.
...
At the end of all this, we think we have recovered the PSL and IMC alignments to where we were at the start.