Displaying reports 7221-7240 of 89060.Go to page Start 358 359 360 361 362 363 364 365 366 End
Reports until 16:20, Monday 05 May 2025
H1 AOS
betsy.weaver@LIGO.ORG - posted 16:20, Monday 05 May 2025 (84265)
Fixed the ASC REFL connections

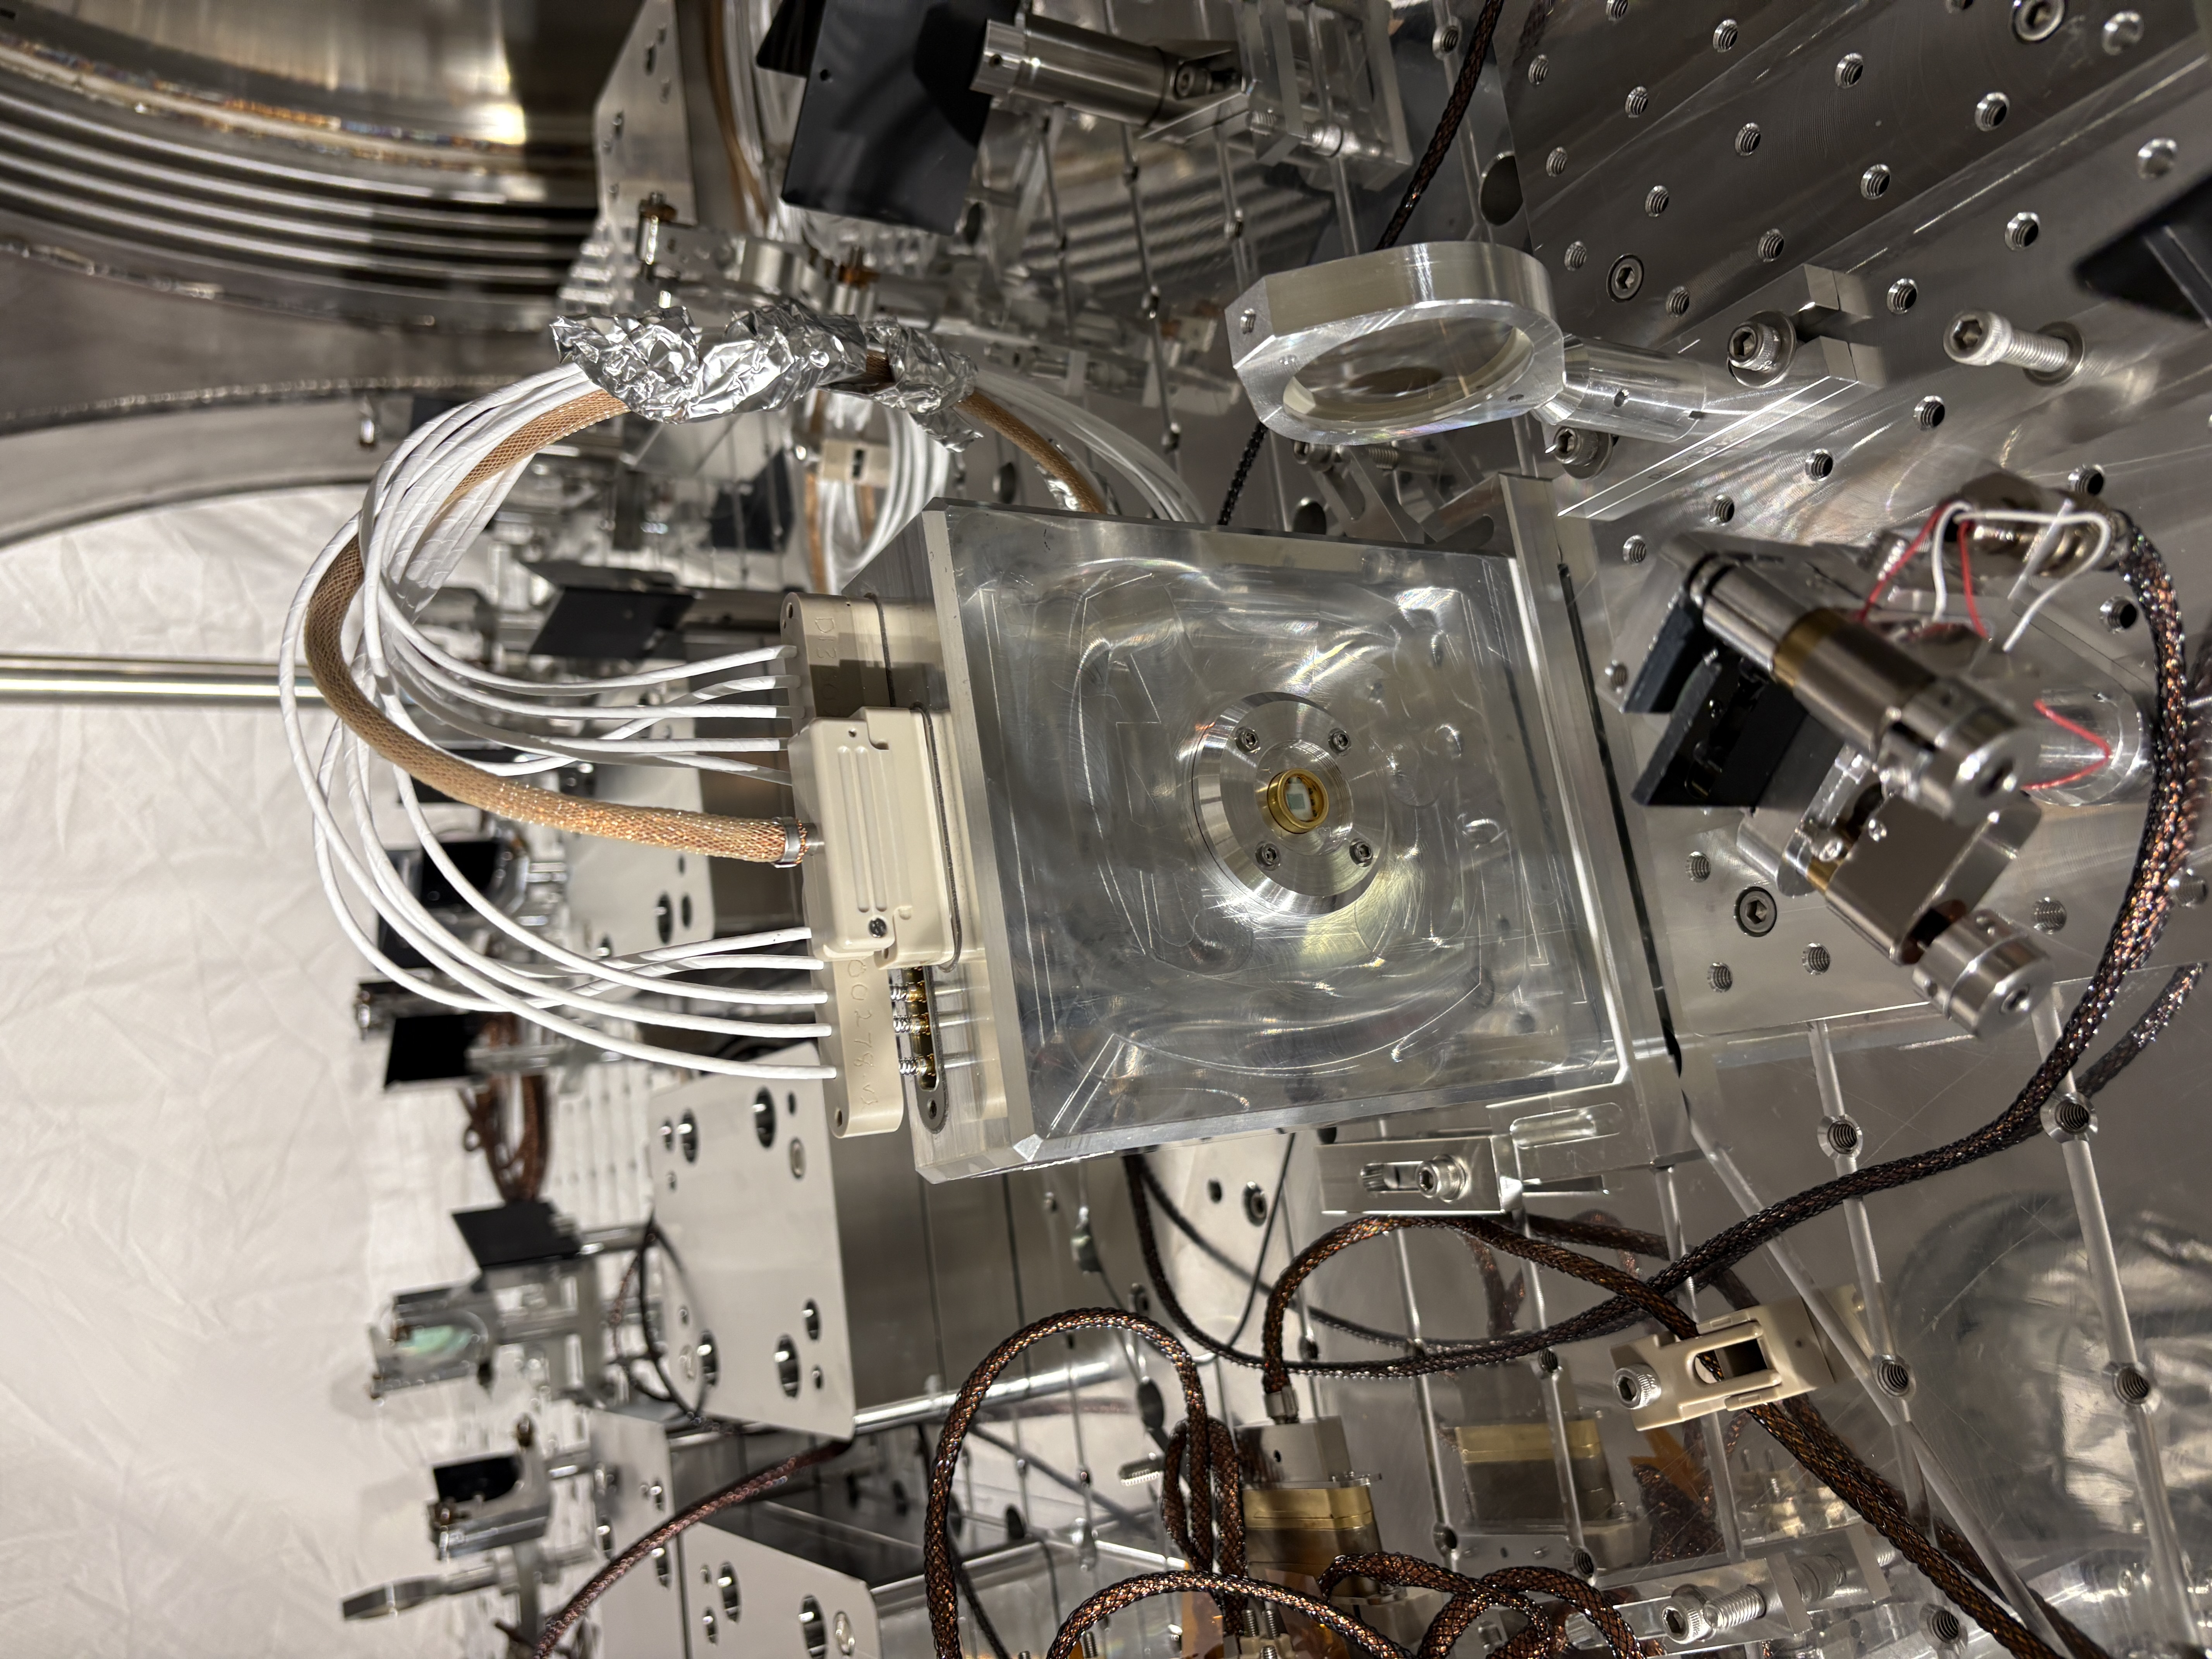
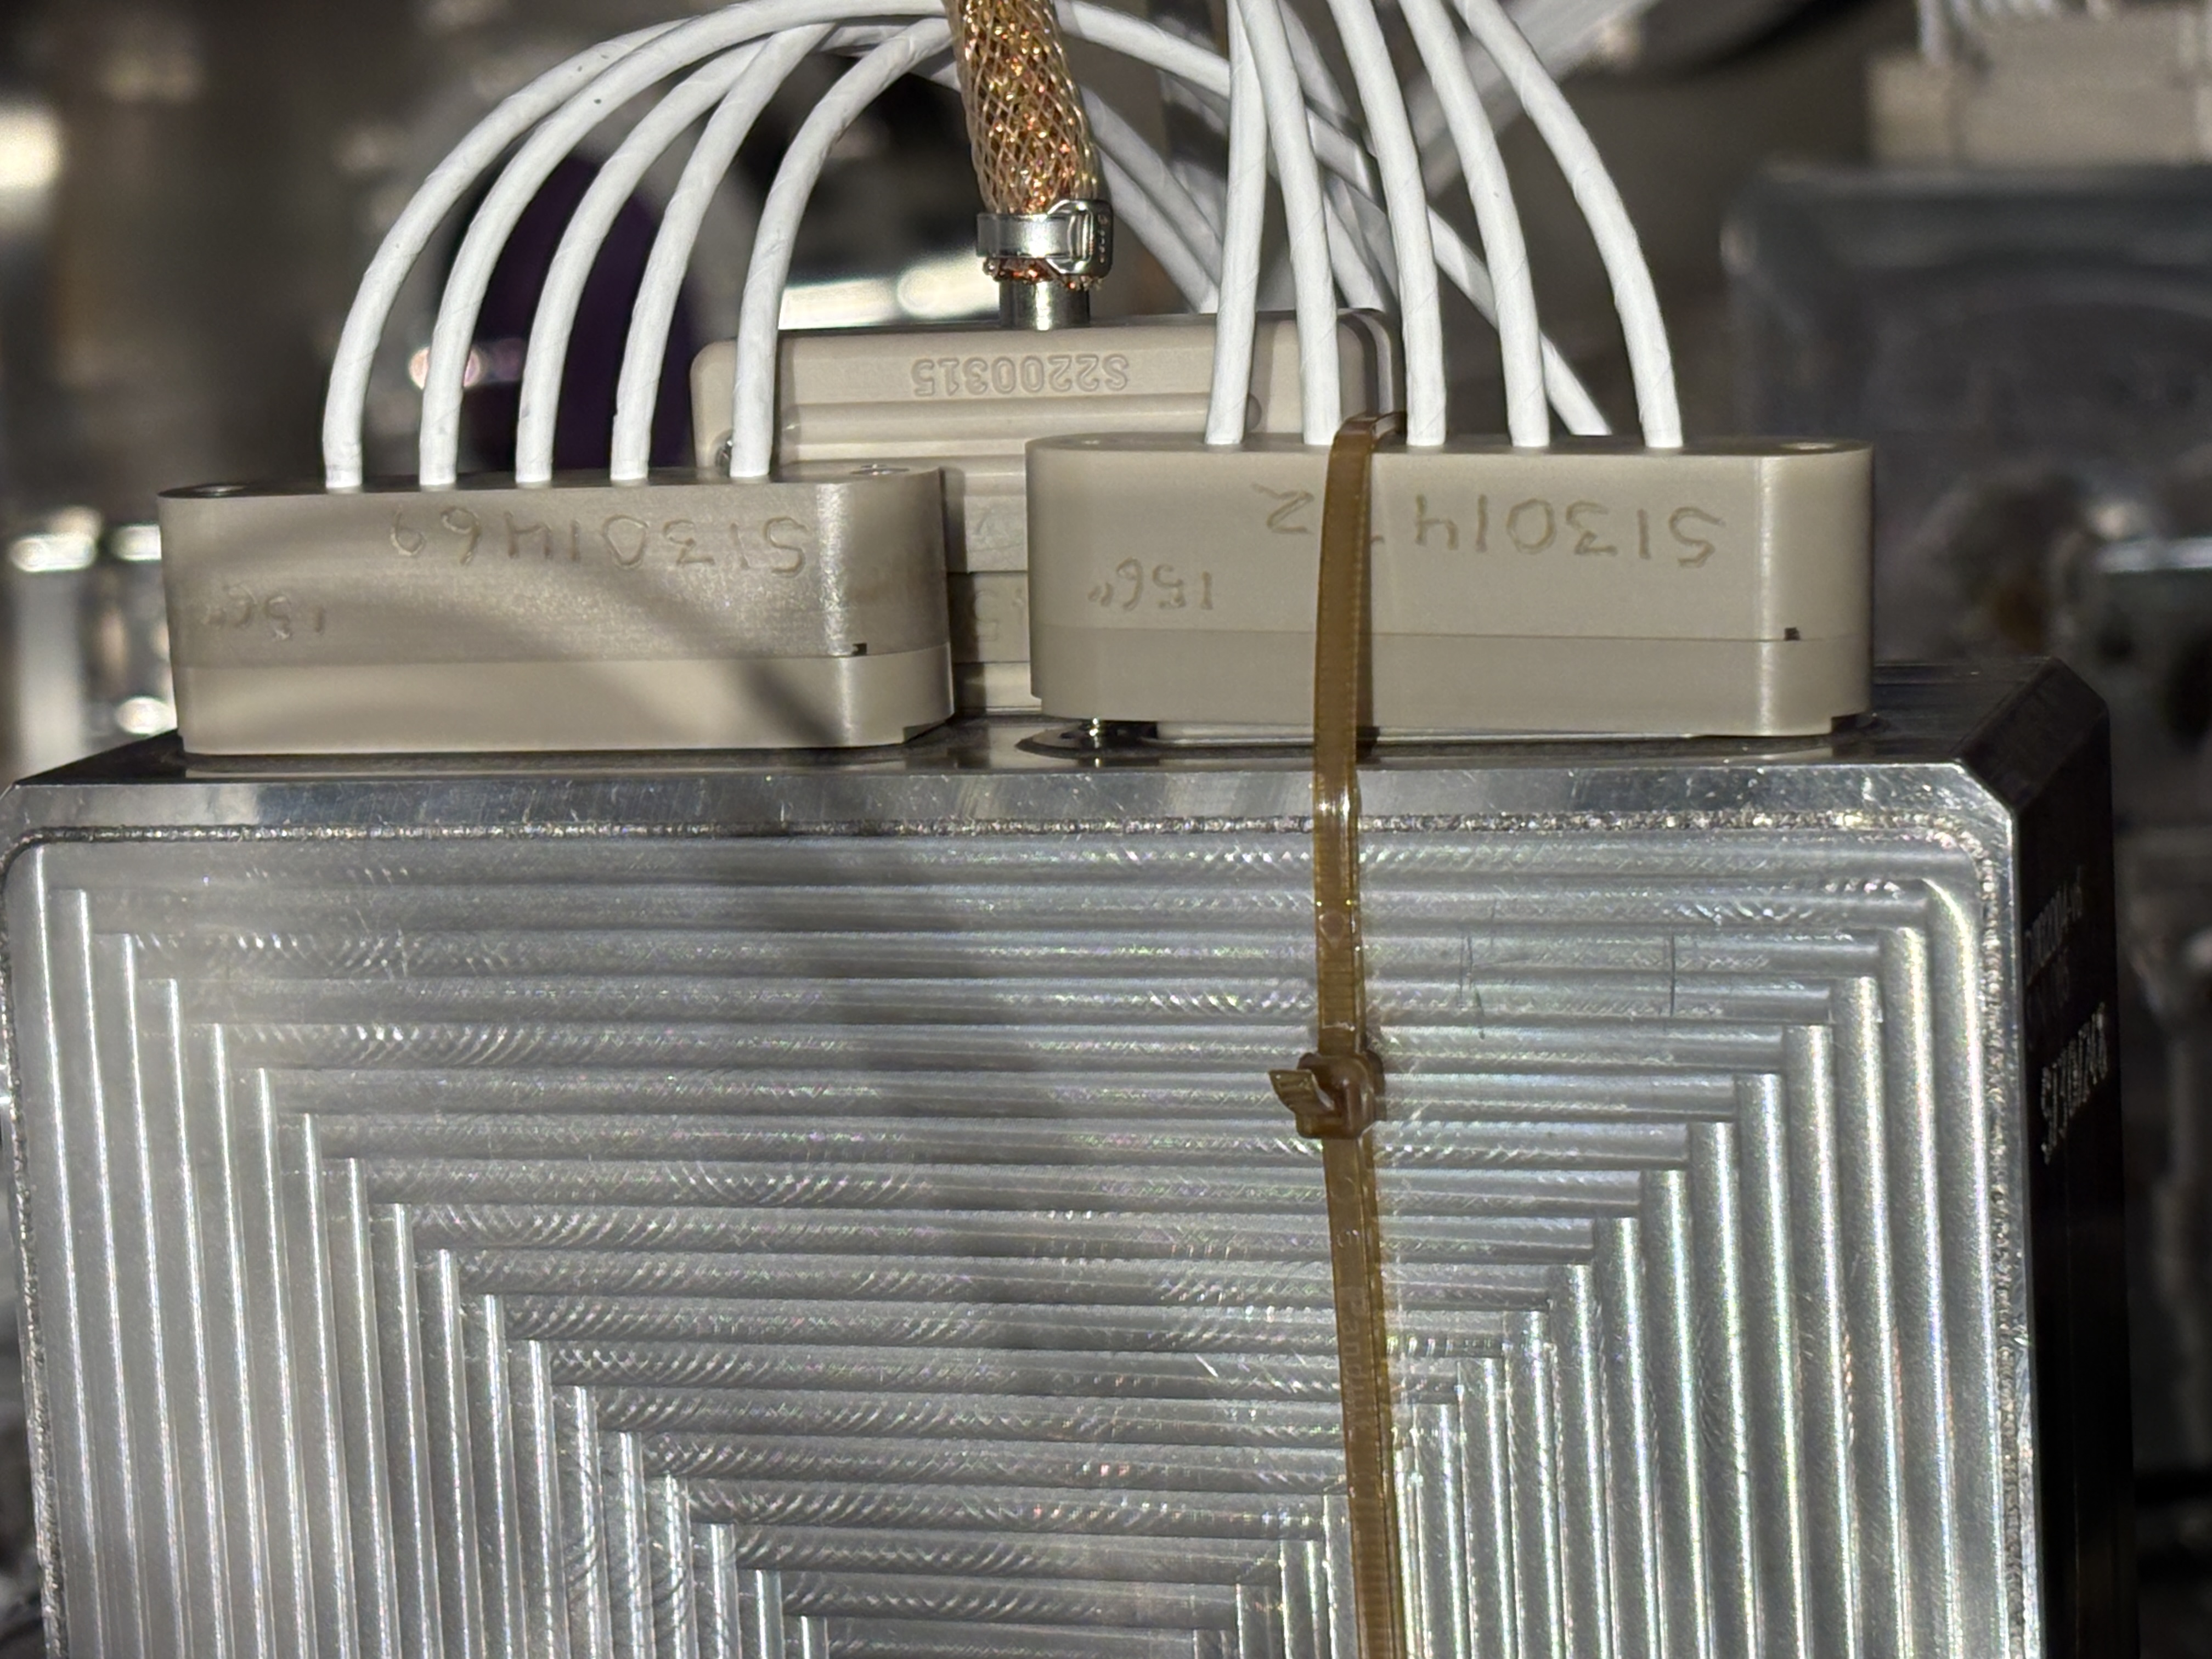
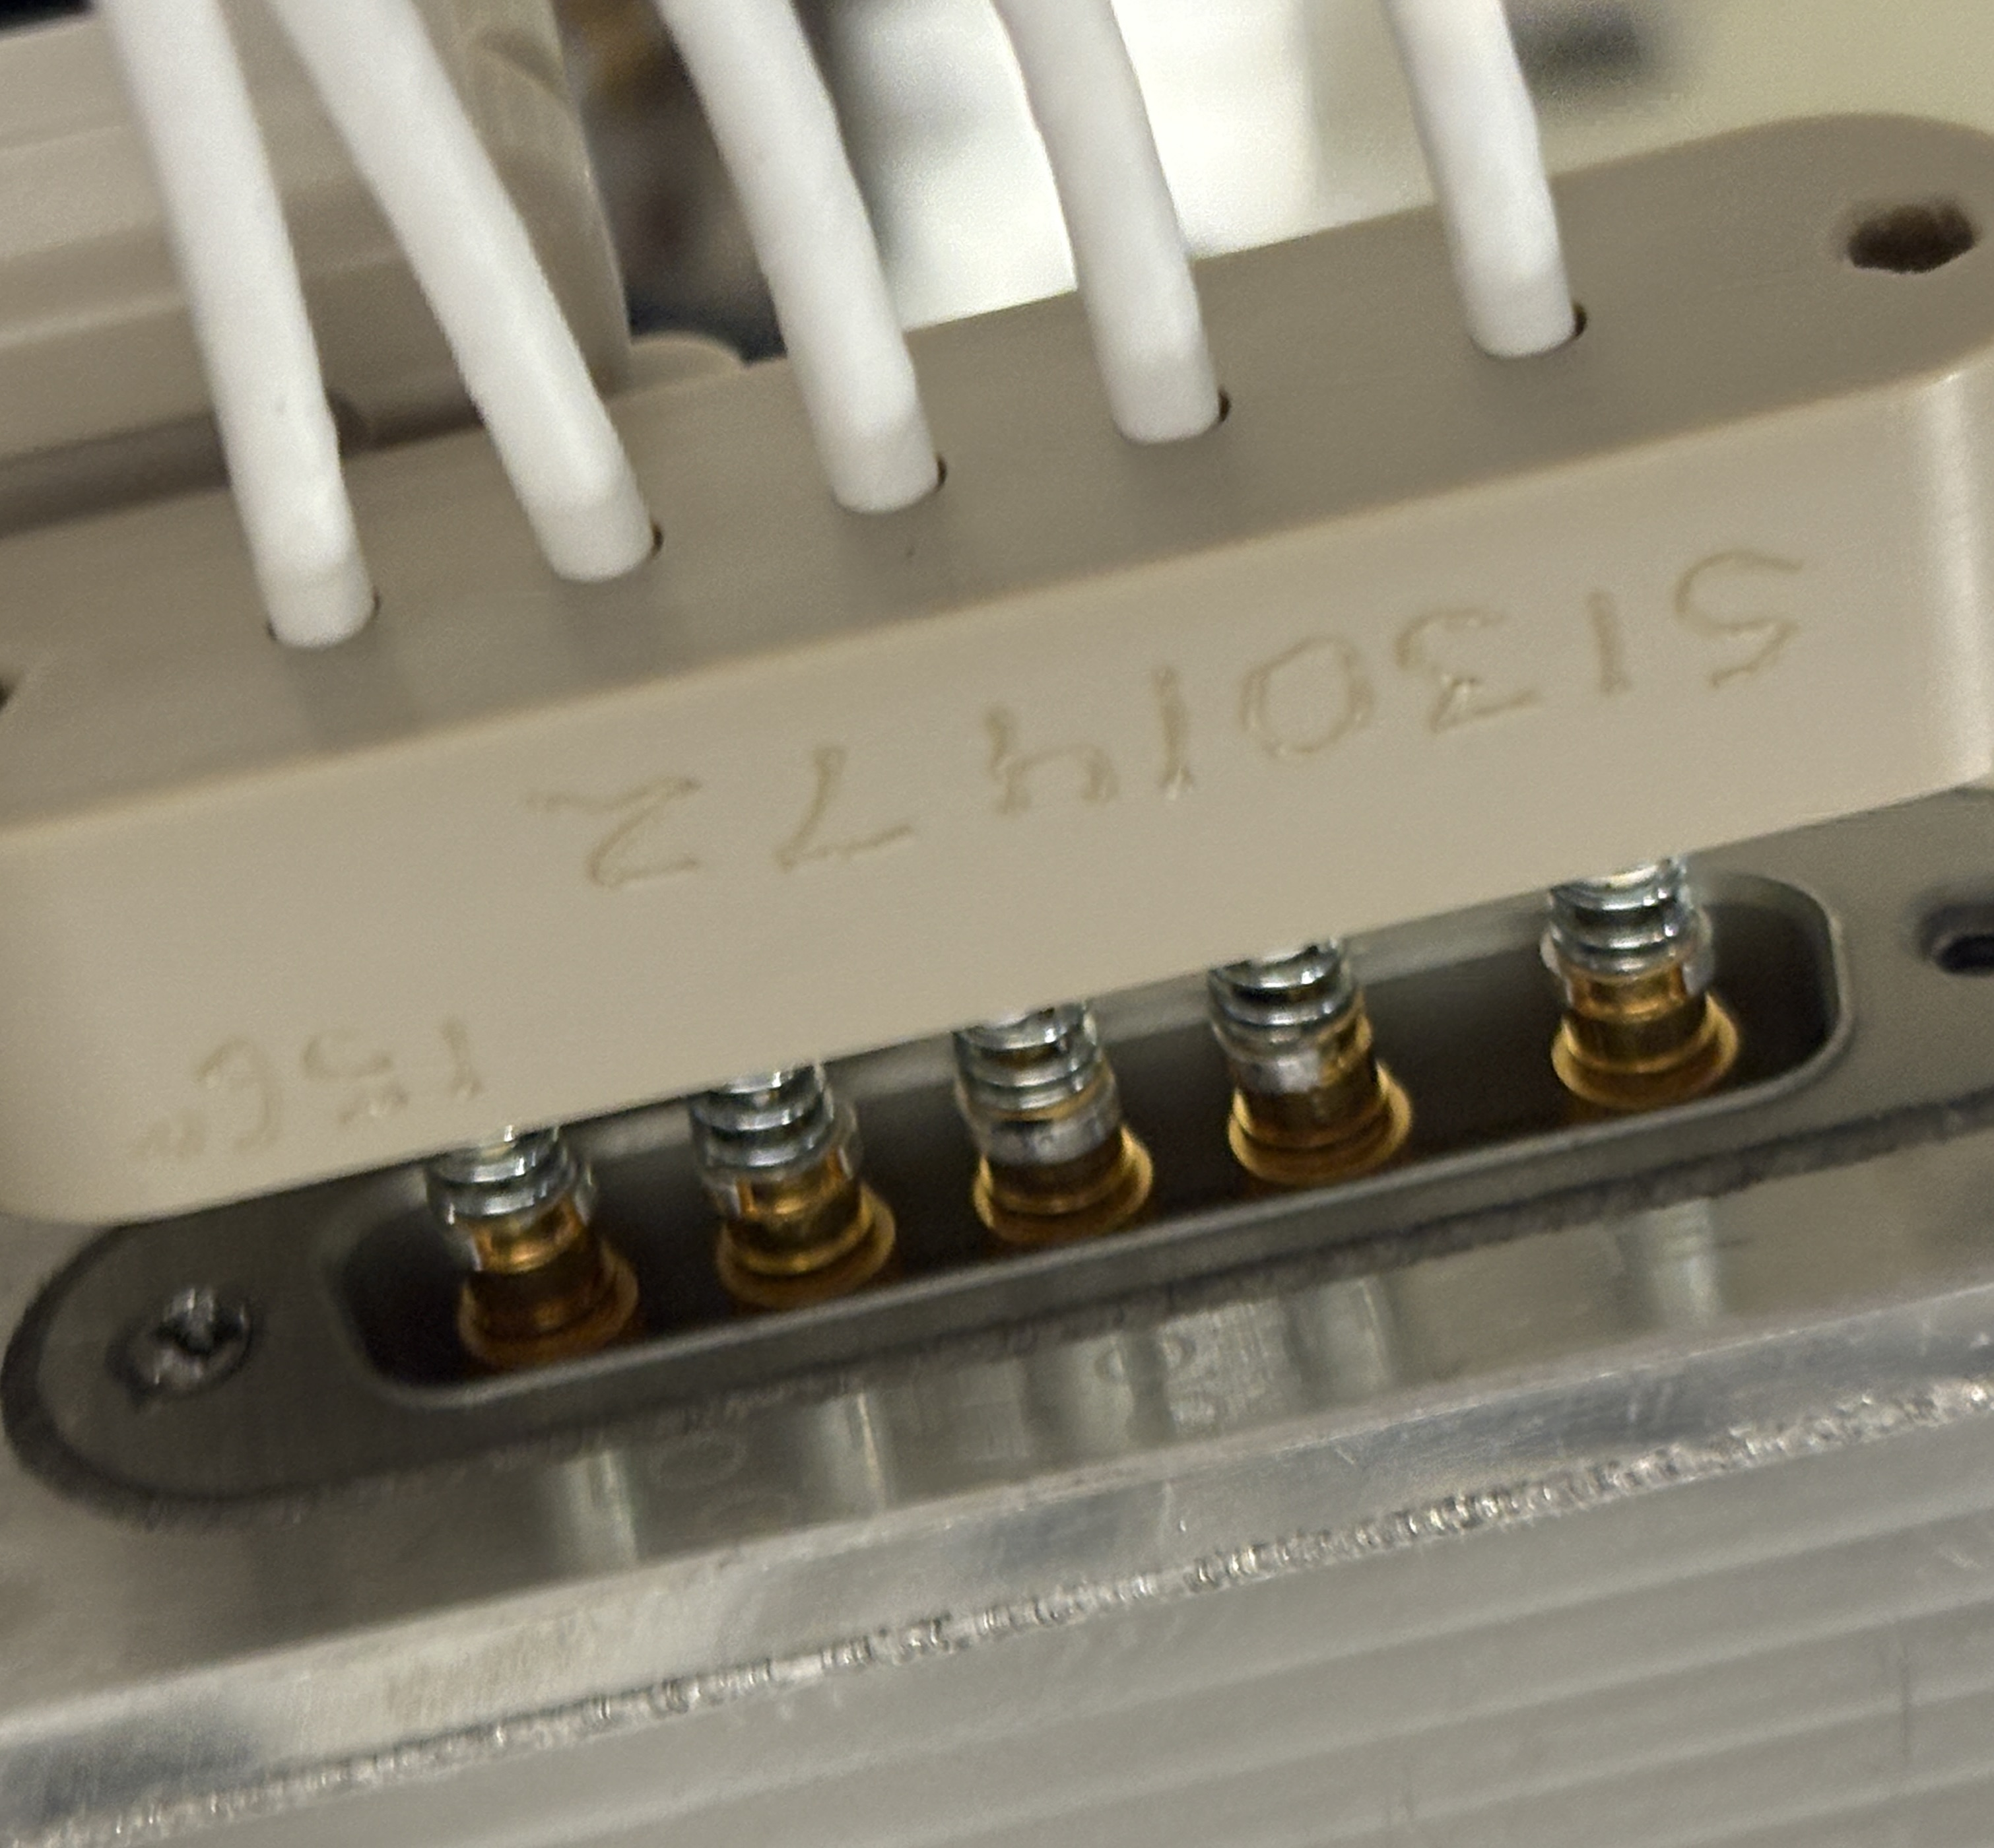
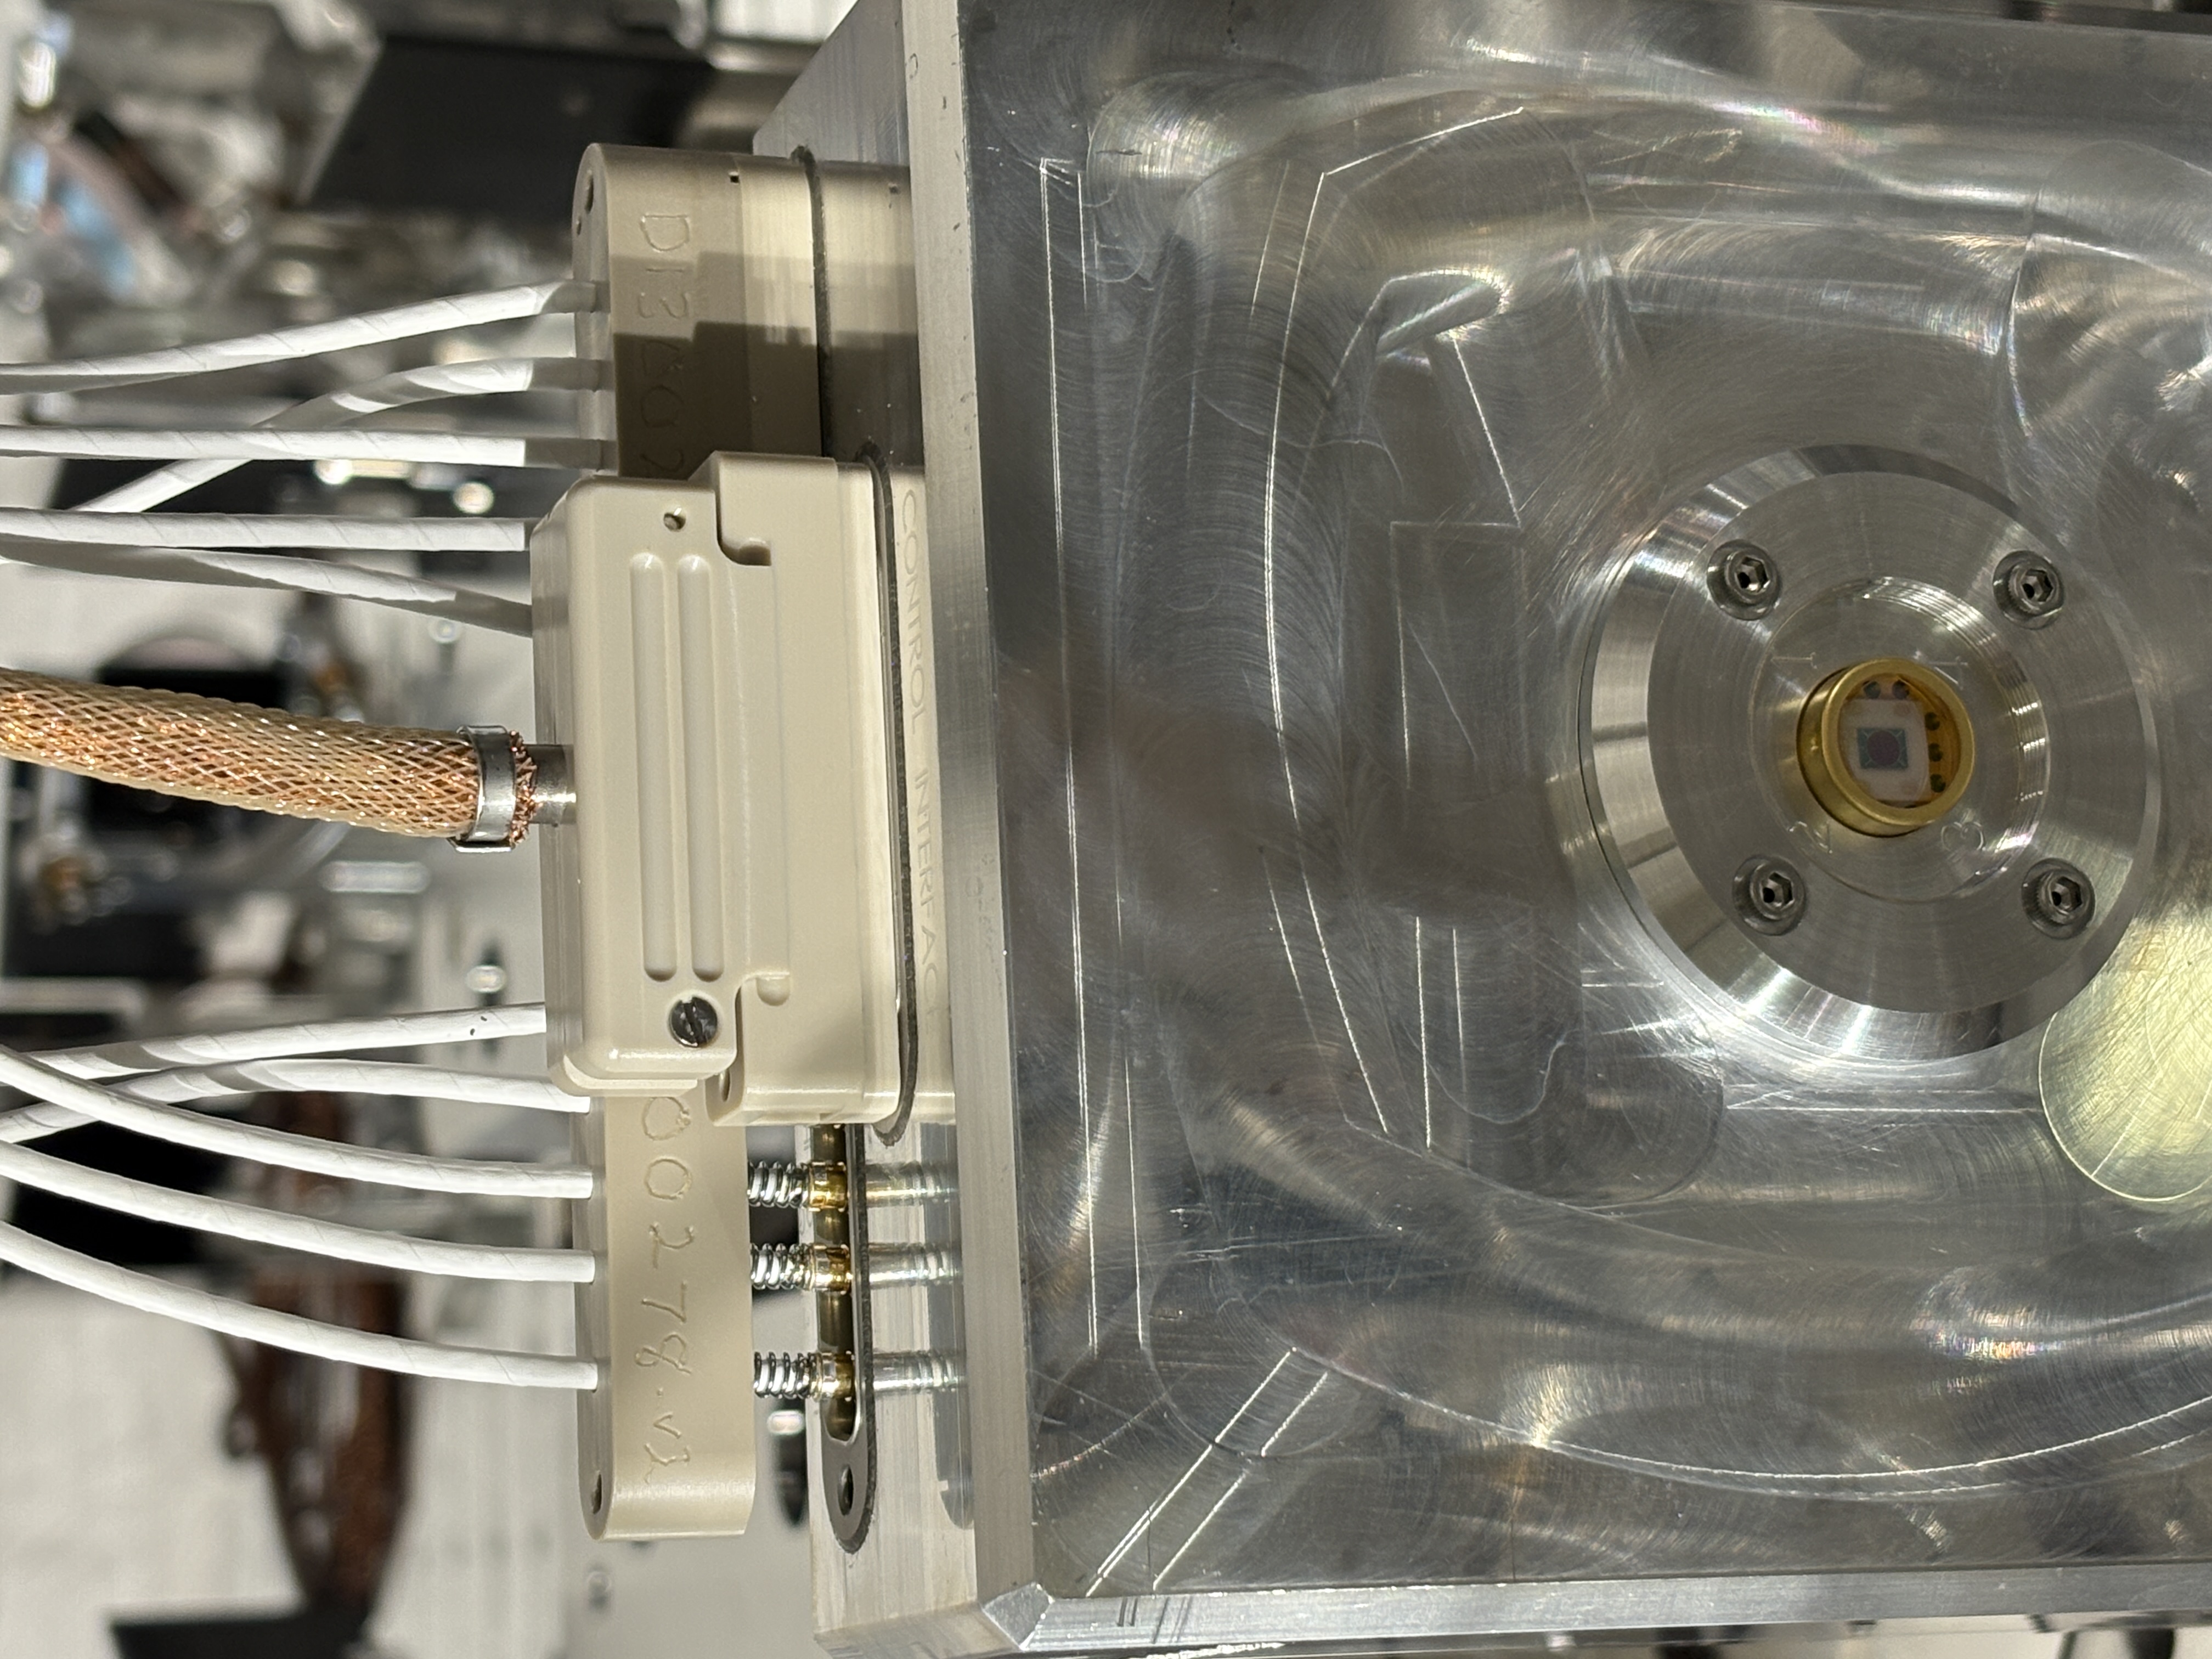
On Friday, the crew in HAM1 had some issues with the cable connections to ASC WFS_A and ASC WFC_B per alog 84239. Camilla and Gerardo already performed some of the same helicoil issue rework last week on one of the POP boxes (we found the helicoil sticking out of the top of the threads on the box and the connector not seated right this whole time), and I have had to do some cable fastener repair on a feedthru and some cables this vent already. So, seems the helicoils installed in the diode boxes ~10-15 yrs ago were likely too long or something causing all the grief. Back to todays repairs: WFS_B had a connector screw broken off in the diode box, WFS_A had a cable that the helicoil from the box came off with the screw in the connector and then got trapped. Camilla and I fussed the with "easier" one first, stripping the helicoil off the screw on the free cable end, carefully disassembling the cable RF connector and to remove the now damaged screw and installed a new one. We also reinstalled a new helicoil in the box (4-40x1D), could not remove the tang, but the cable mated up fine. On WFS_B however, we attempted to do a half-screw extraction with an extraction wedge tool and a little IPA, no dice. These RF connections have a spring behind them and will not "snap" on as they are supposed to (none in this chamber really have). So, we tried using the 1 good screw and a series of zip ties (last pic) - but this broke on us once and we still couldn't get it tight enough to actually seem "good". Daniel, Camilla, Keita and I then decided to just remove half of the connector shell and push each connector in my hand as they are reportedly typically done in other fields. This worked and Daniel got all the signals back. The connection looks kind of funny, but the connector is really just a nicety to keep them all in order so job complete here.
Images attached to this report
LHO General (EPO, PEM, SEI)
corey.gray@LIGO.ORG - posted 16:02, Monday 05 May 2025 (84262)
End Station Wind Fence Status: EY Done, EX Started, But Ground Too Soft

(CoreyG, MitchR, RandyT, JimW)

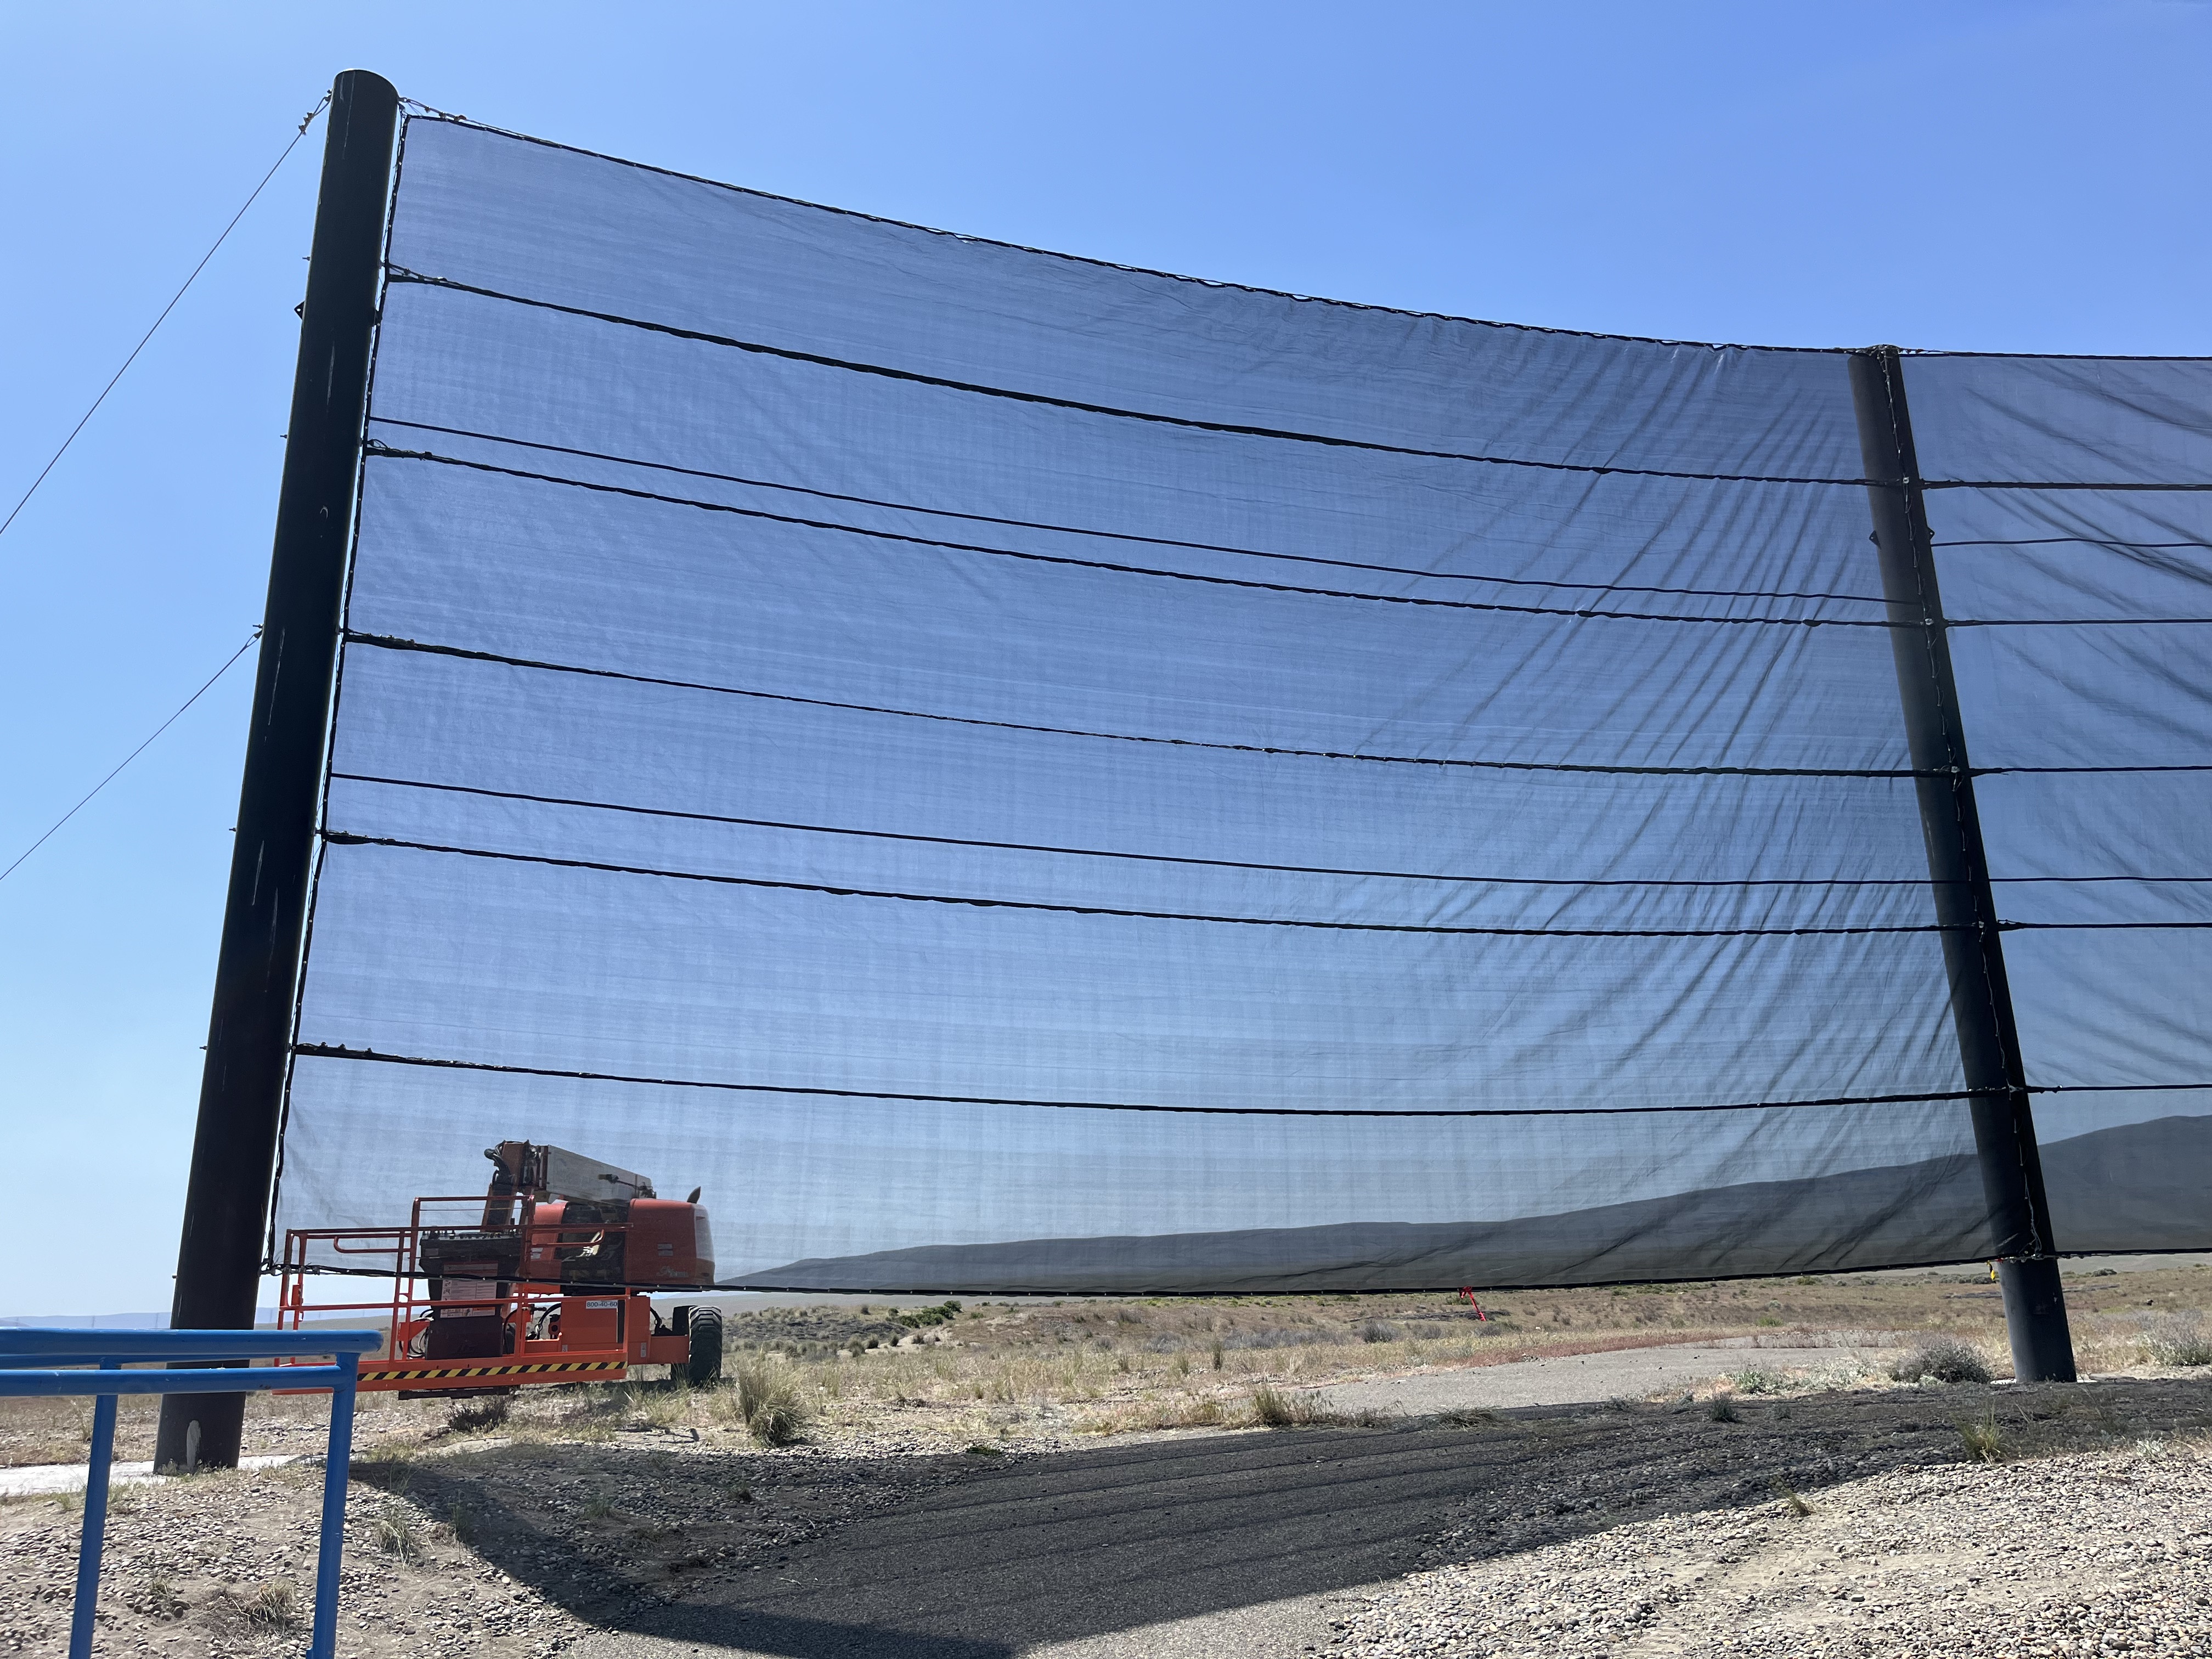
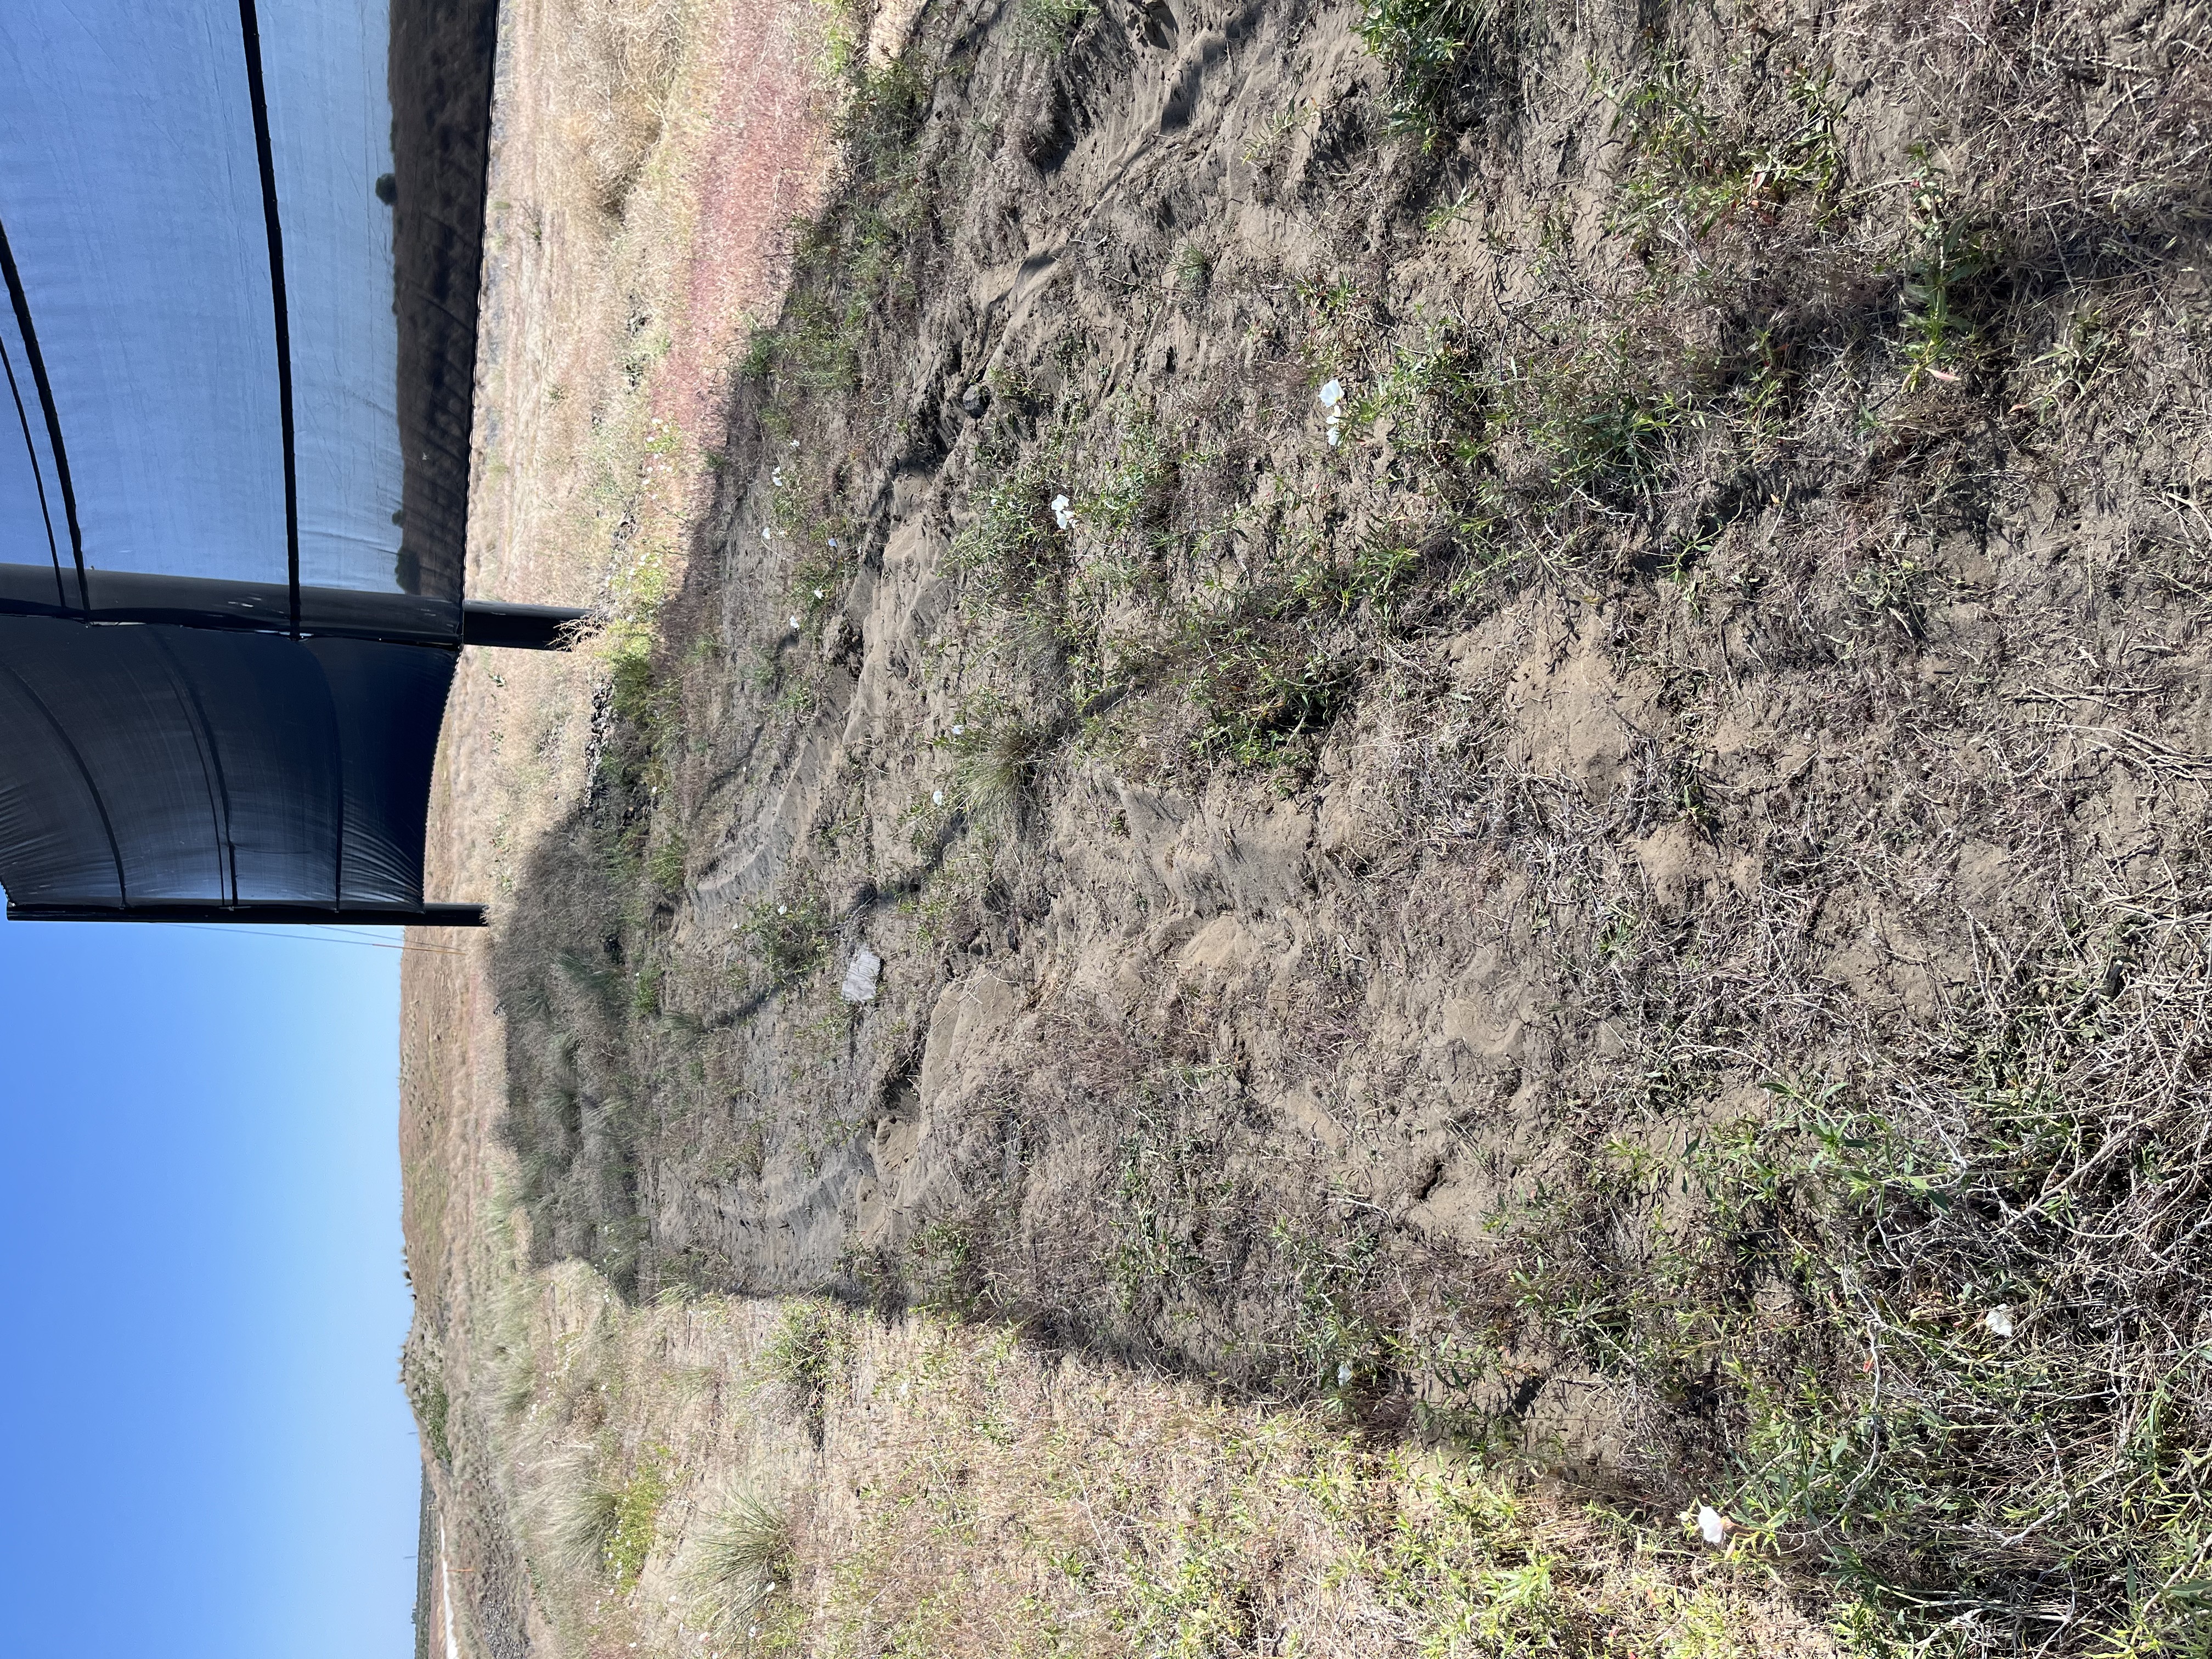
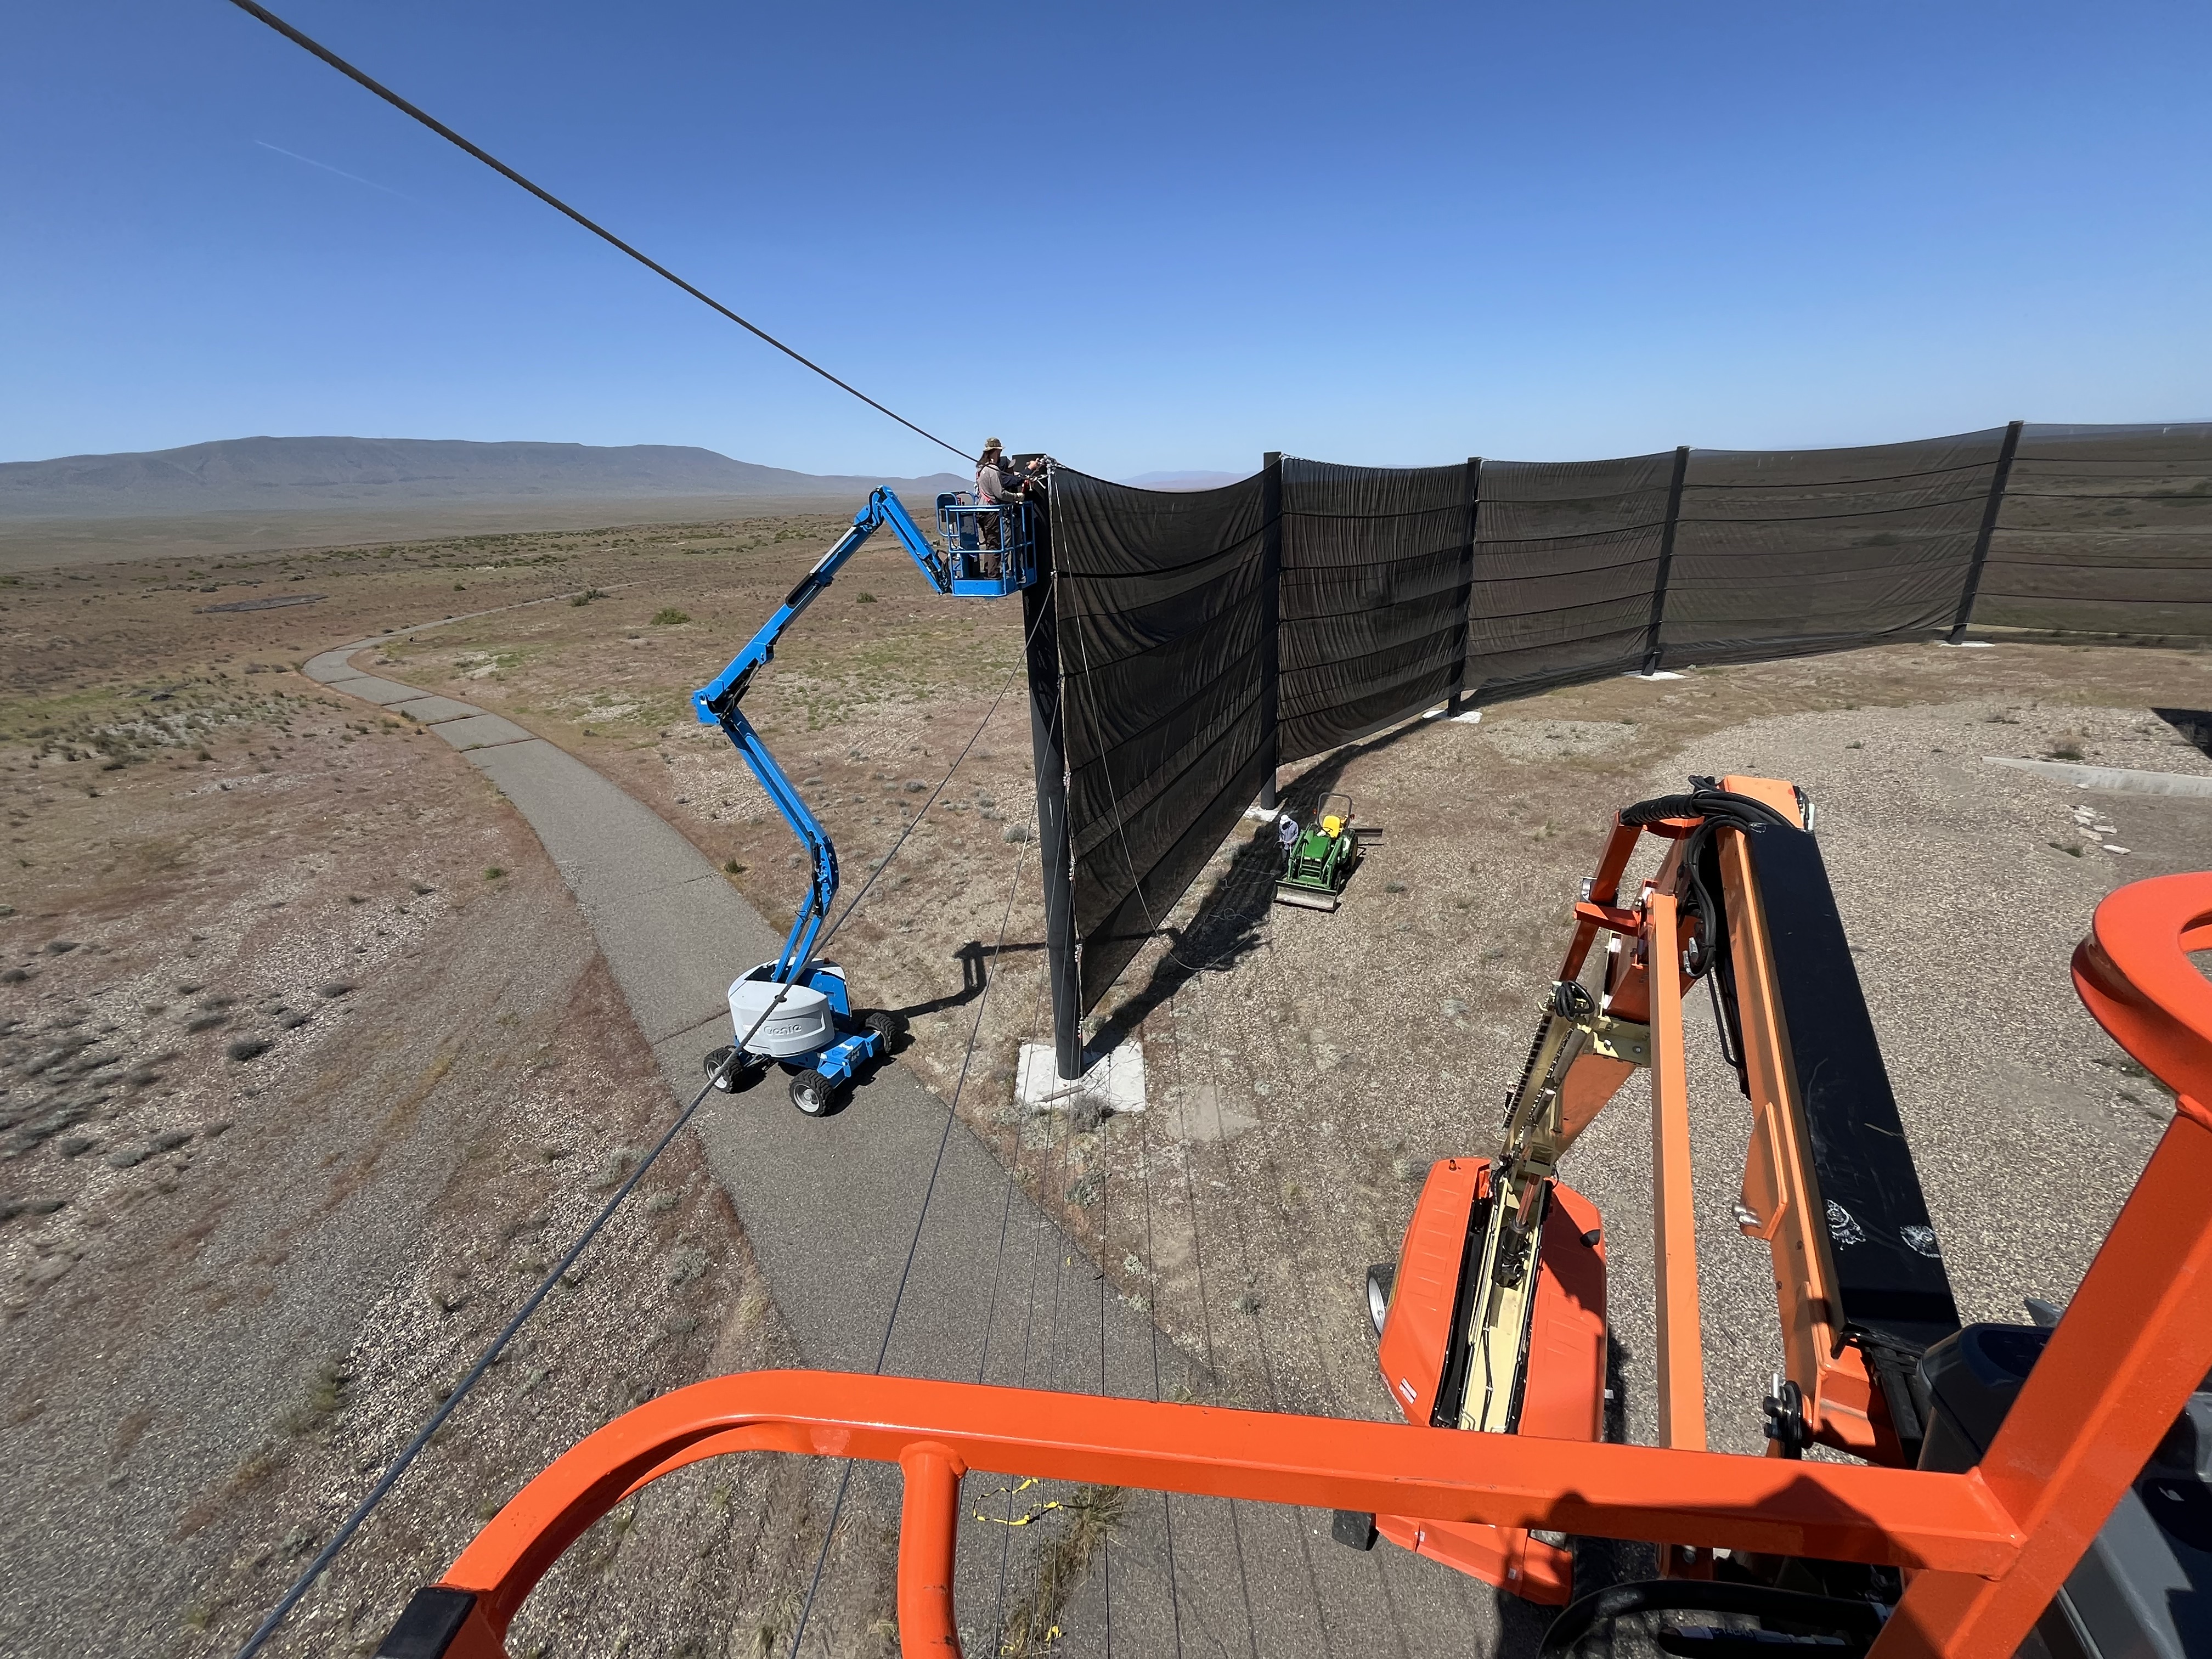
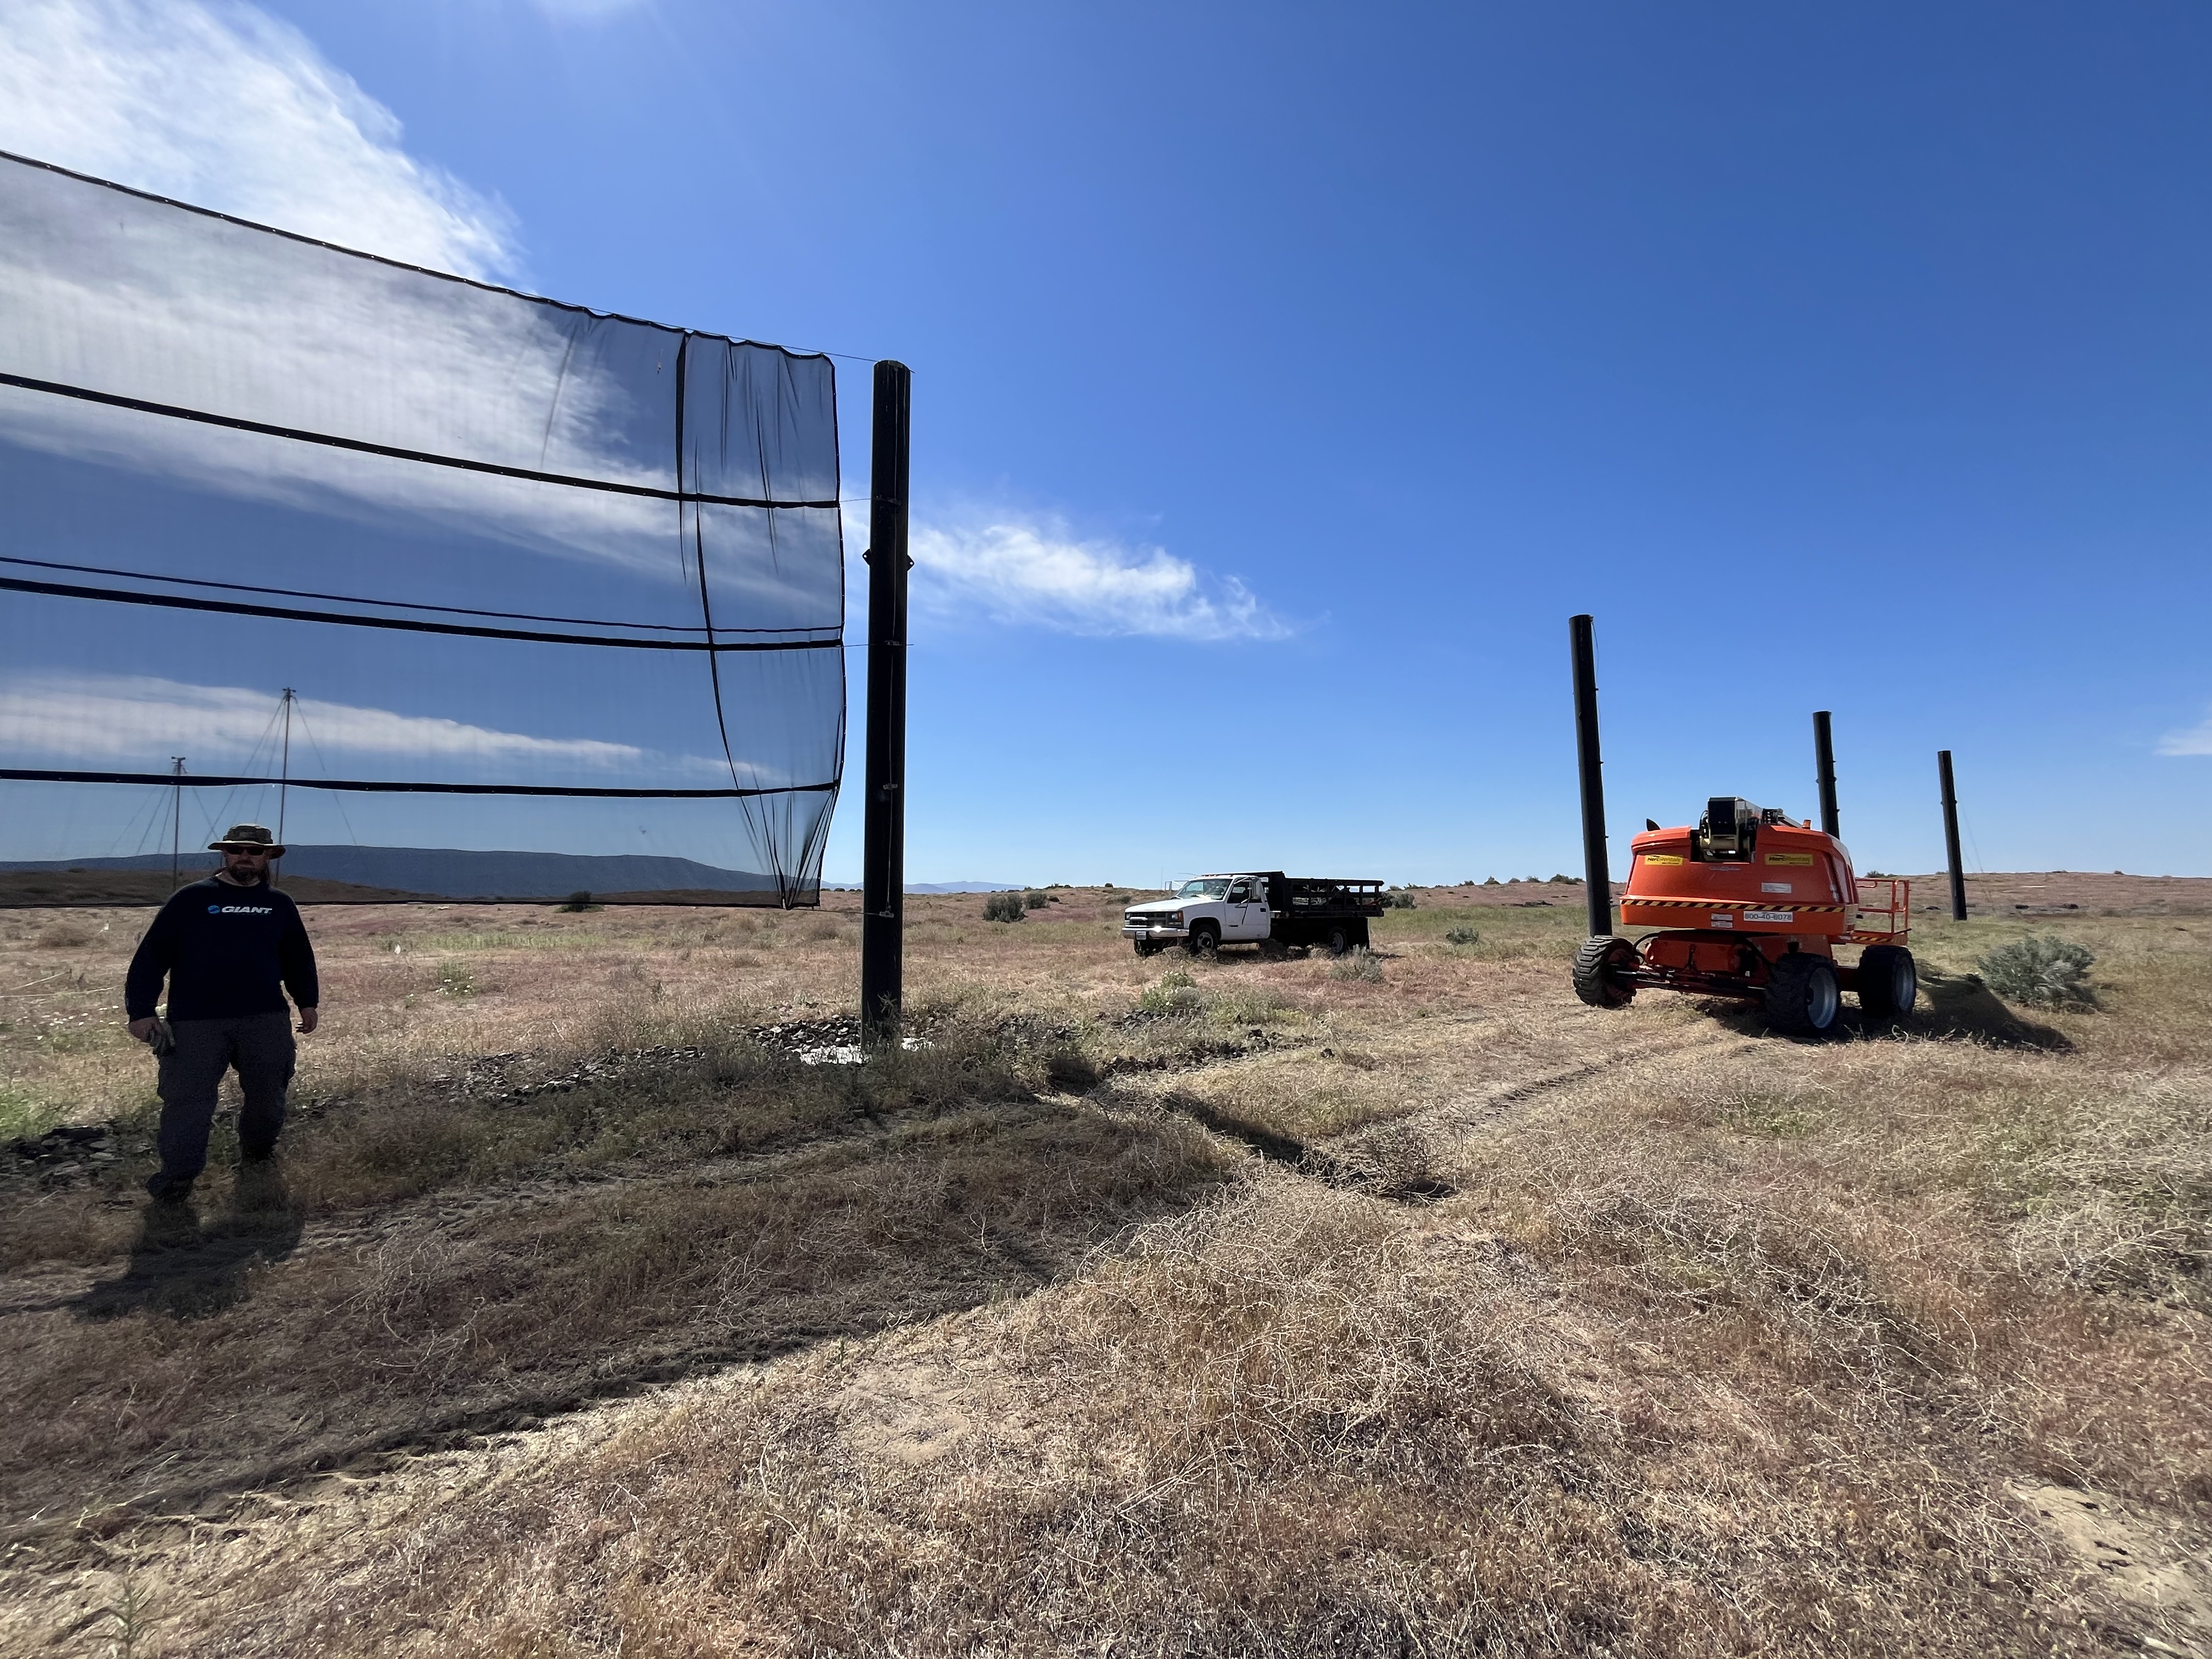
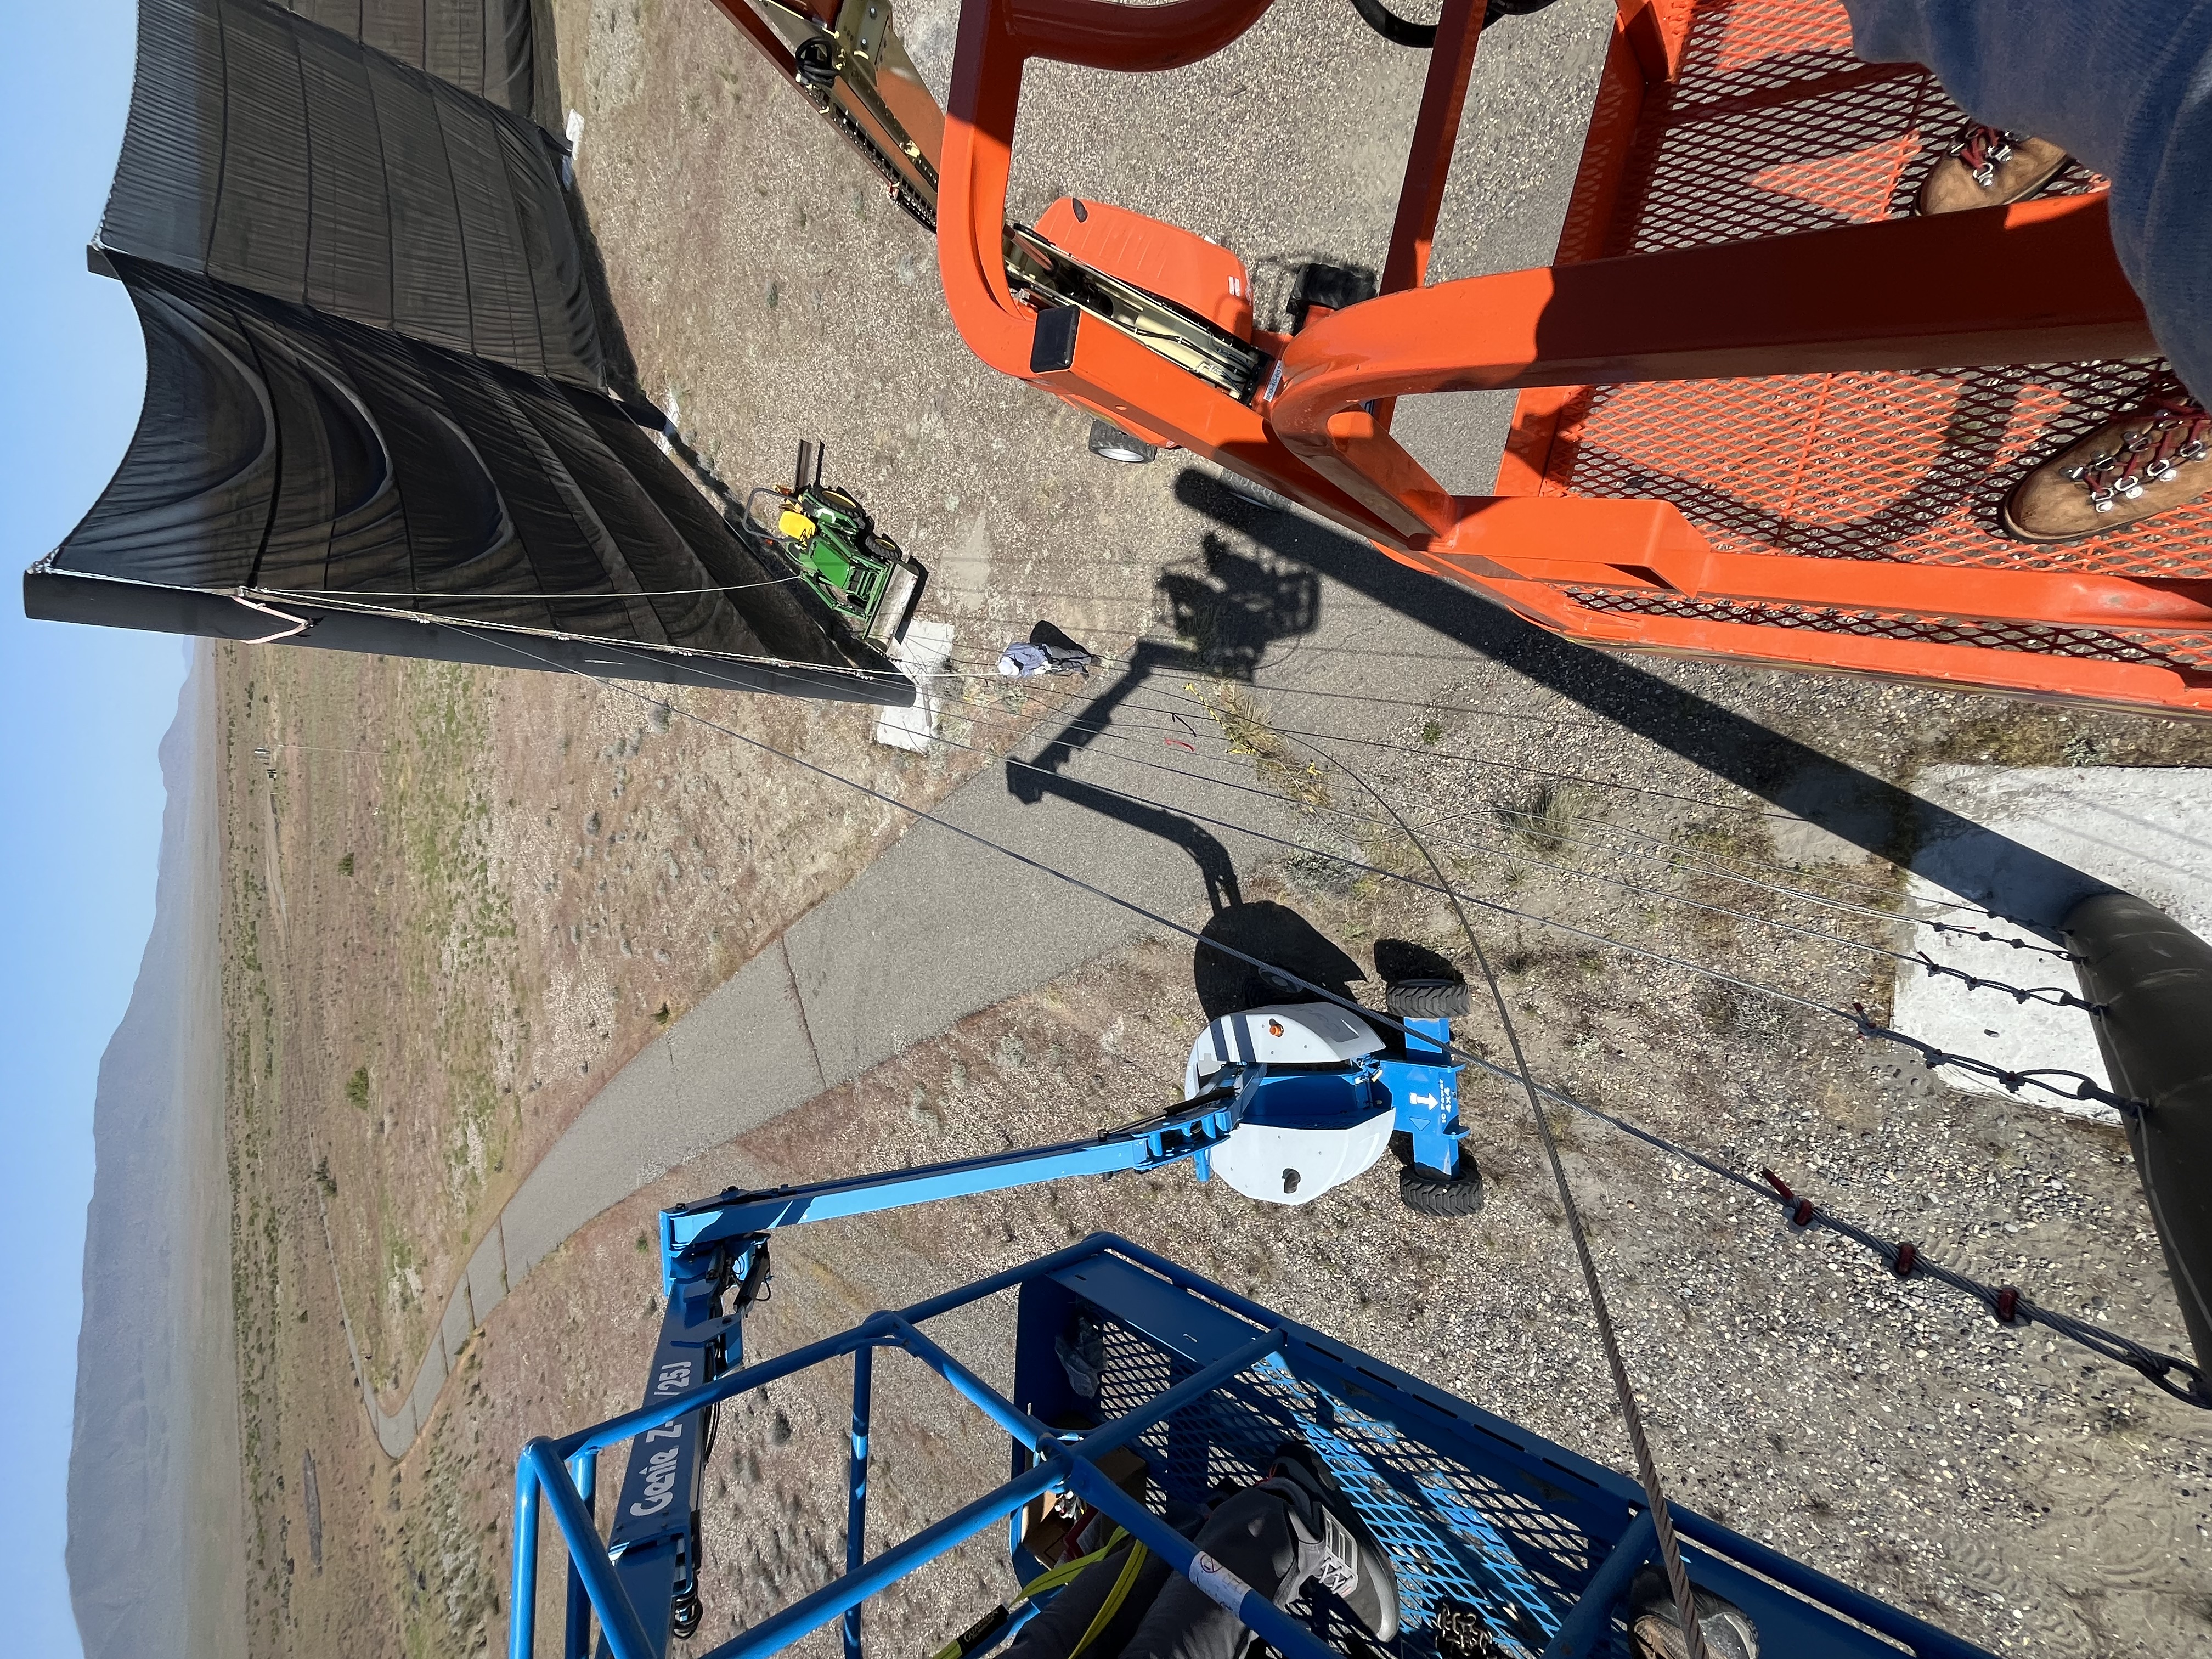
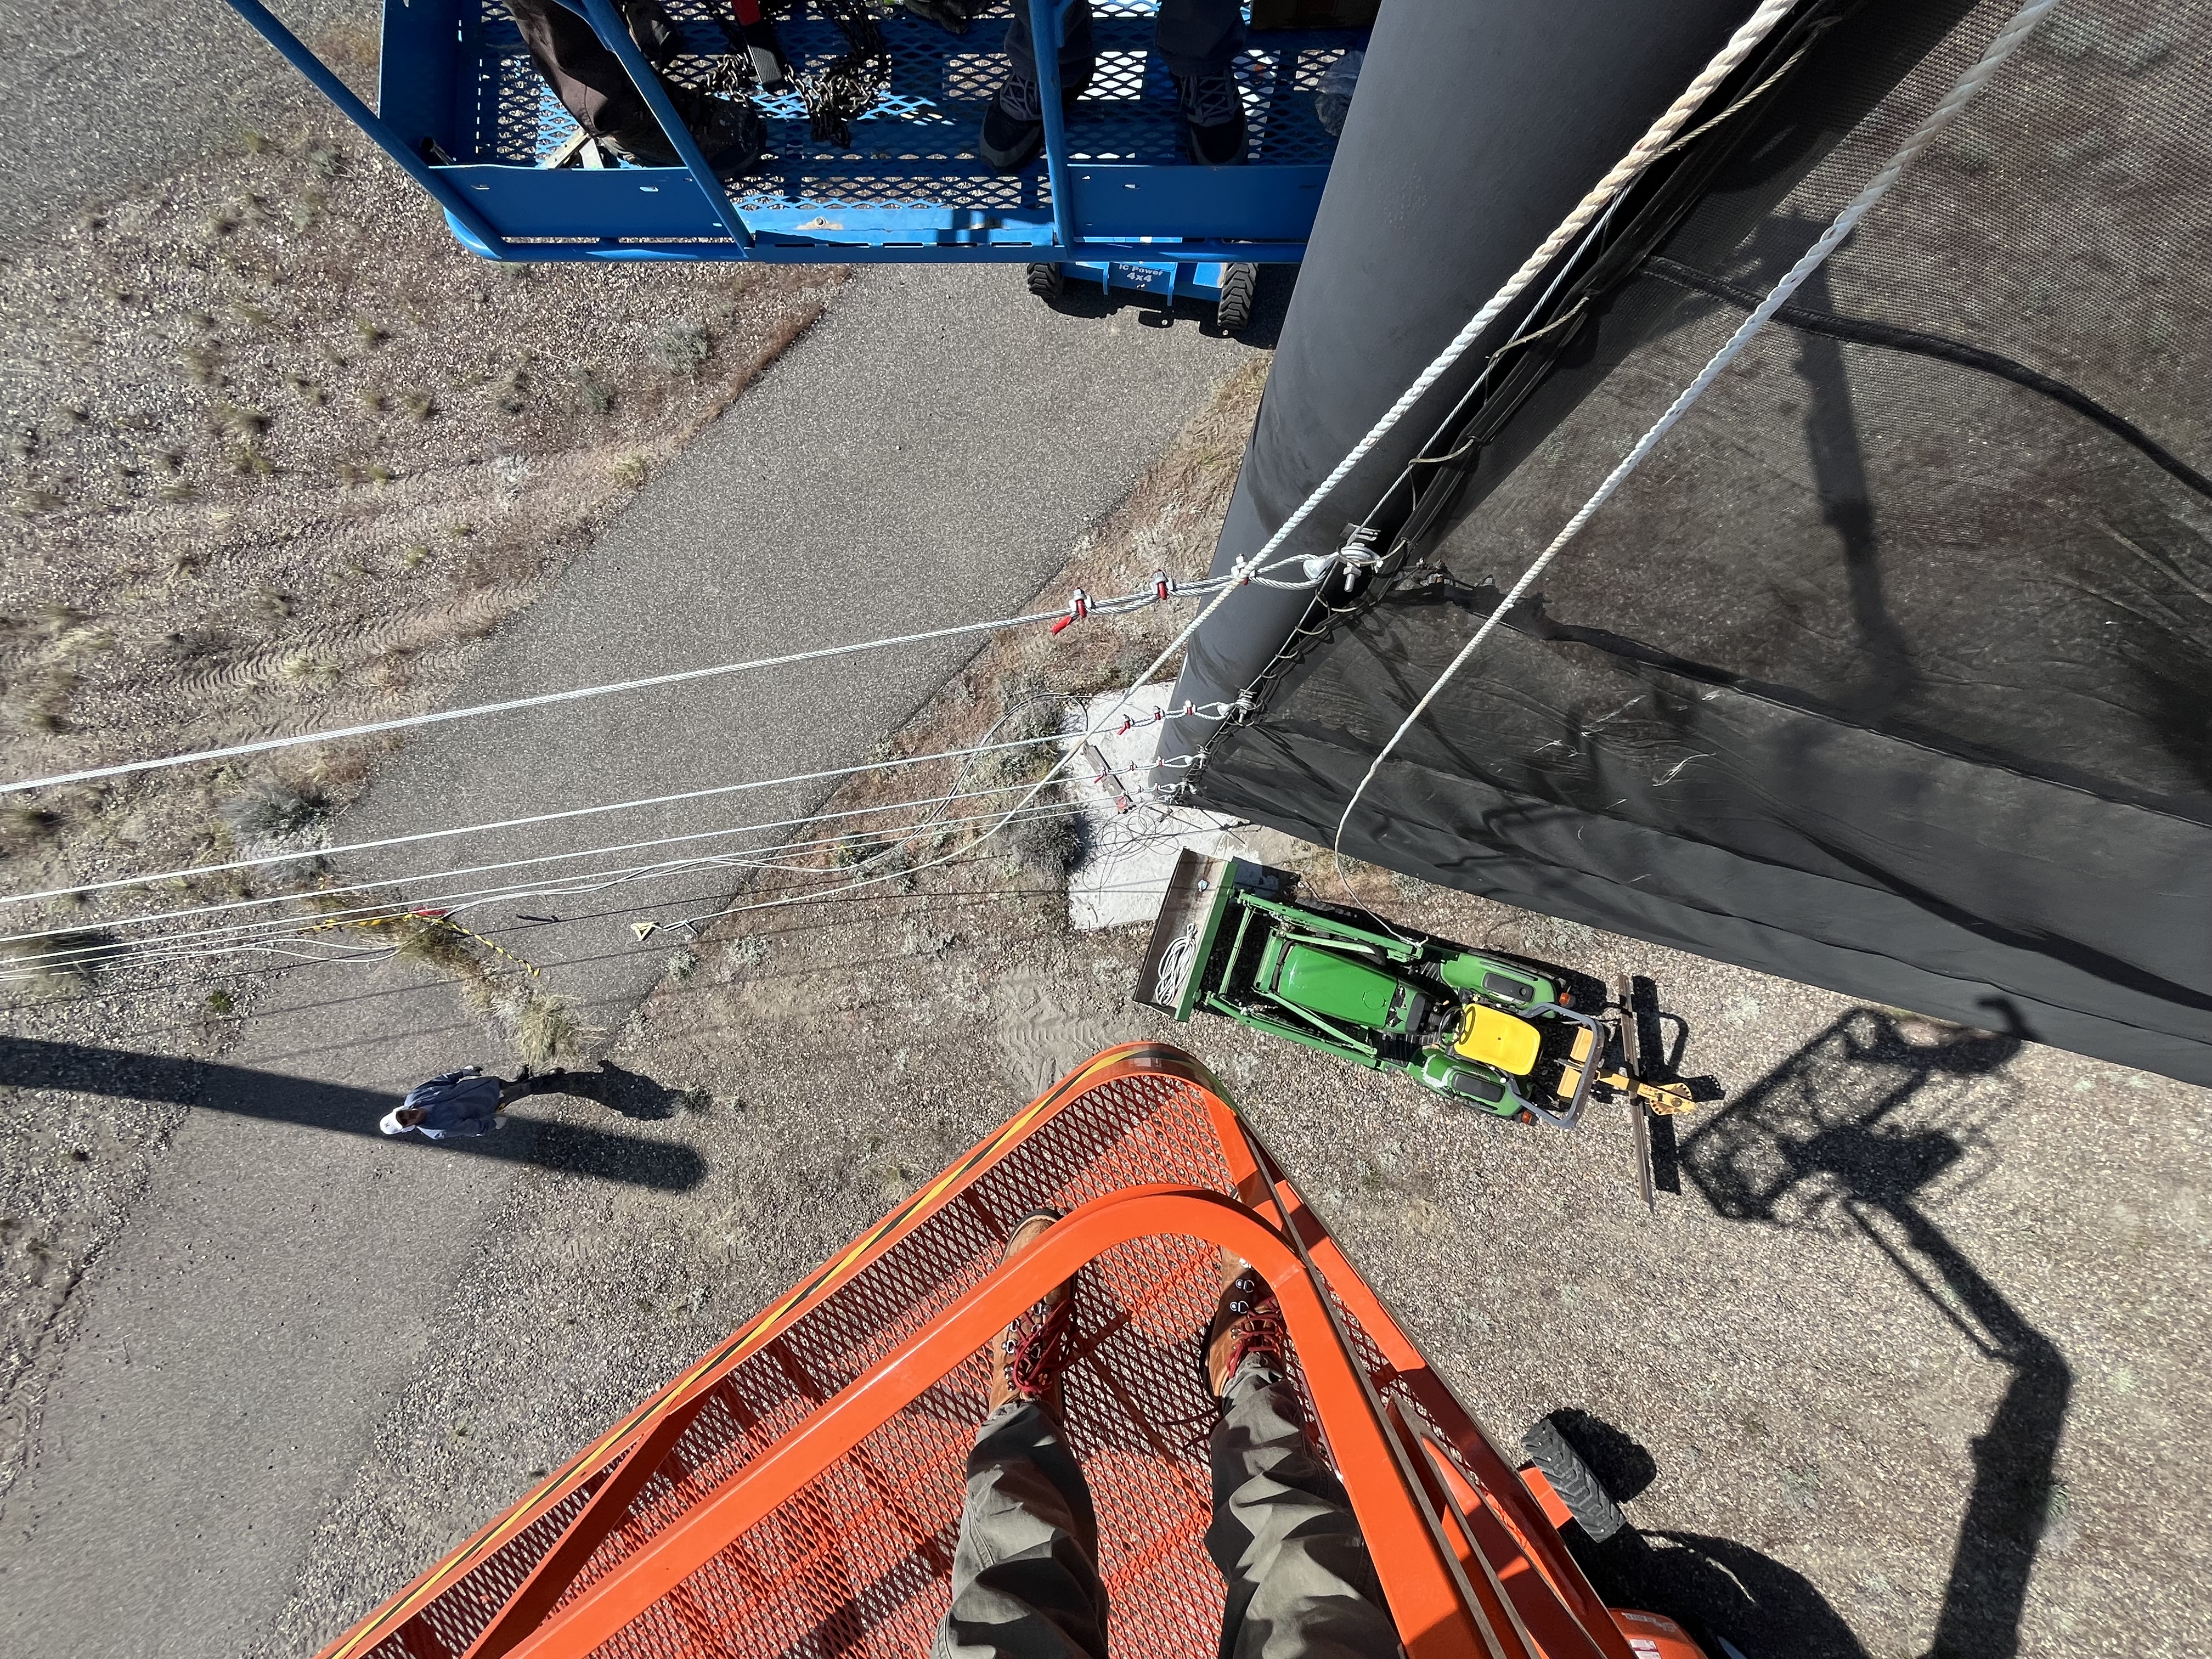
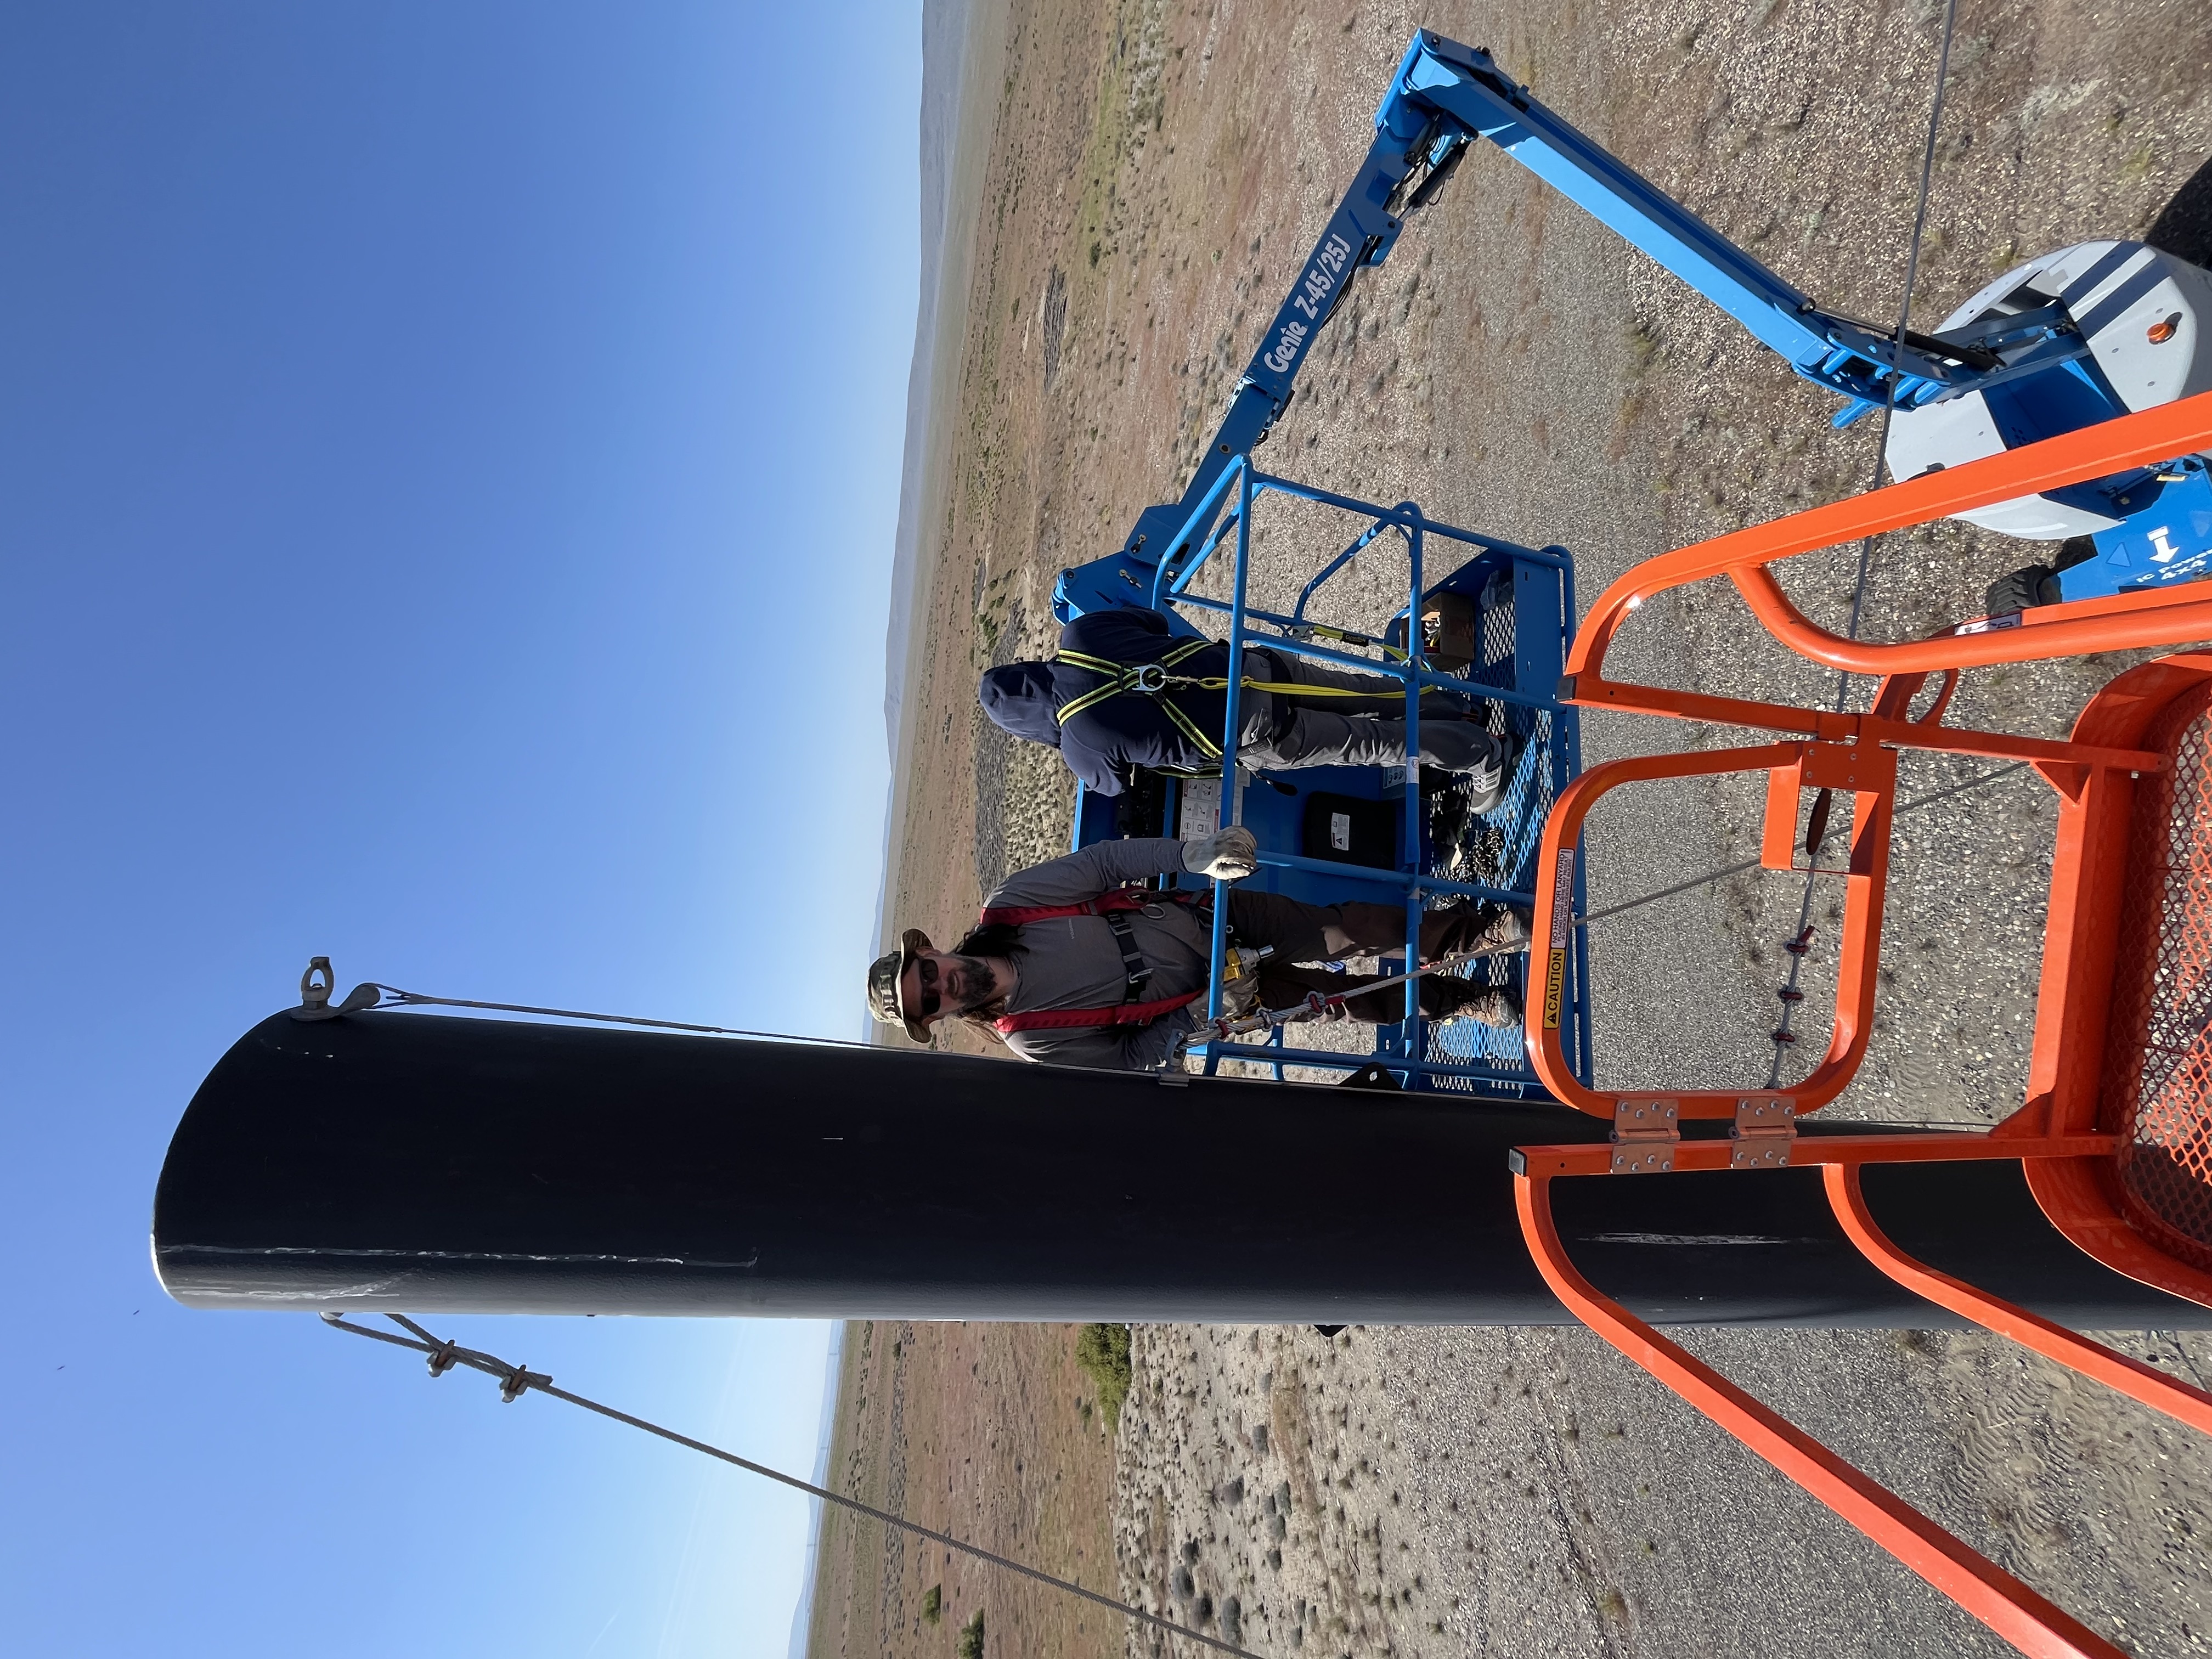
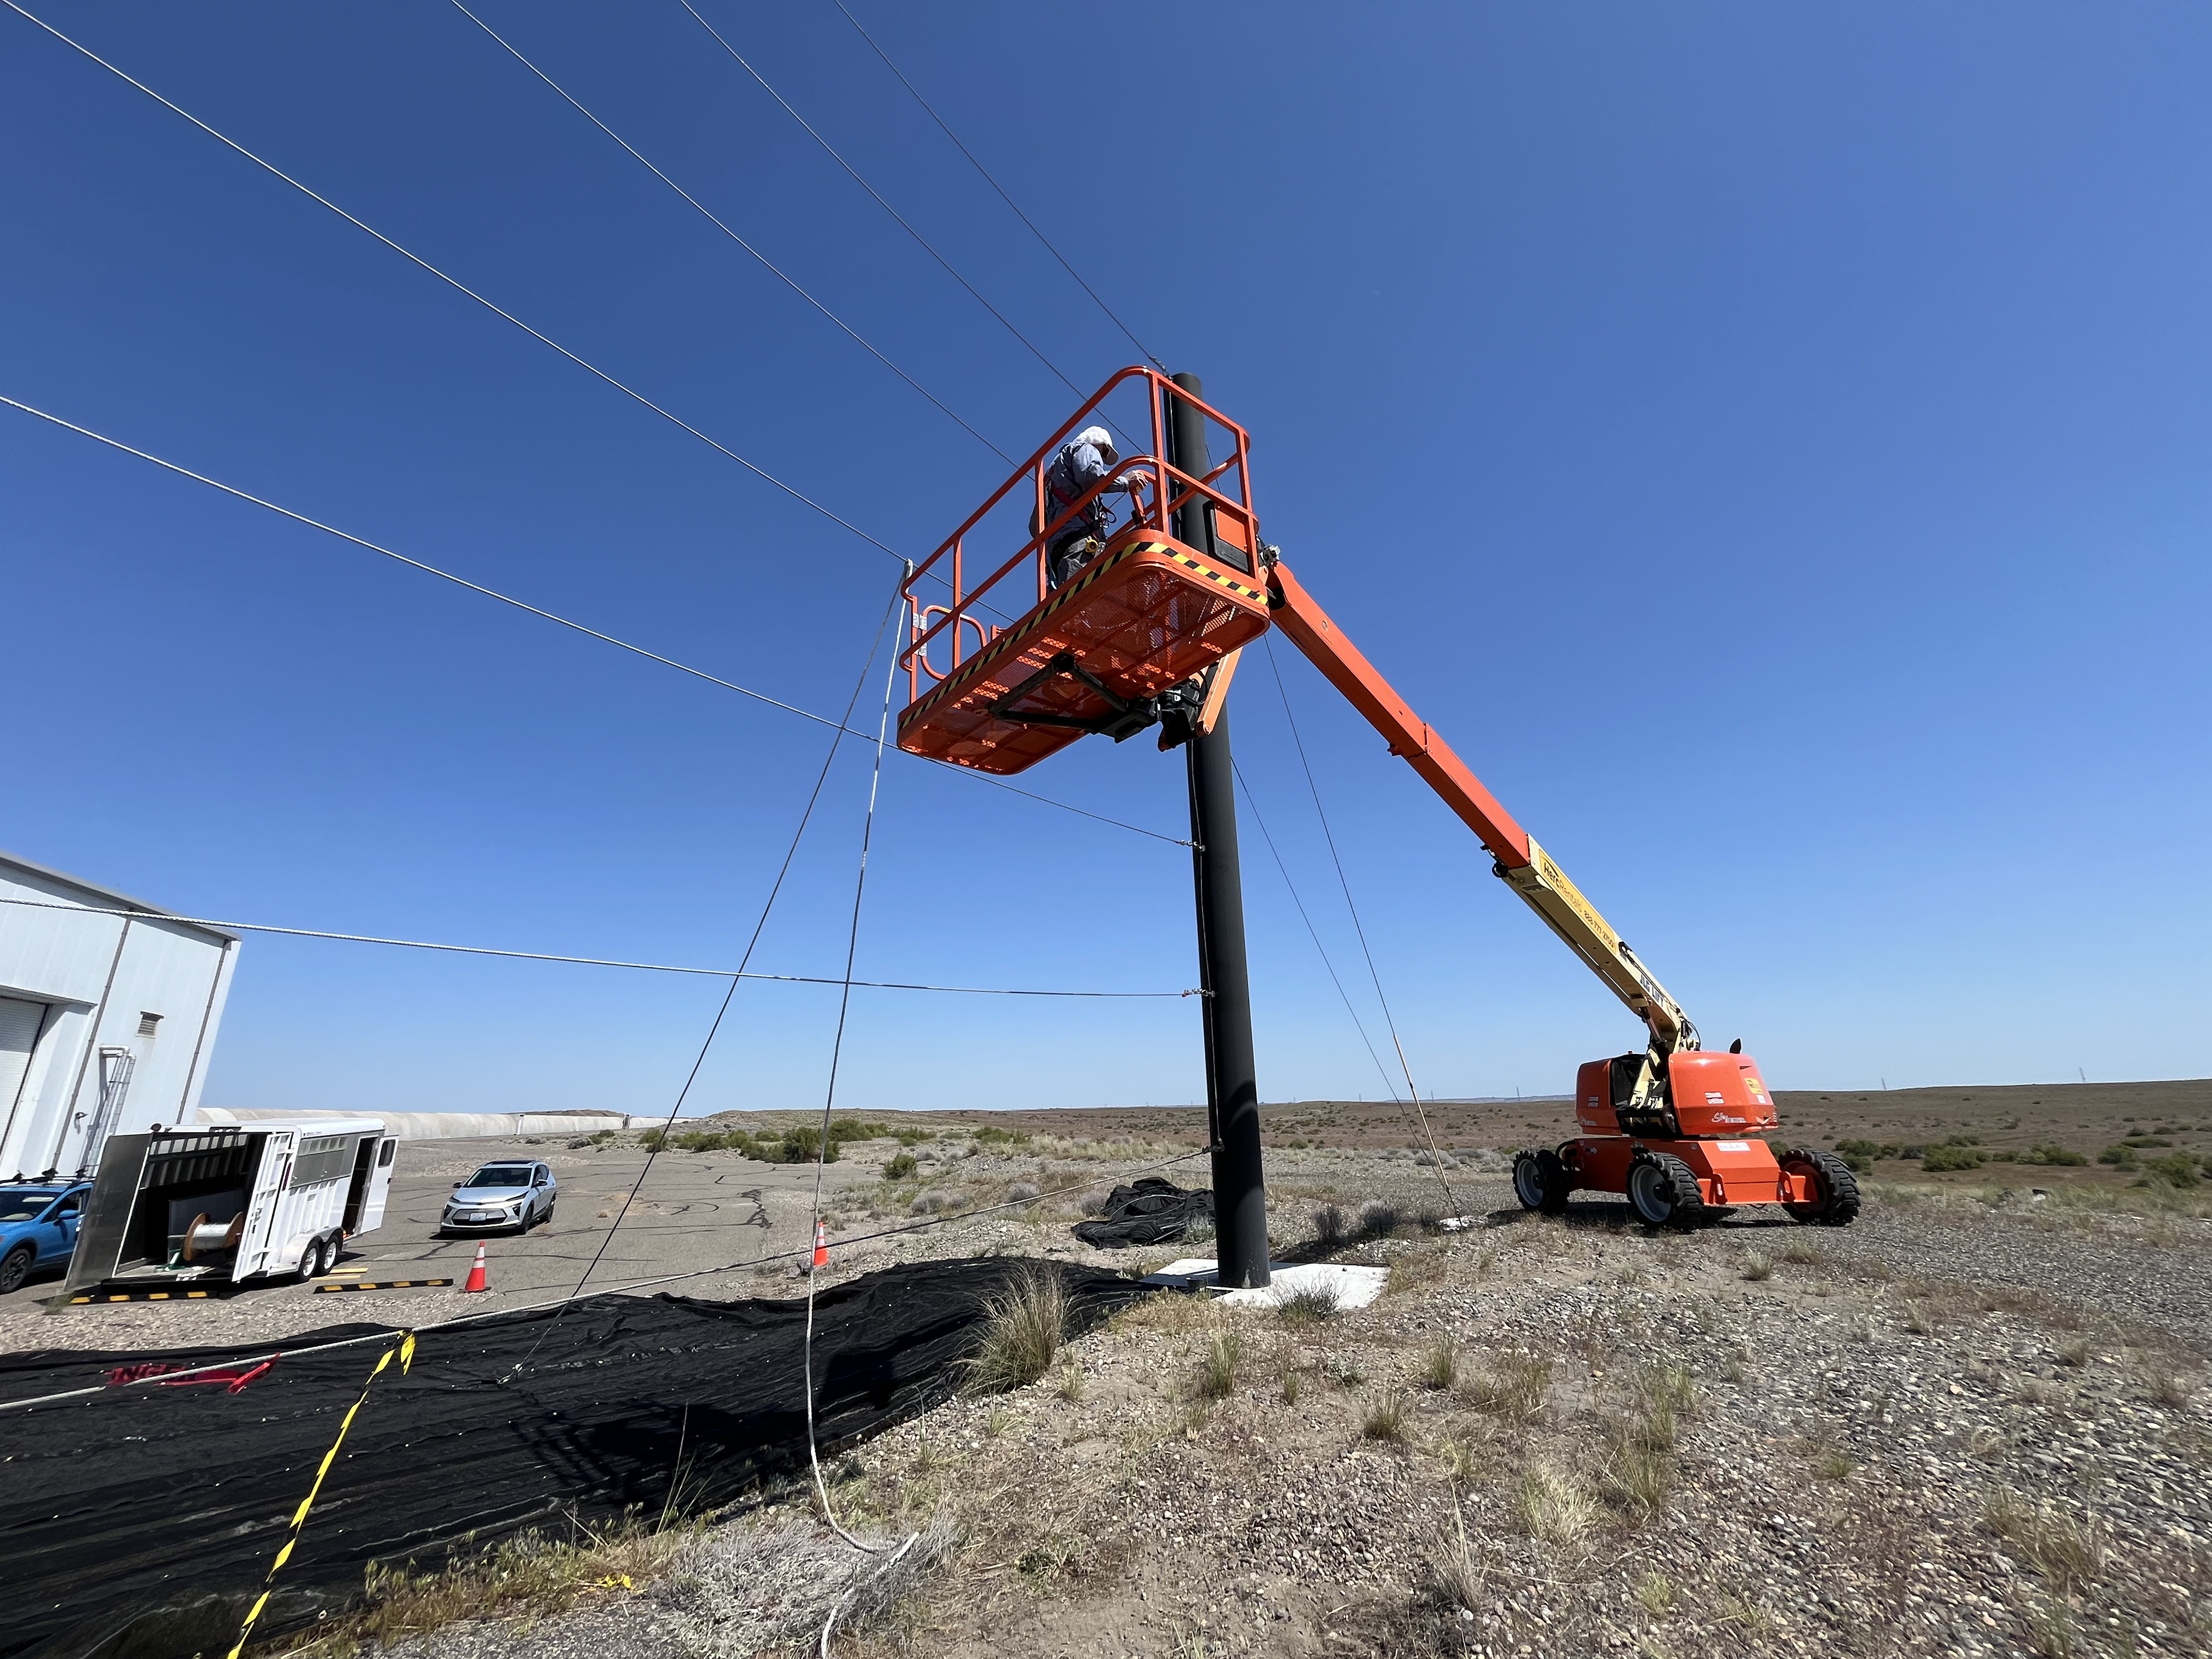
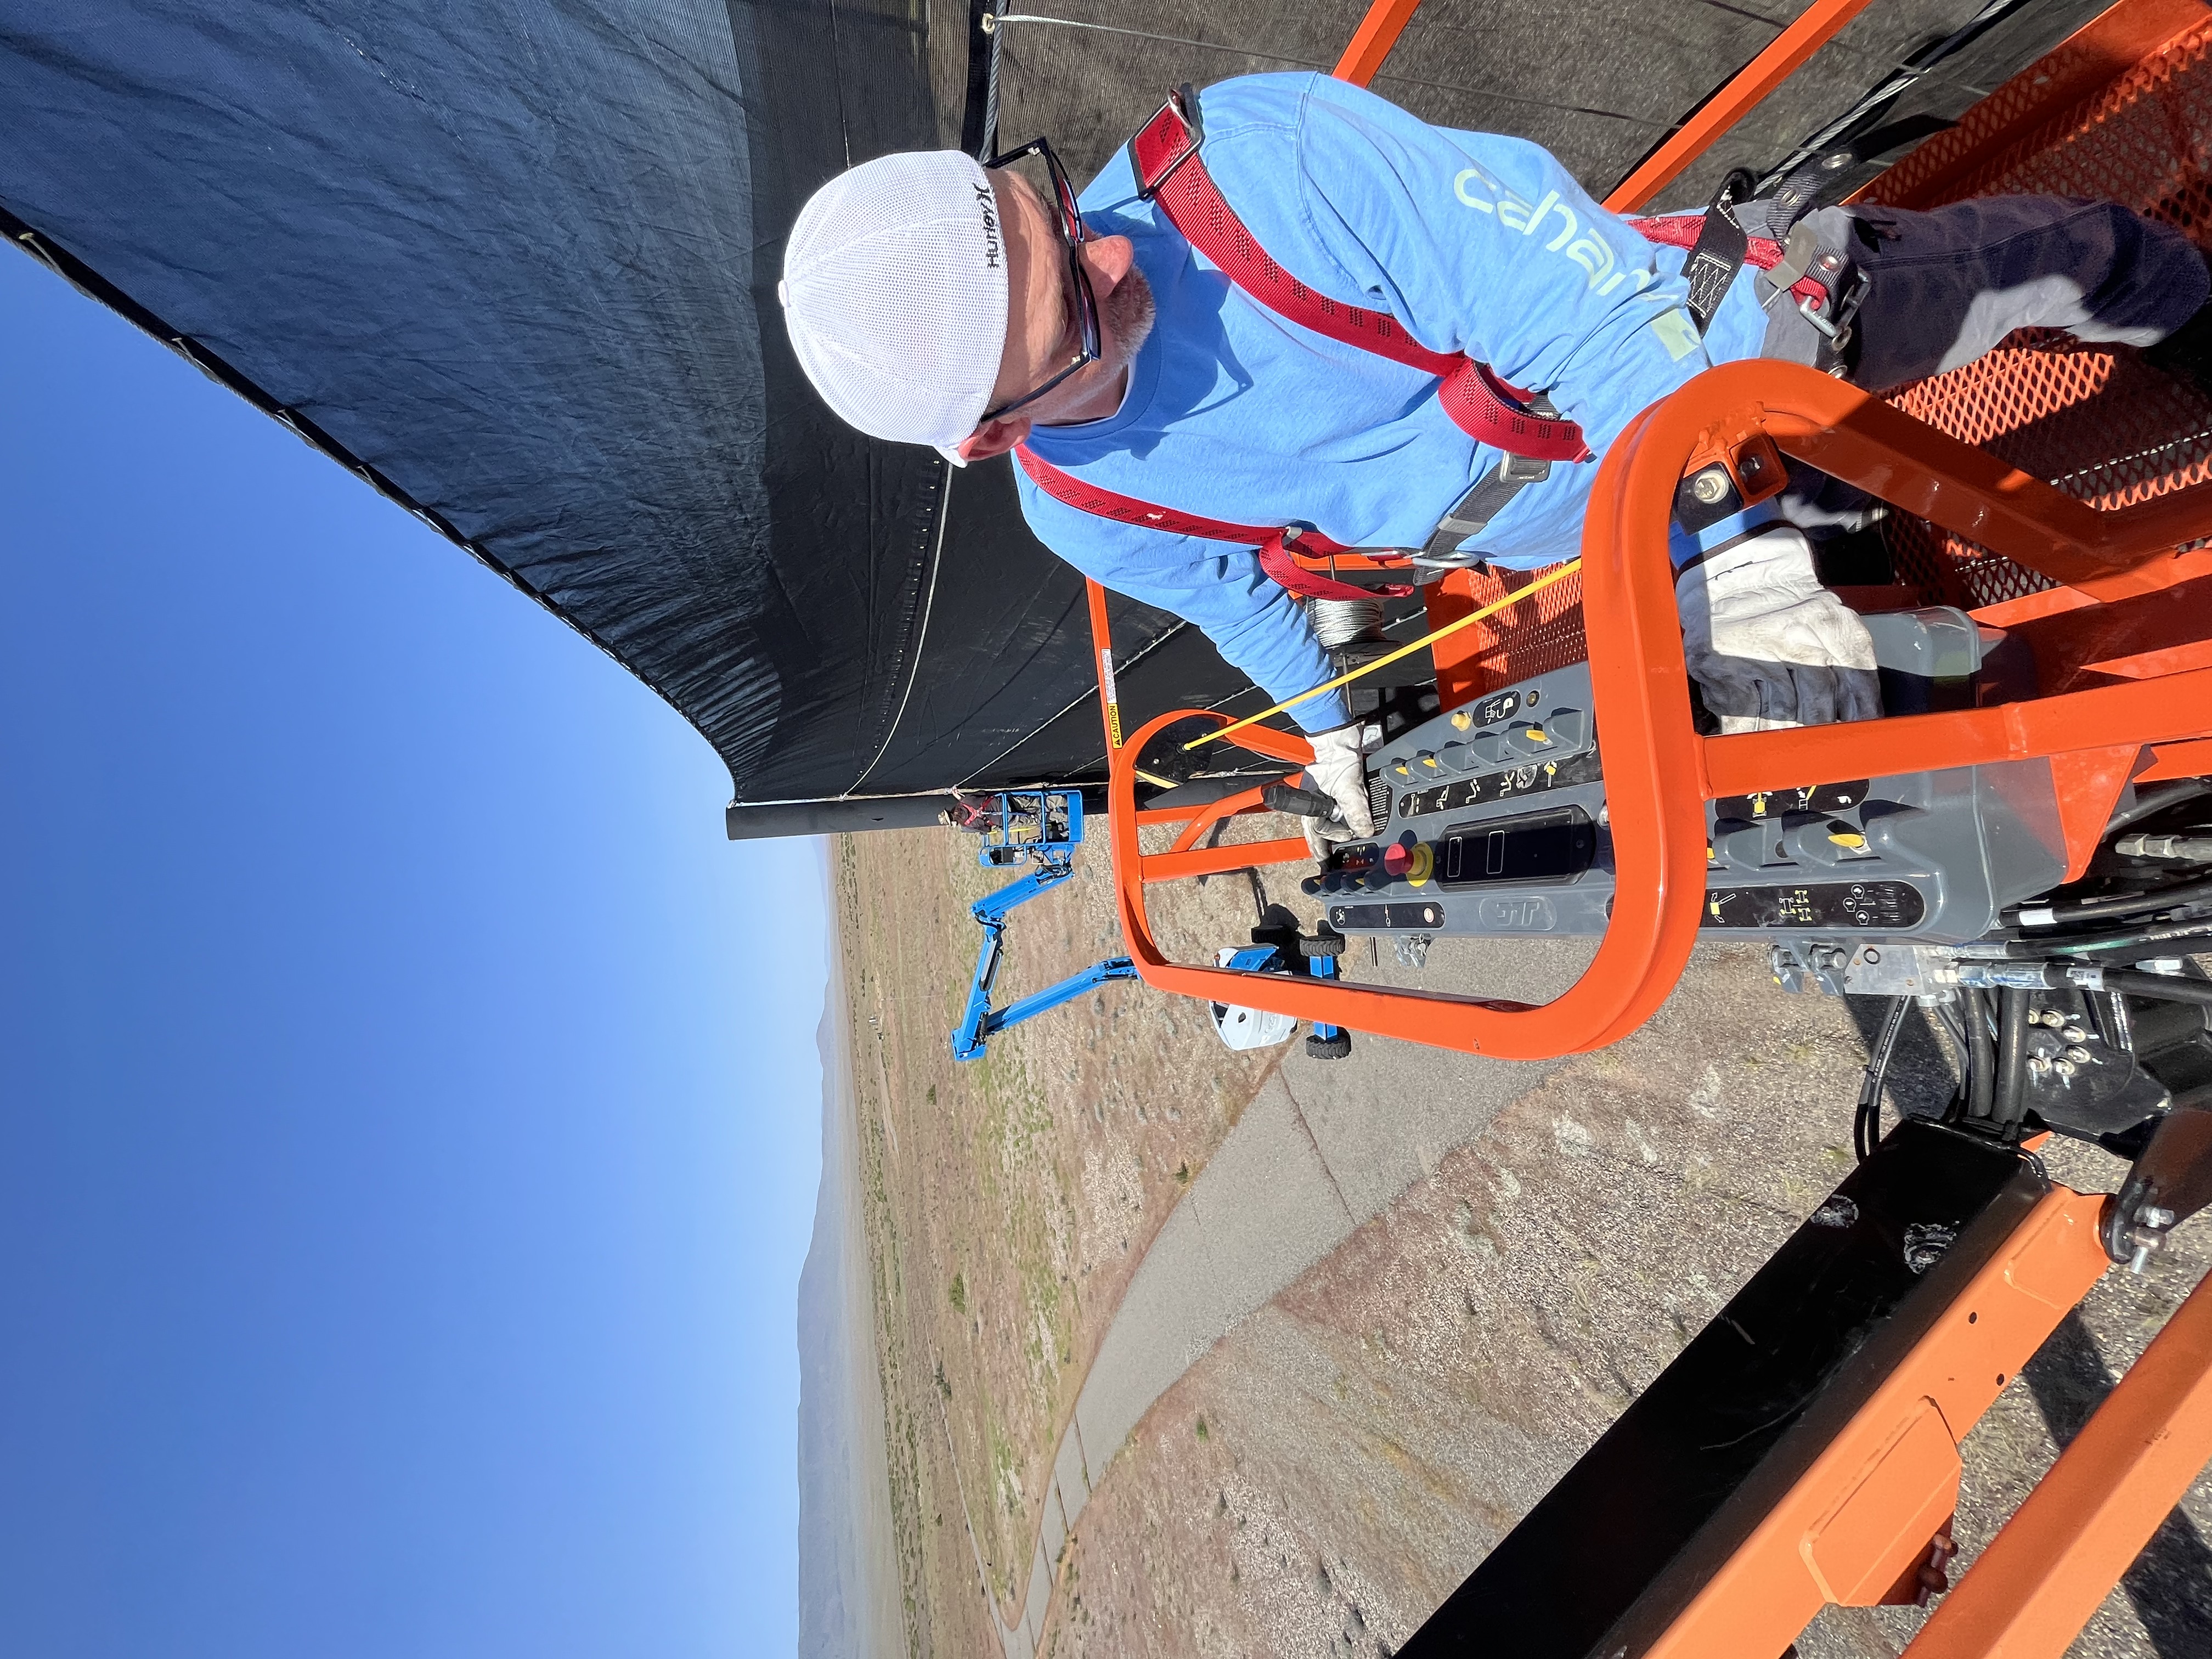
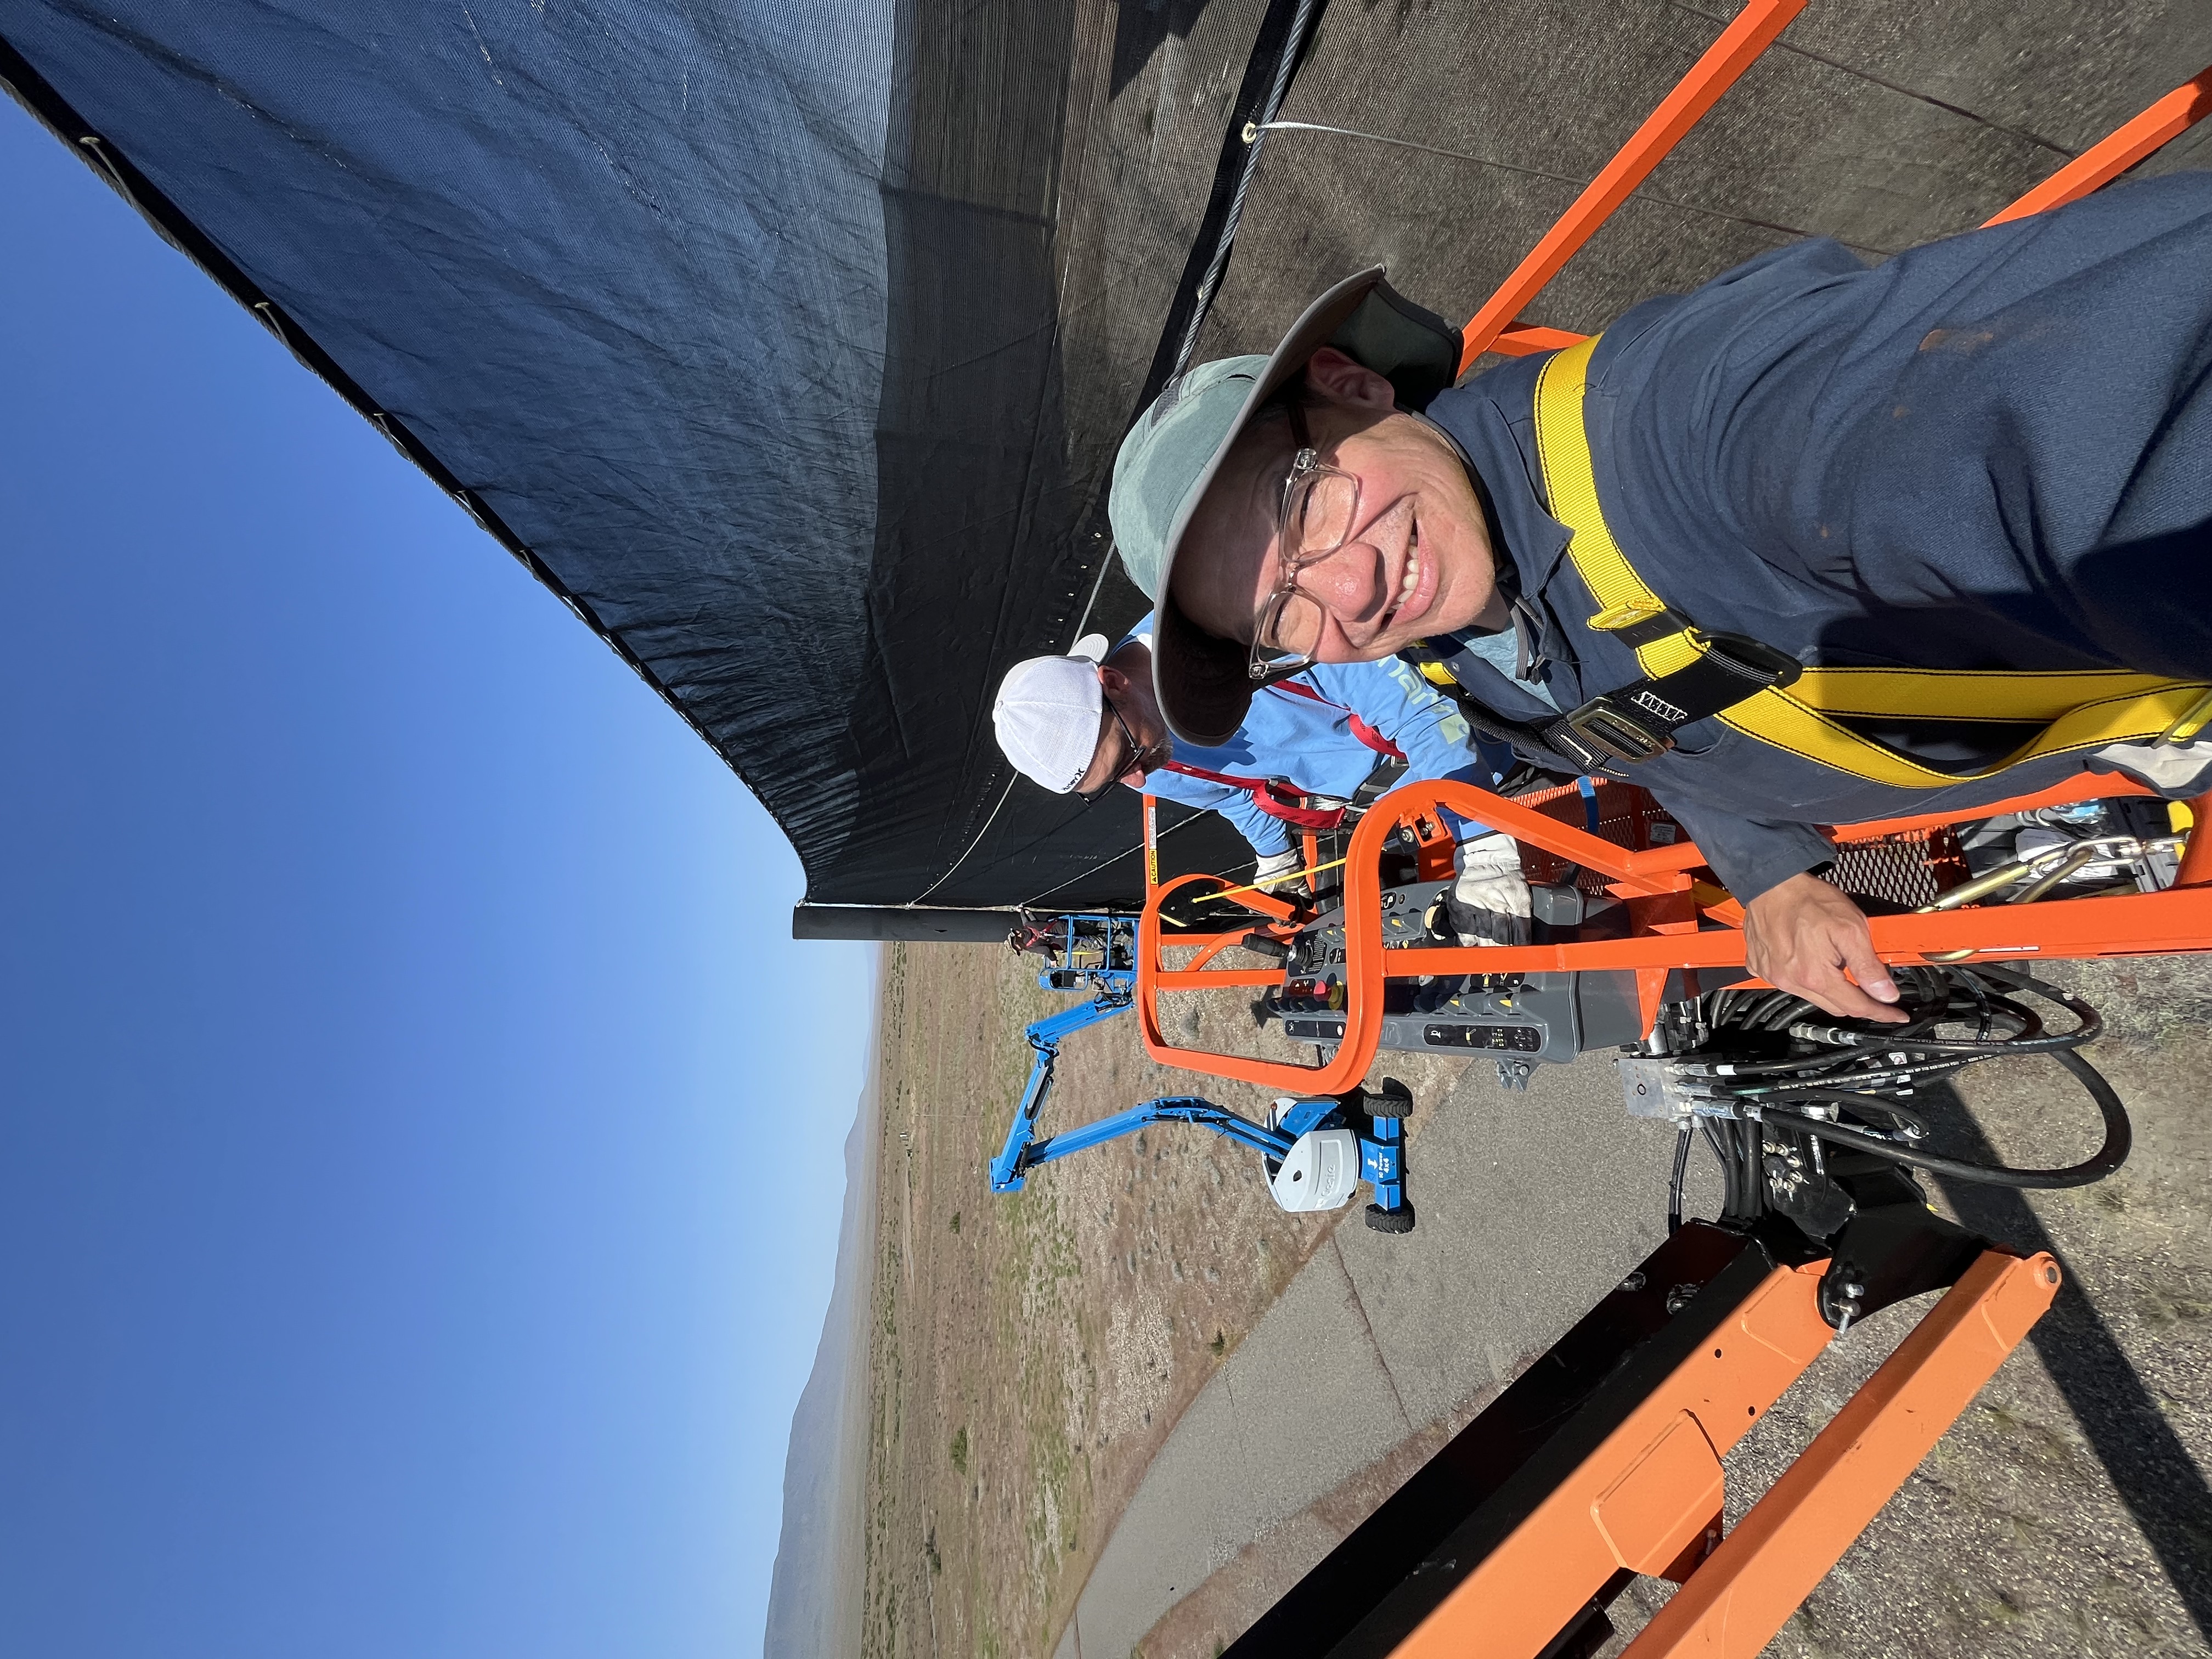
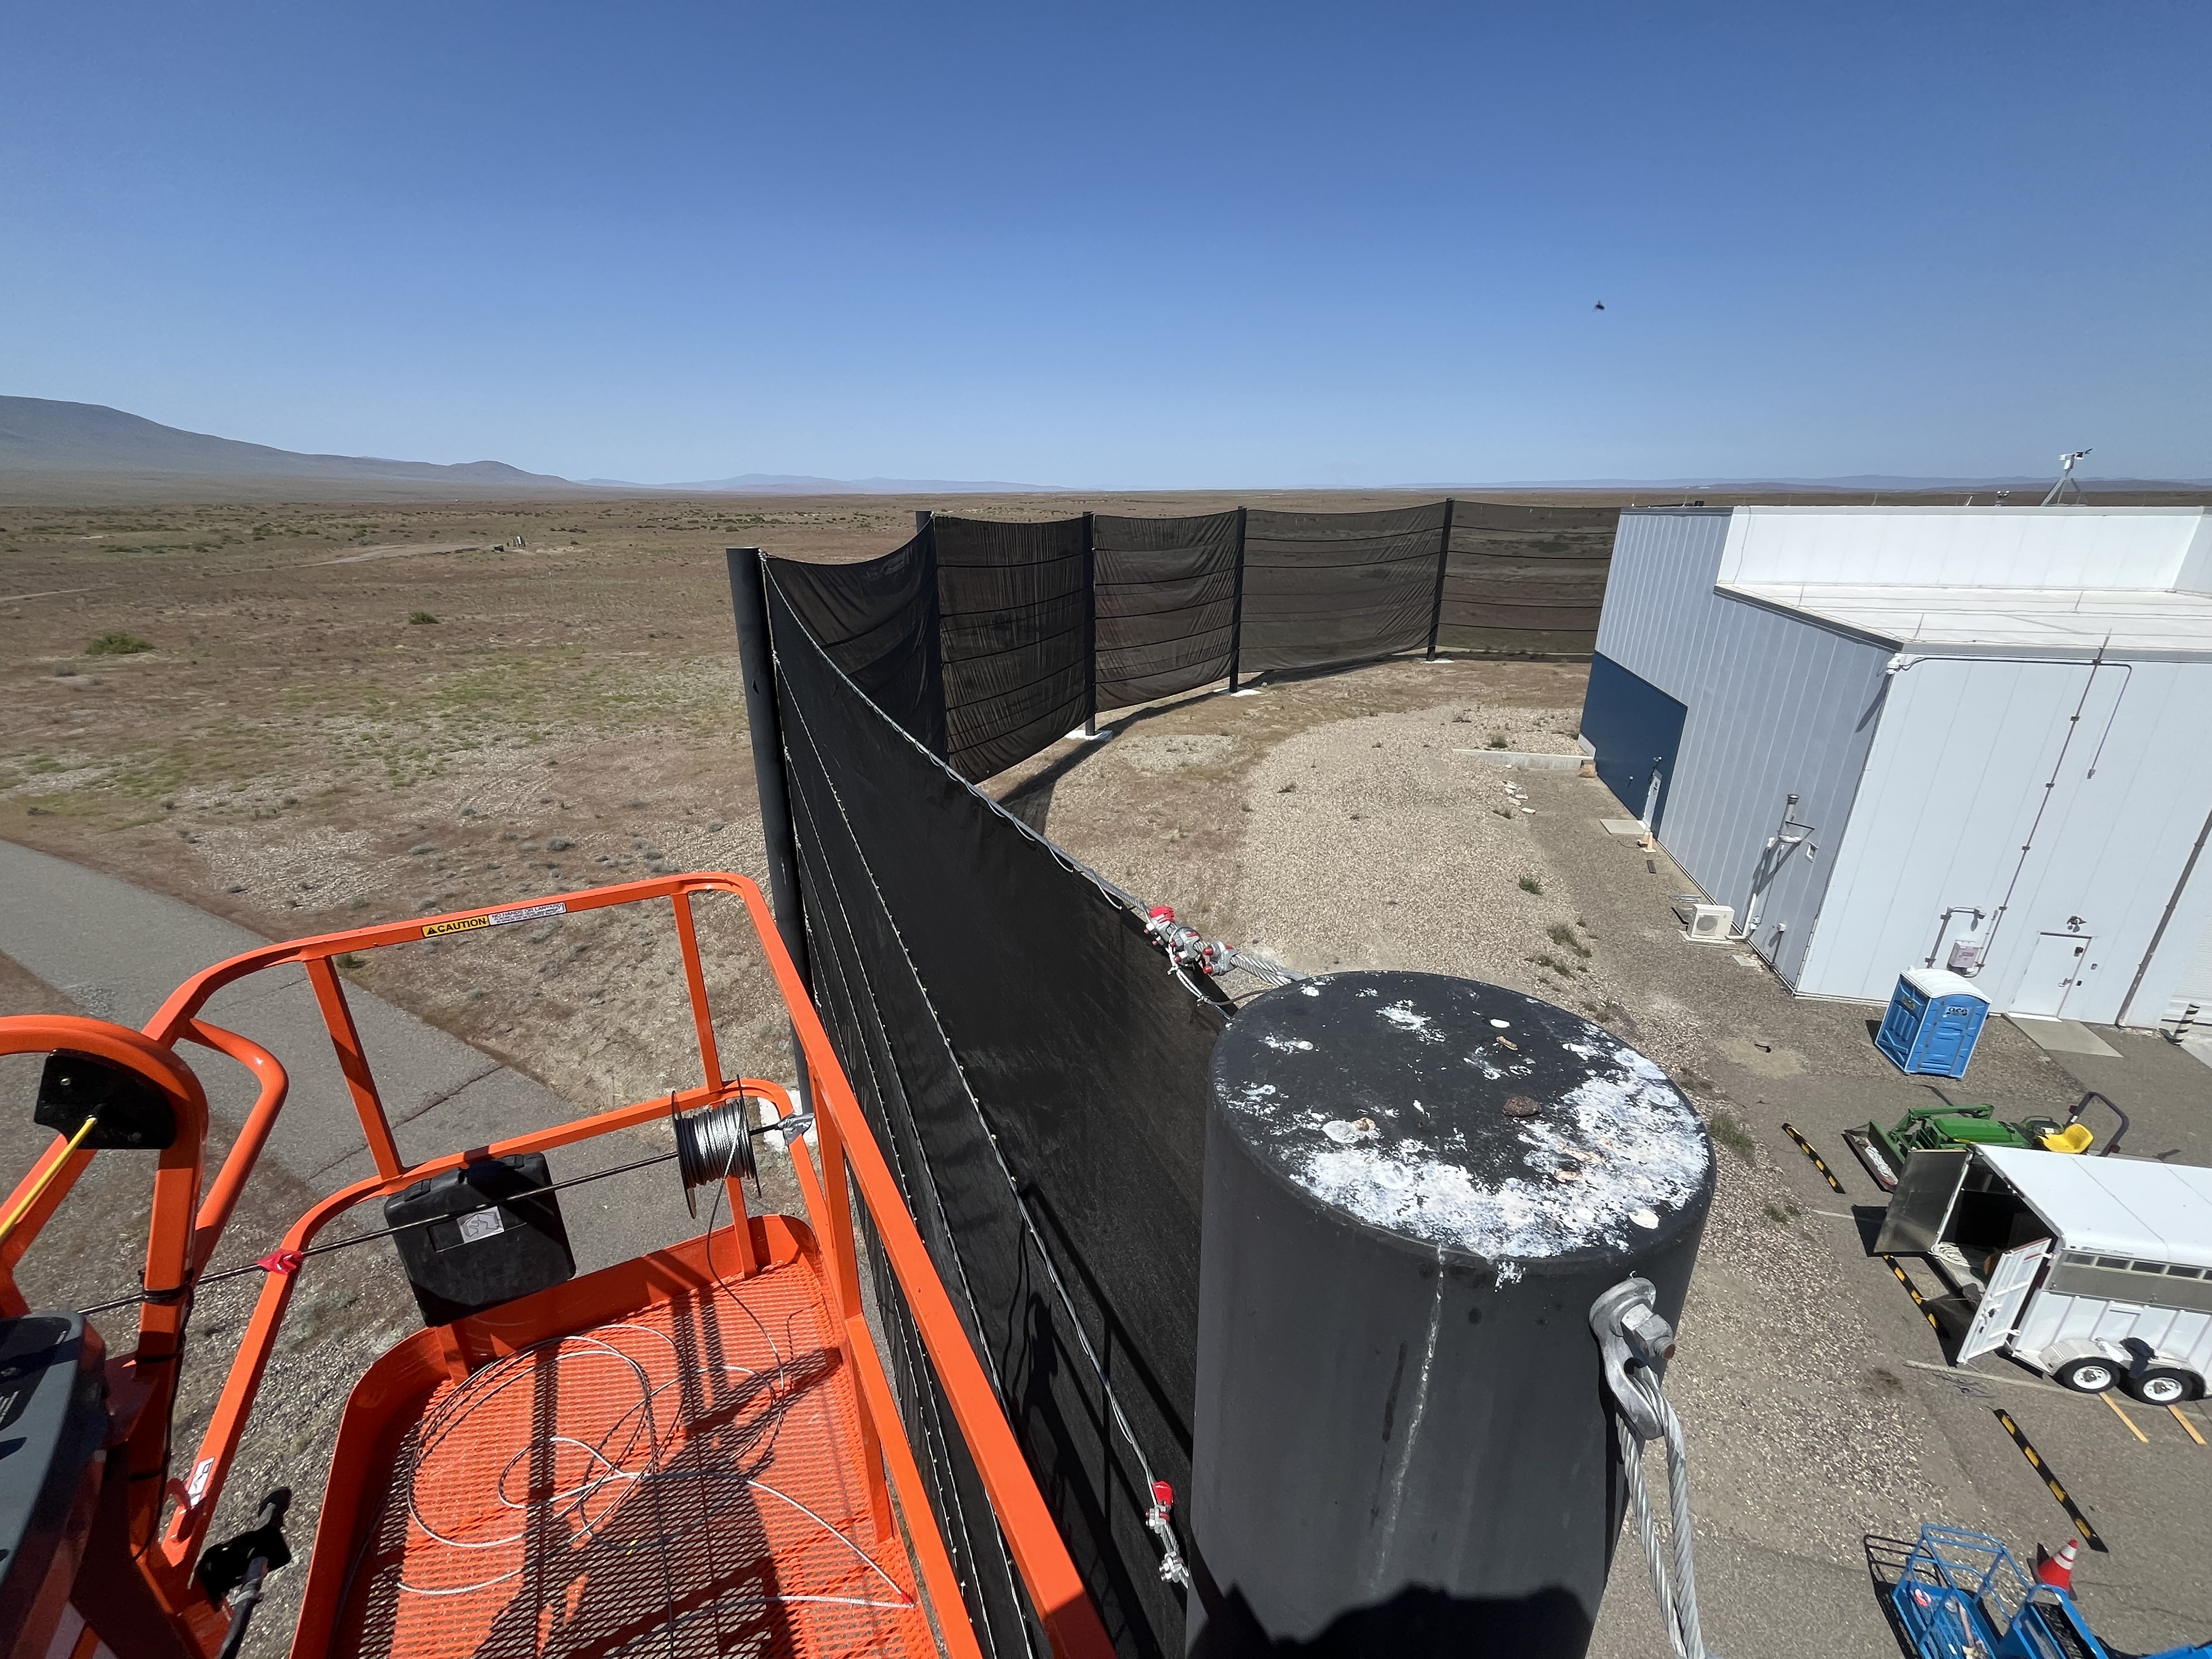
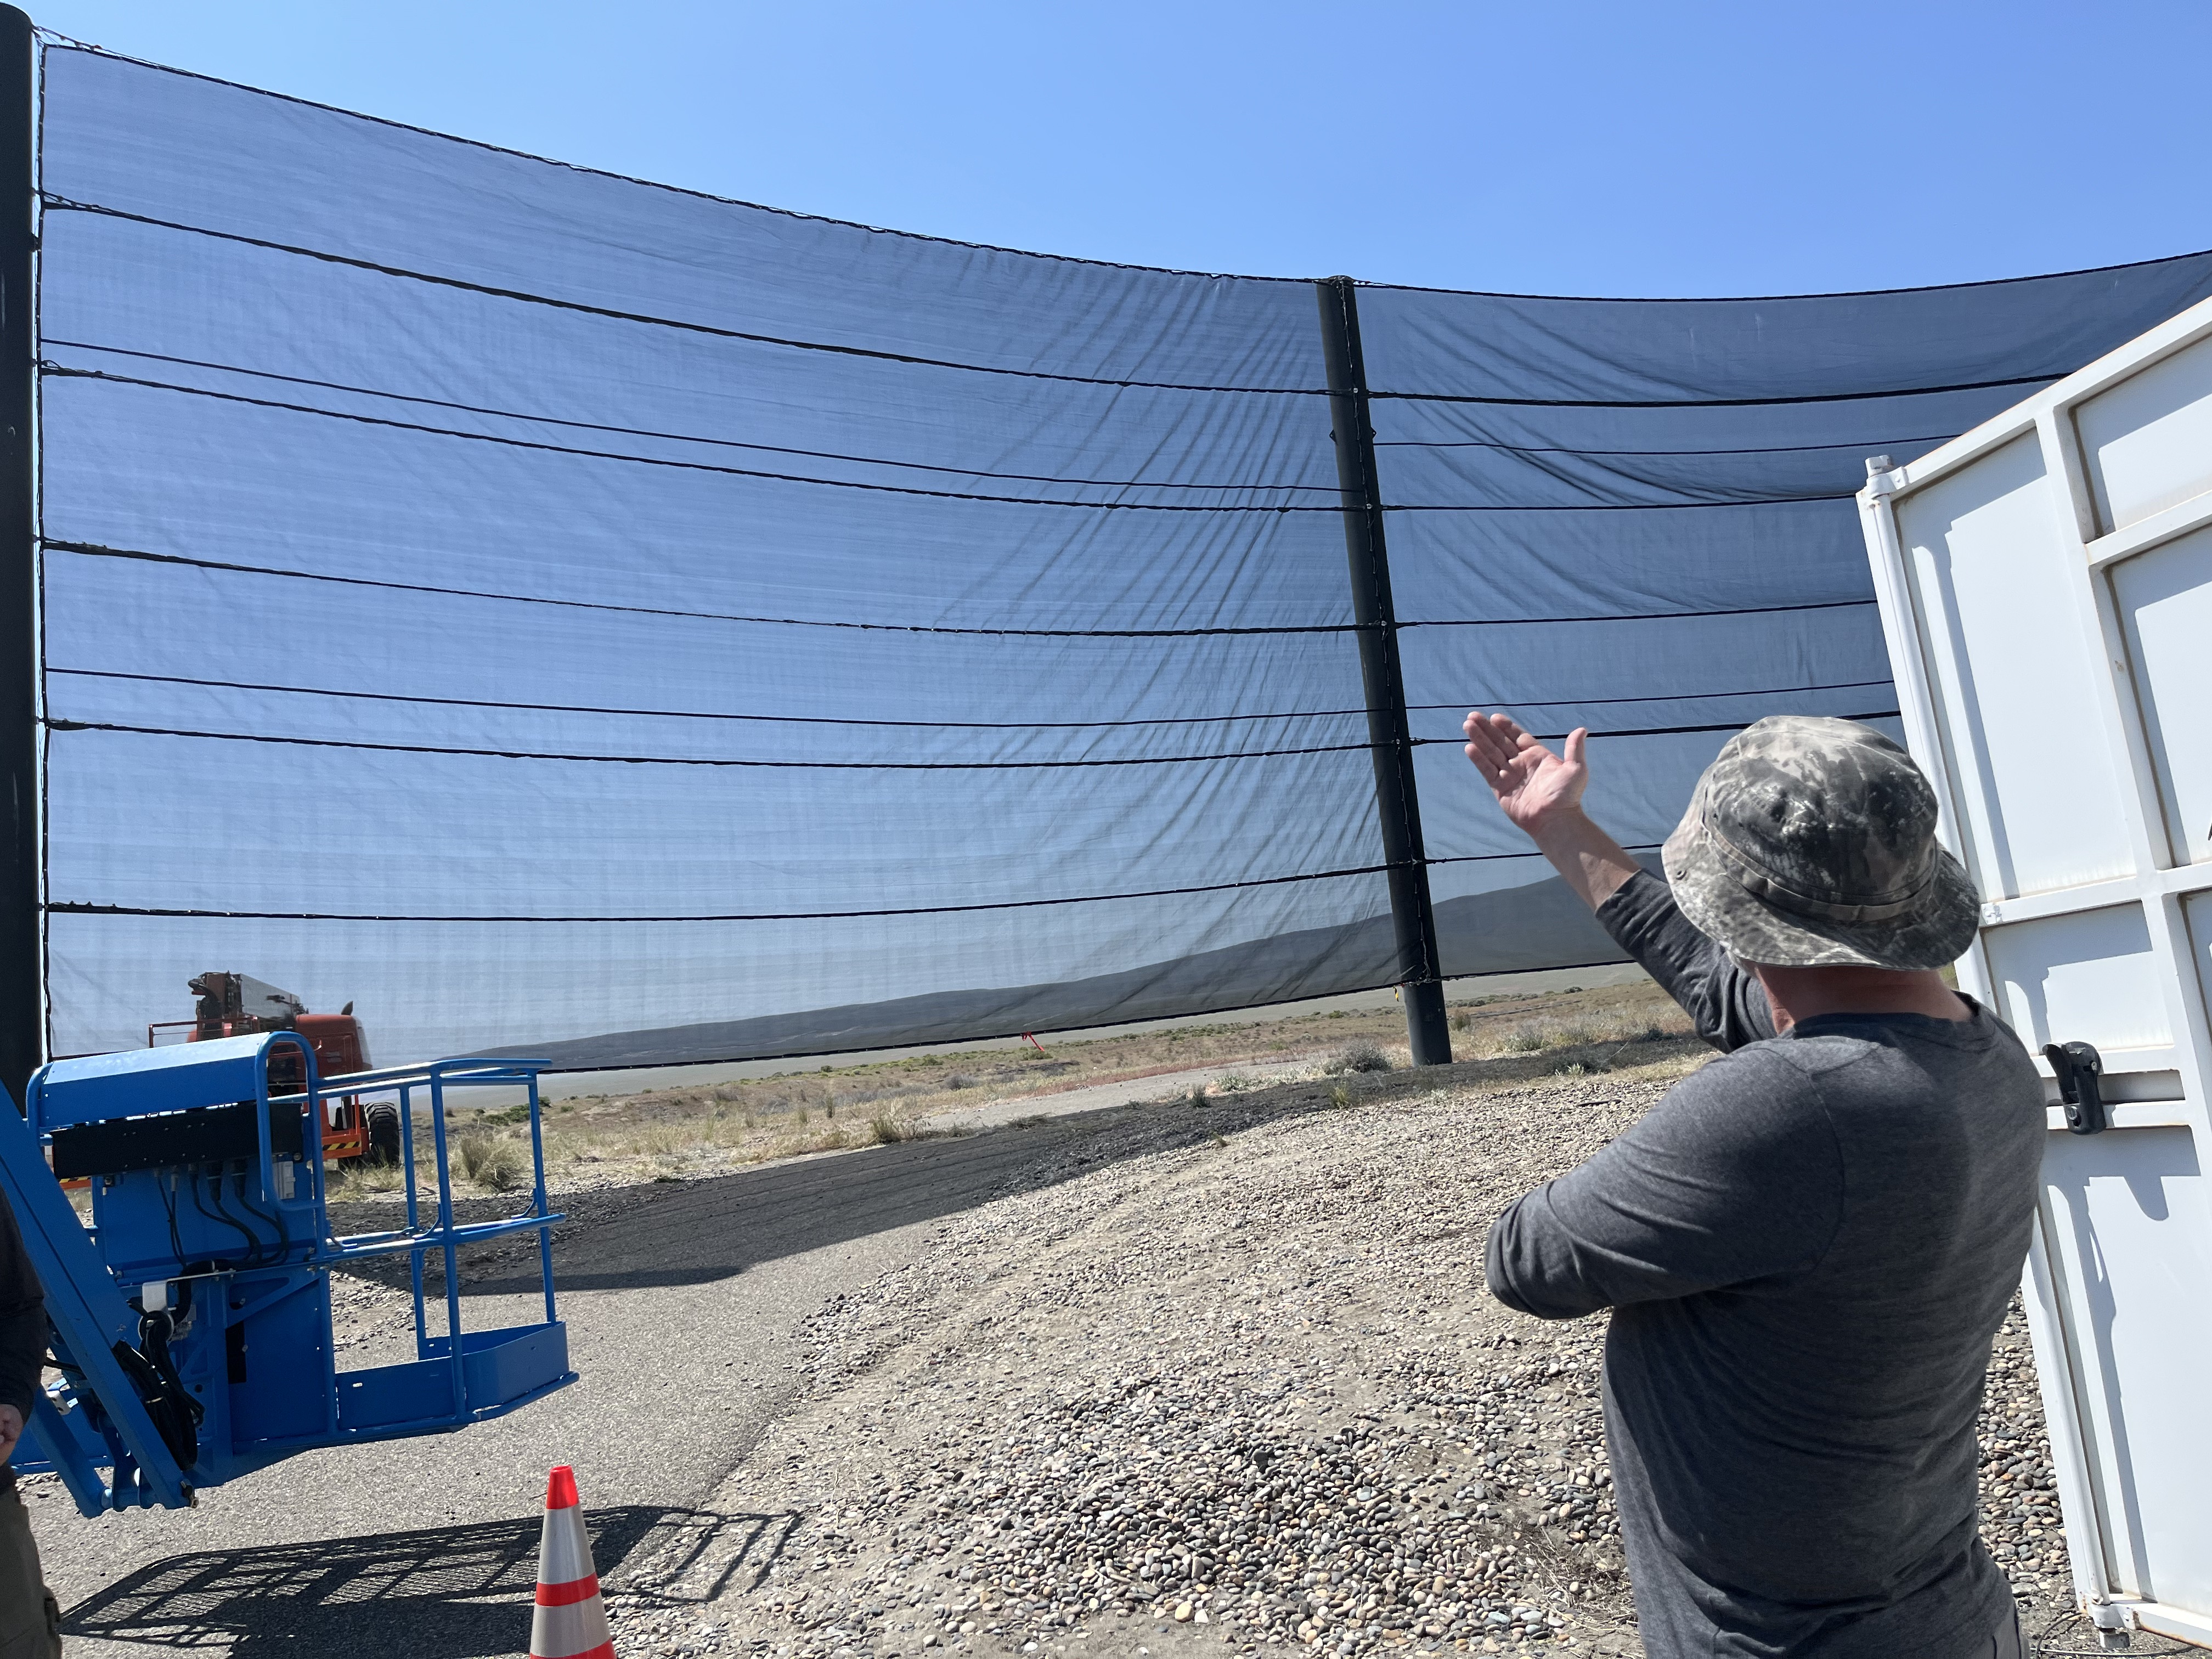
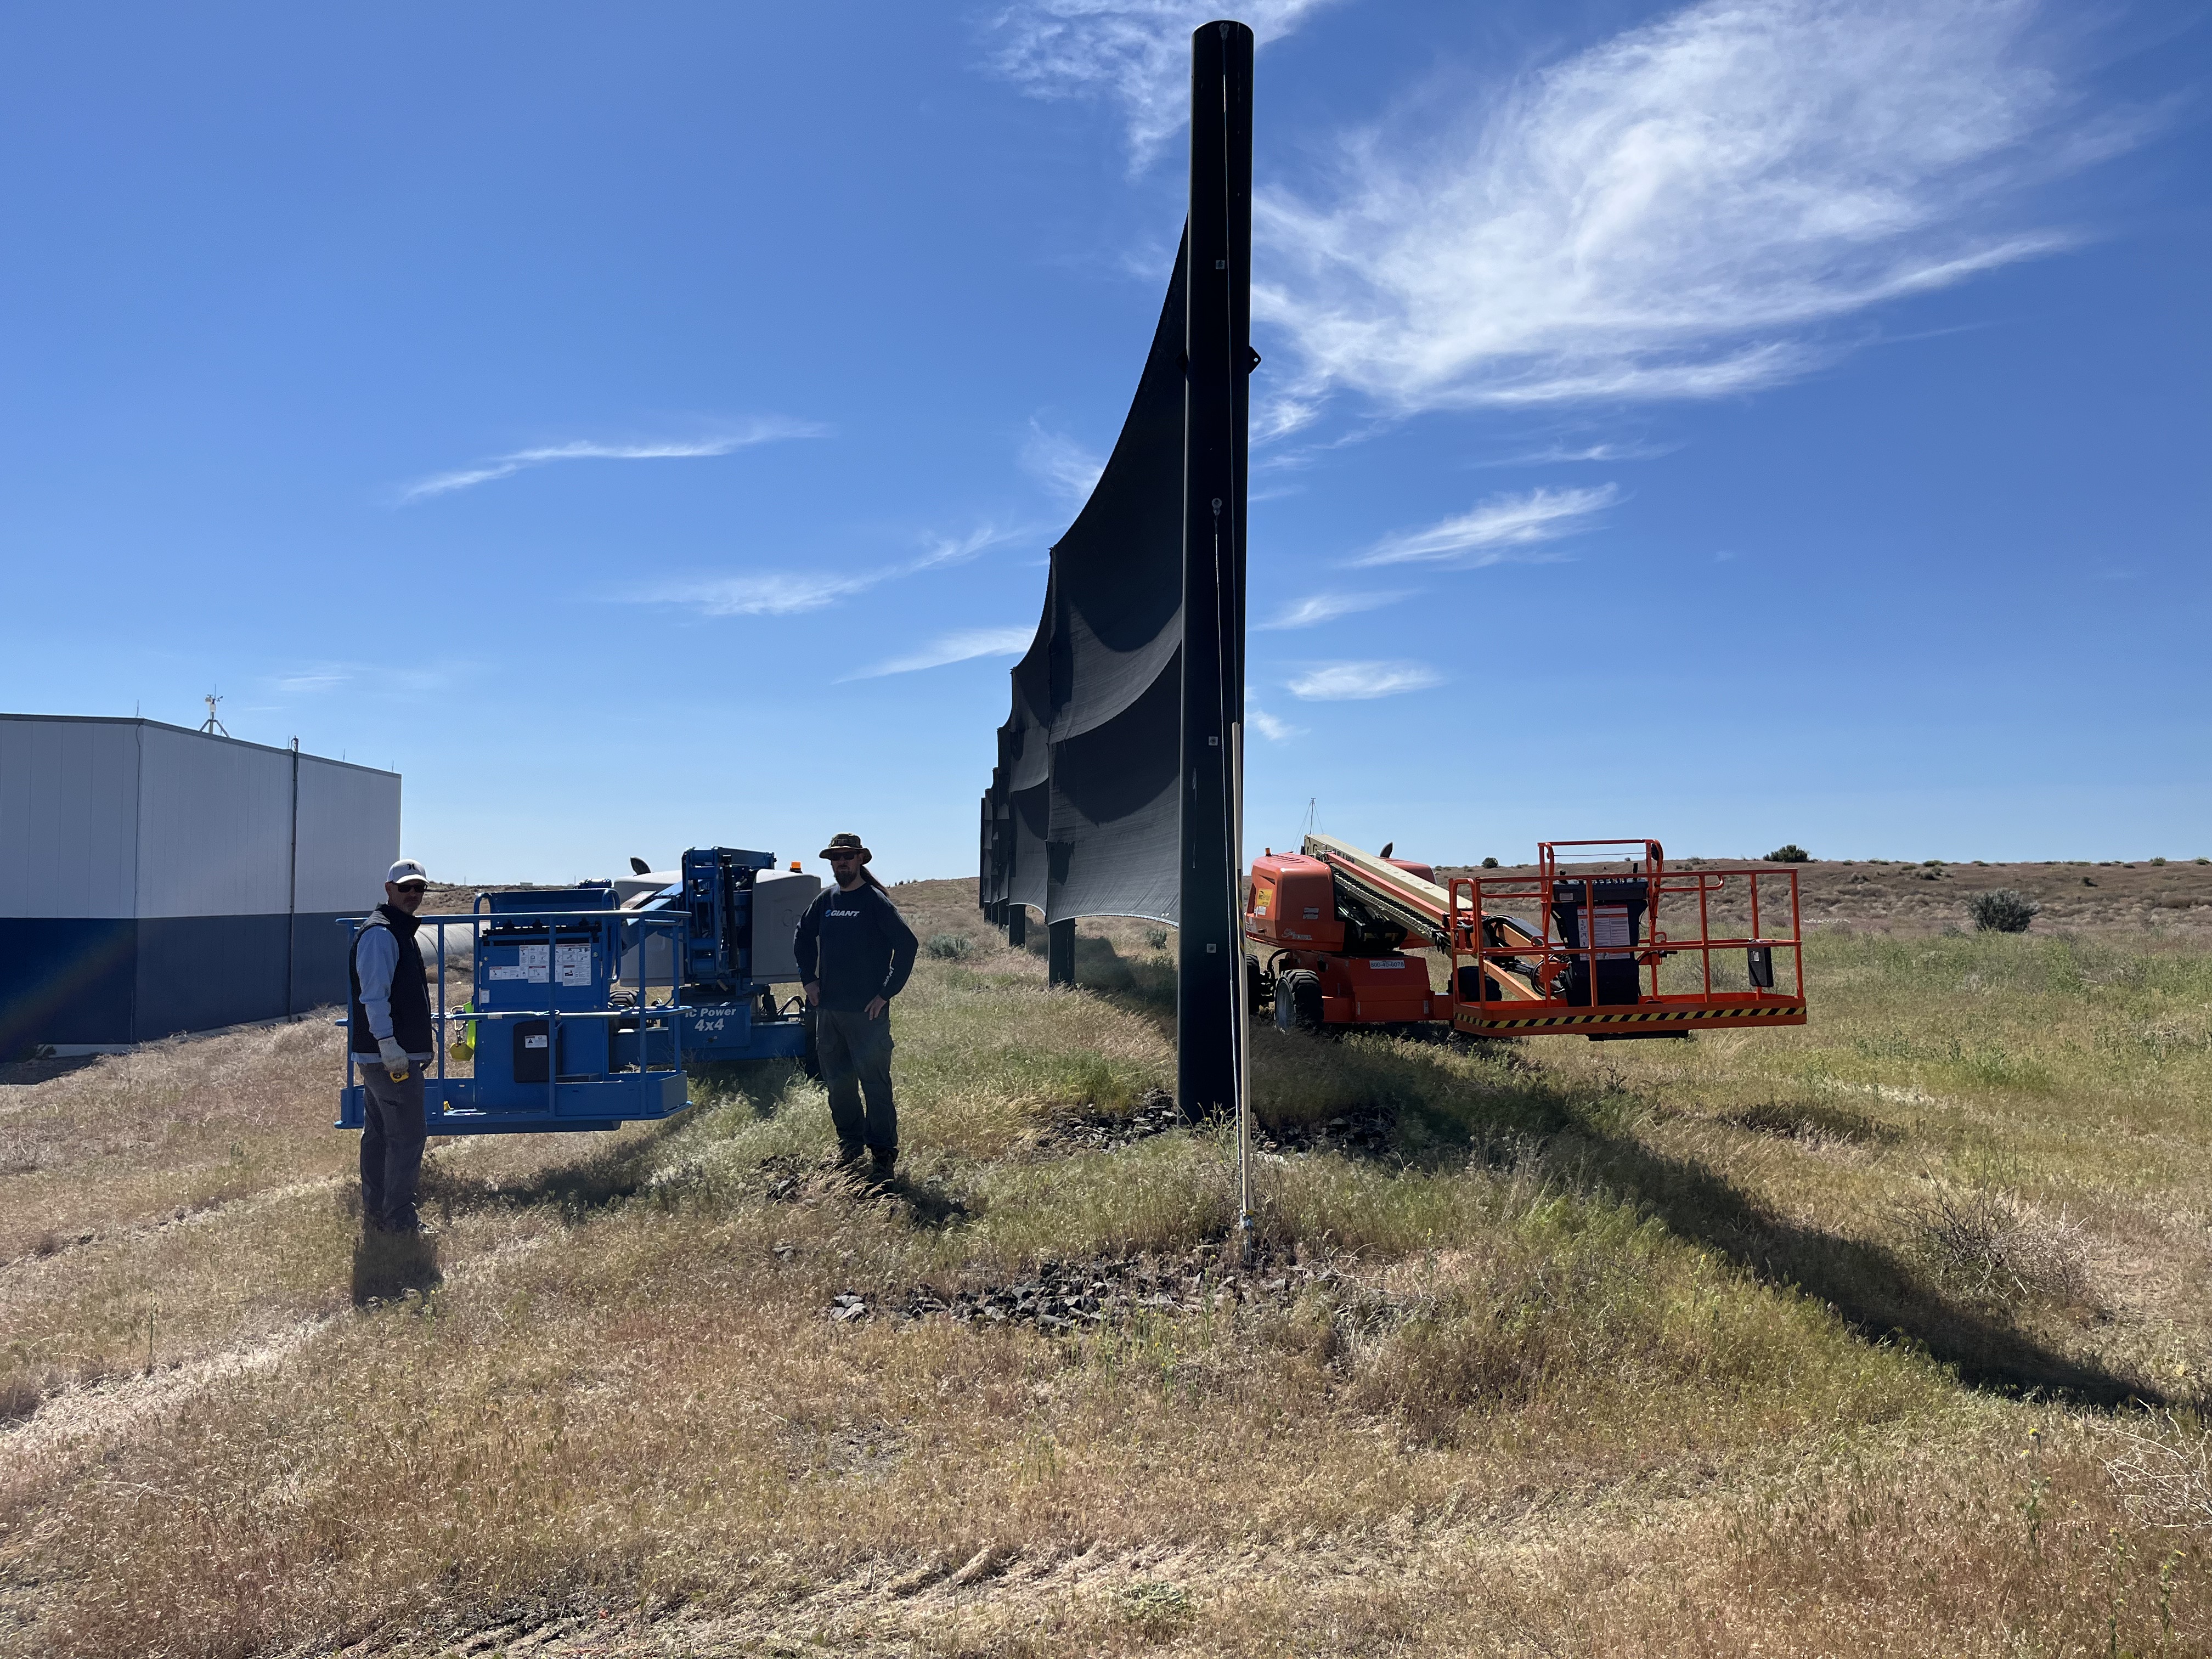
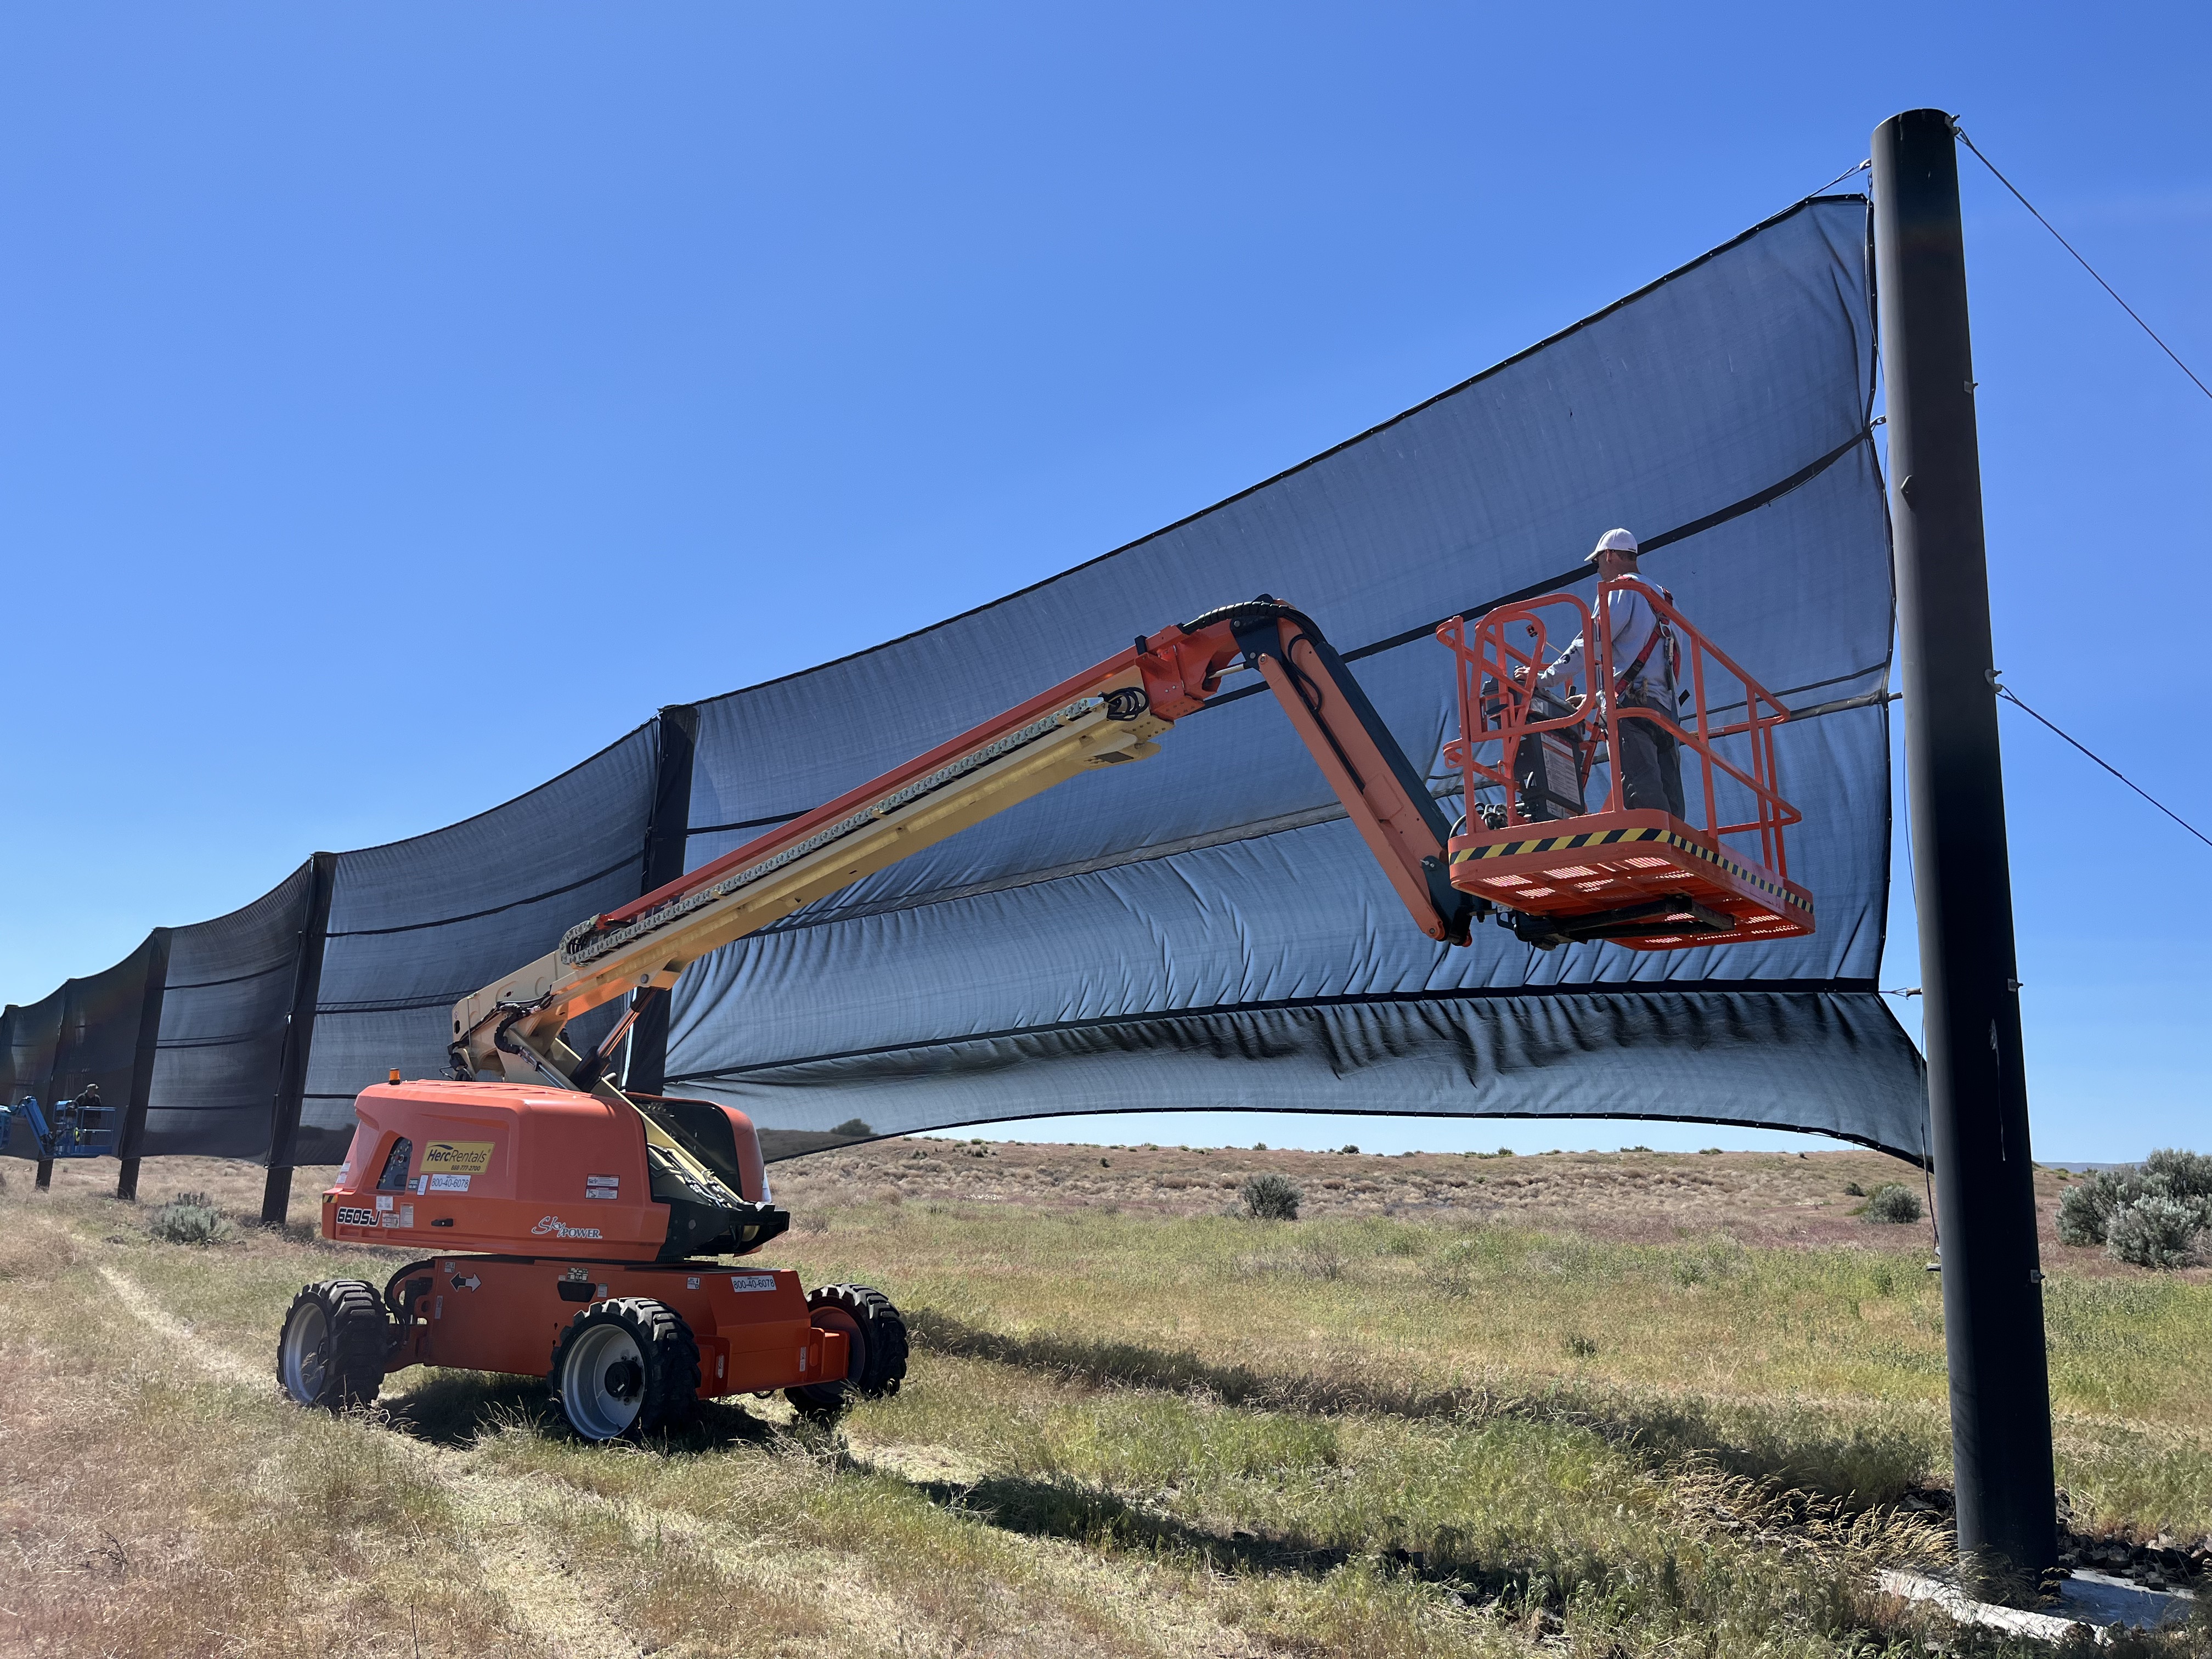
Attached photo files have names describing them and they are mostly in order of when they were taken (except for the first 4, which are "overall highlights").

EY Wind Fence Status:  COMPLETED on May2nd

This work started the week of April 28th.  The wind fences overall have been in need of a reconfiguration to UNDO what the contractors did to build them--> Because they were not great in high winds and had frequent failures during wind storms.  The EY Wind Fence was the first structure to get it's panels removed, hardware reconfigured/FIXED, and panels reinstalled.  However, the final ("left-most" panel did NOT get the upgrade and had failures in the last year).  This last panel needed its upgrade and this is what started the week of April 28th.  By the end of the week, this final panel received its upgrade and the EY Wind Fence was complete.

The upgrade was basically removing alot of the original rigging equipment holding the fabric fence panel and replace it with more rigging hardware.

EX Wind Fence Status:  Started today on May 5th

The first job here was driving (2) manlifts from EY to EX (this took about 90min and a 1/4-tank of gas for each).  Then there was a bit of prep work and gaming out where to start.

The EX Wind Fence was with the original equipment, so the entire EX Fence (6-panels) needed upgrade work.  Three panels for the EX Wind Fence were removed, but while trying to get to the 4th panel the smaller (blue) manlift got stuck in very soft sand.  At this point, this work paused to reasses a way forward (Also phoned Tyler to take a look at the situation.).  

The plan now is to get the small green tractor down to EX and try to compact the sandy ground as best as possible.  It's not clear if this will work, but this is where we currently stand.  

Images attached to this report
H1 ISC
elenna.capote@LIGO.ORG - posted 15:58, Monday 05 May 2025 (84261)
Positions of Optics for PRMI

These values are the difference in the alignment now versus right before the vent on April 1.

Mirror HEPI RZ

ISI RZ

Top Mass Pitch Top Mass Yaw Oplev Pit Oplev Yaw

Total (urad)

(HEPI + ISI + OSEM)

PRM -1.9 urad 0 + 10 urad -2 urad N/A N/A +10 pit, -4 yaw
PR2 -0.4 urad +5.8 urad +3 urad +3.5 urad N/A N/A +3 pit, + 8.9 yaw
PR3 -1.9 urad 0 -14 urad 0 0 * +1.5 urad * -14 pit, -1.9 yaw
BS 0 -4 urad -1.5 urad +2 urad -1.5 urad +23 urad -1.5 pit, -2 urad
ITMX 0 -0.5 urad +9 urad +12 urad +2 urad +2.5 urad +9 pit, +11.5 yaw
ITMY 0 -3 urad -60 urad -5 urad -6 urad 0 -60 pit, -8 yaw

* we do not trust this oplev!

We aligned optics well enough to see flashes in PRMI, although it does not look very well aligned. Camilla can see the PRMI flashes out of the HAM1 viewport. We are missing the periscope, so we think the periscope should be moved. The flashes are very weak- we will need to turn up the input power to do any more work on this path.

Flashes from 21:45 UTC to 23:00 UTC May 5.

H1 SUS (SUS)
edgard.bonilla@LIGO.ORG - posted 14:32, Monday 05 May 2025 (84259)
Spurious gains on the SR3_M1_TEST path for Pitch and Yaw

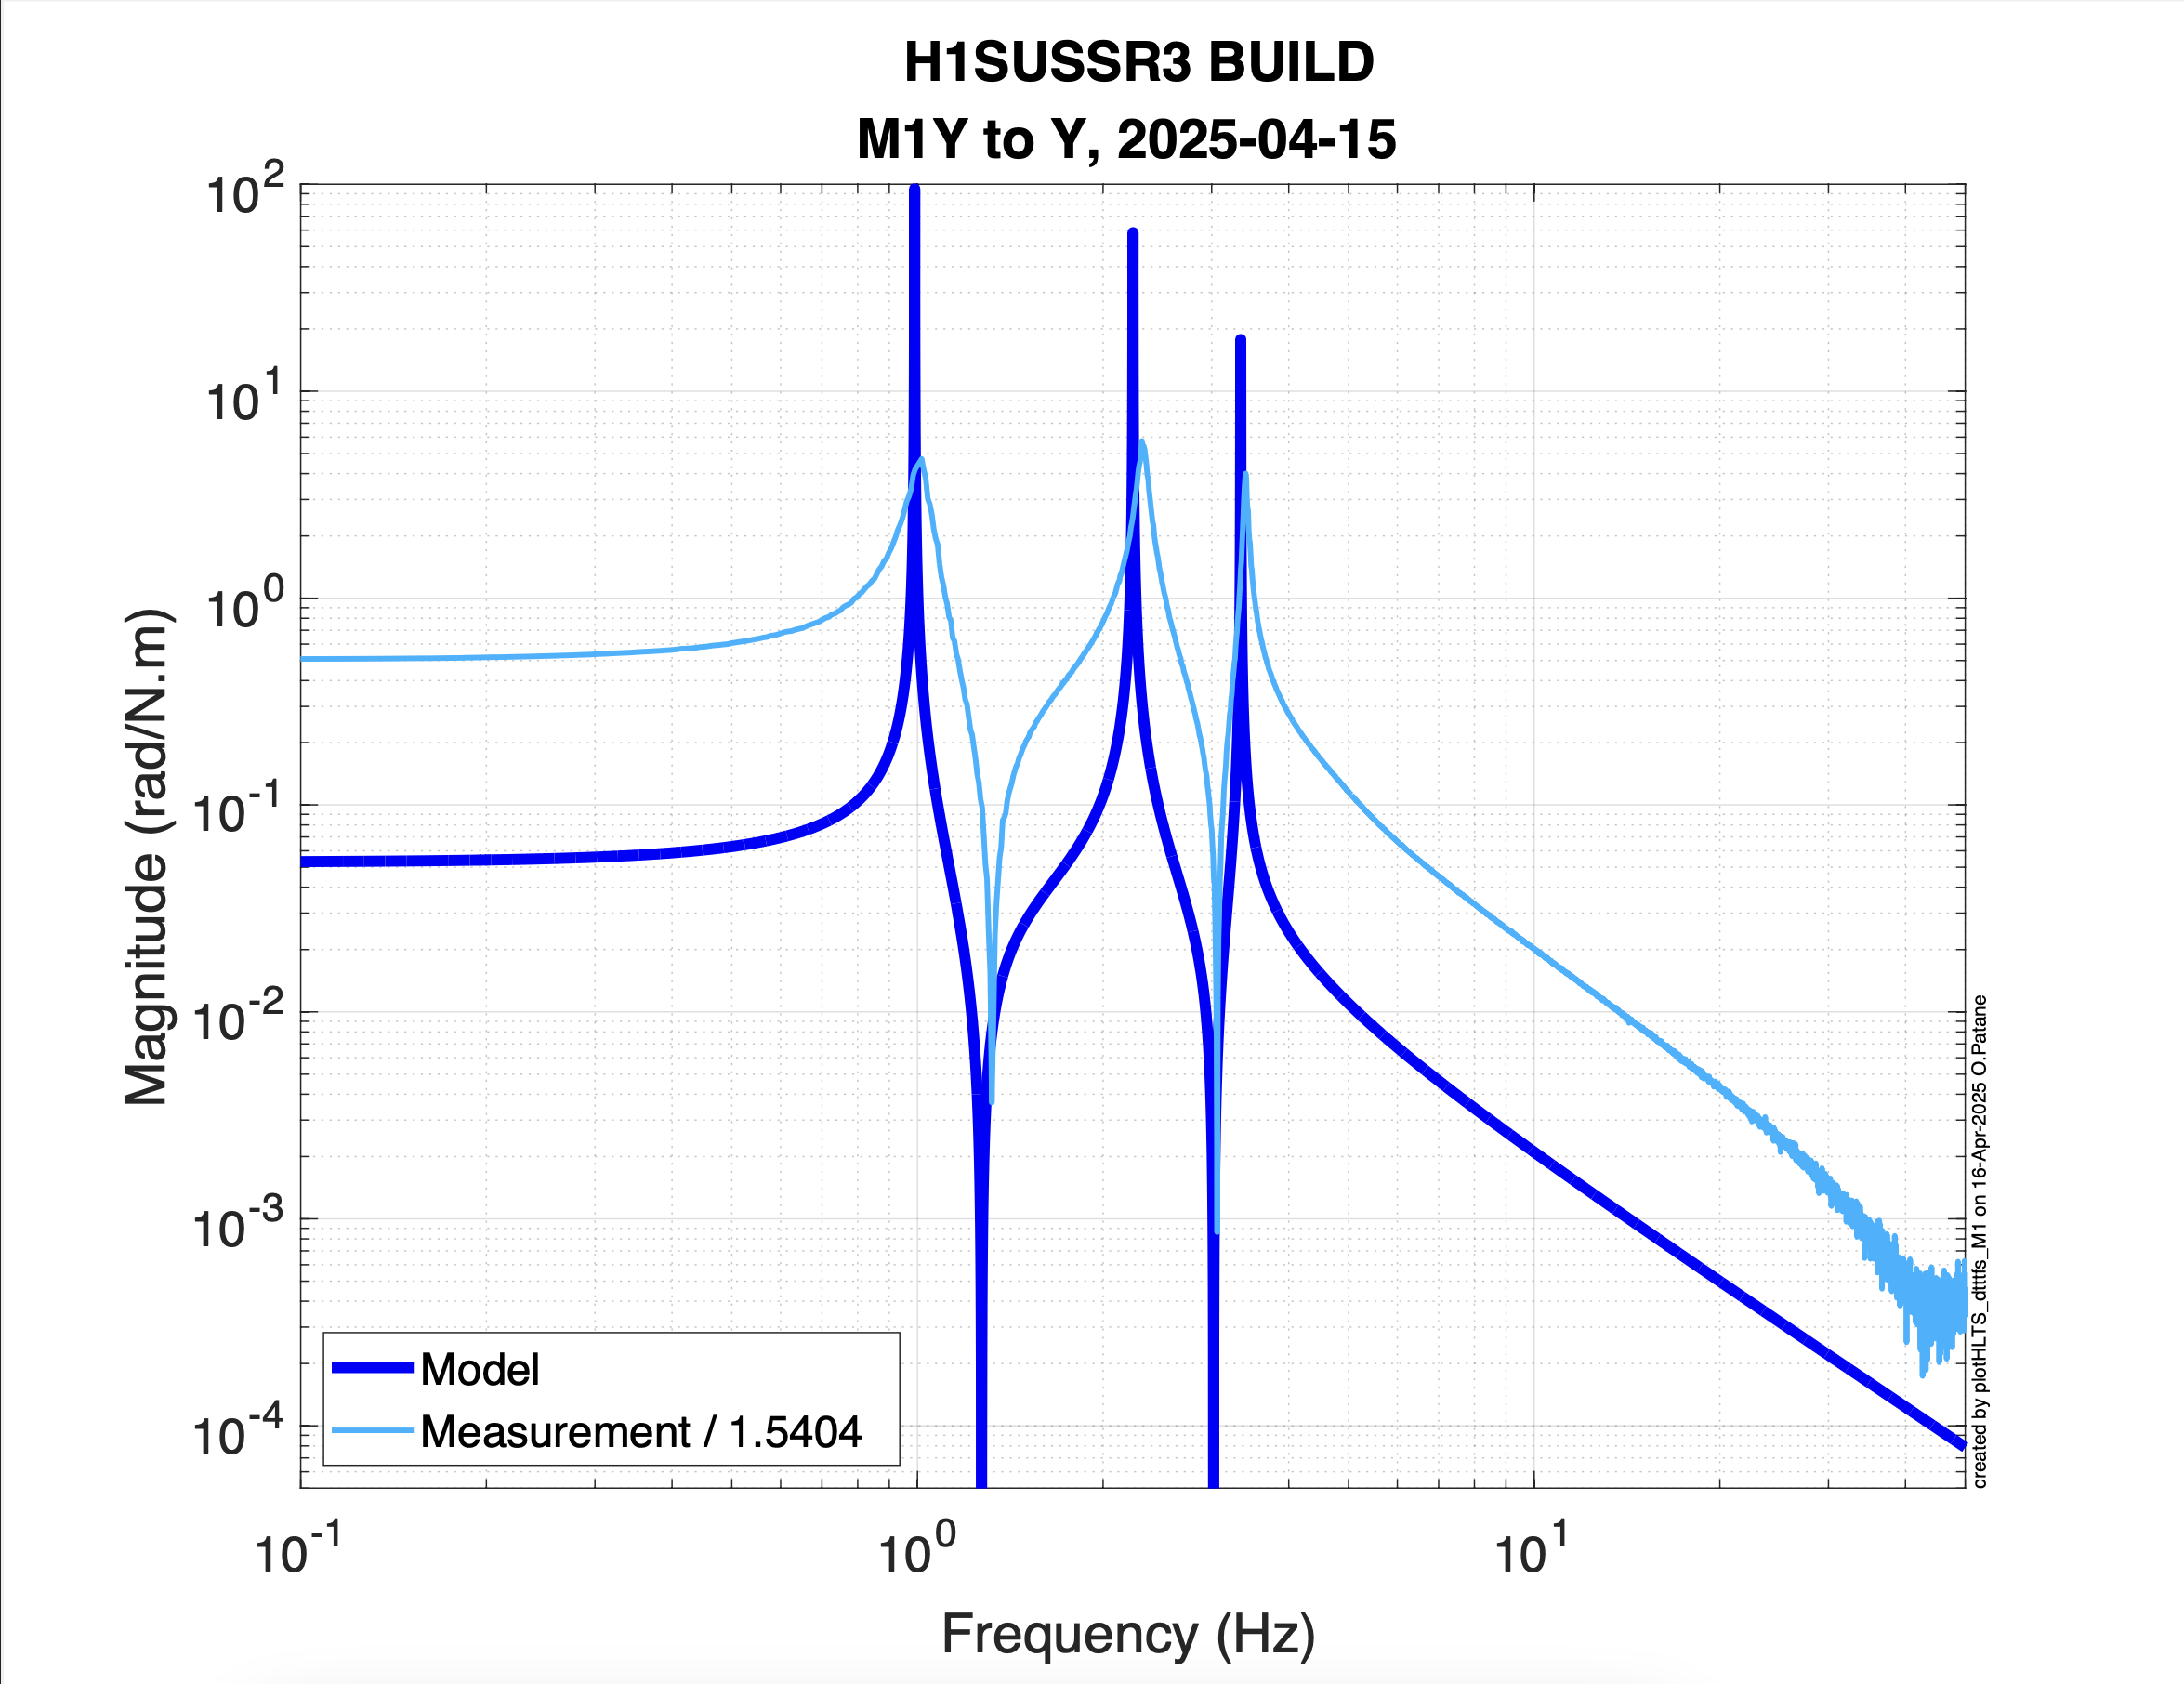
While investigating the strange shape of the drive spectrum of the OSEM estimator from 84219. I found that the only plausible explanation for the discrepancy between the observed and predicted drives had to be a mistake on the calibration of the YAW transfer functions measured through the M1_TEST excitation point.

Turns out that both the Pitch and Yaw gains for the SR3_M1_TEST path are set to numbers different from 1 (they're set to 2.675 and 12.272 respectively, [see 2nd attachment]). Therefore, the exported transfer functions from the DTT template are miscalibrated for all the Pitch and Yaw drives for SR3. The factor of 12 discrepancy for Yaw can be directly seen in the SR3 M1 to M1 transfer functions that Oli took a month ago (see the .pdf attached to 83939, or the first attached figure).

These gains are correctly set to 1 for PR3, so the PR3 transfer functions are okay. However, we should fix the gains to 1 for SR3 so future diagnostic transfer functions are correctly calibrated.

Images attached to this report
H1 OpsInfo
ryan.short@LIGO.ORG - posted 13:29, Monday 05 May 2025 (84258)
SUS Guardians Screen Updated

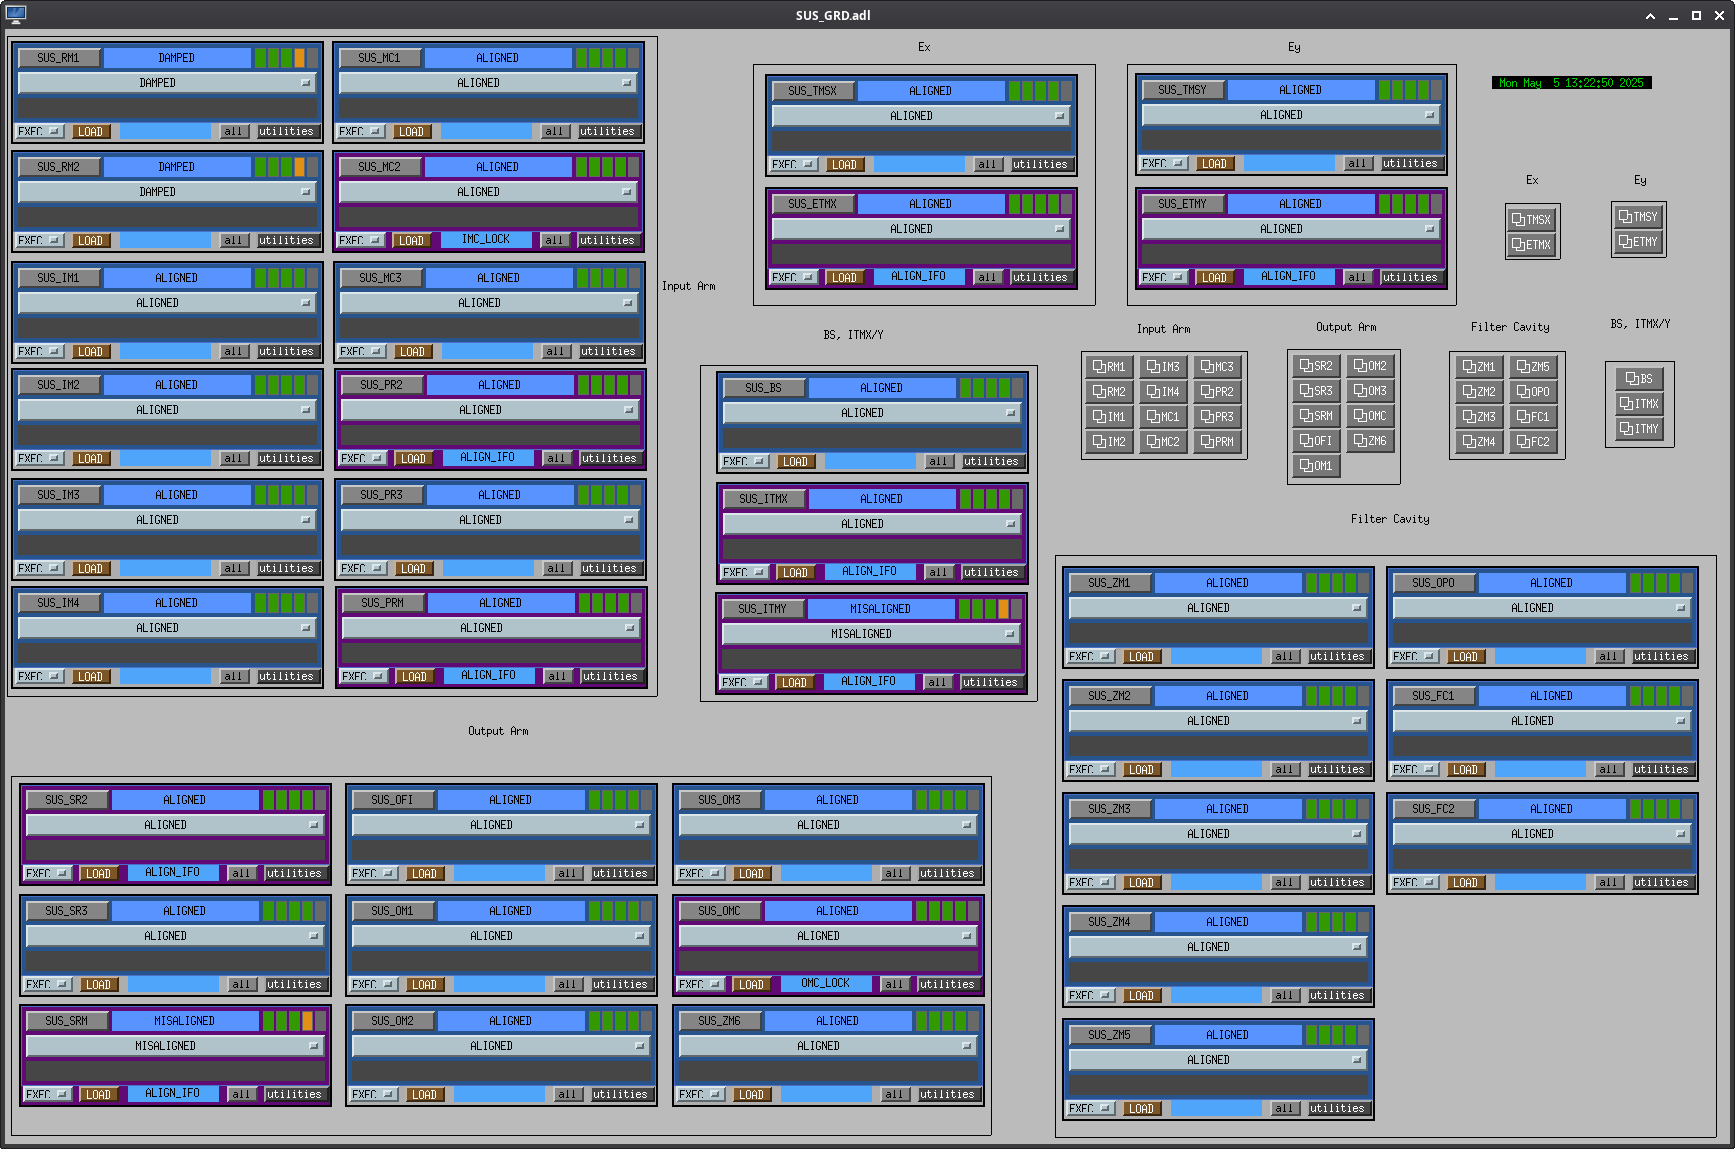
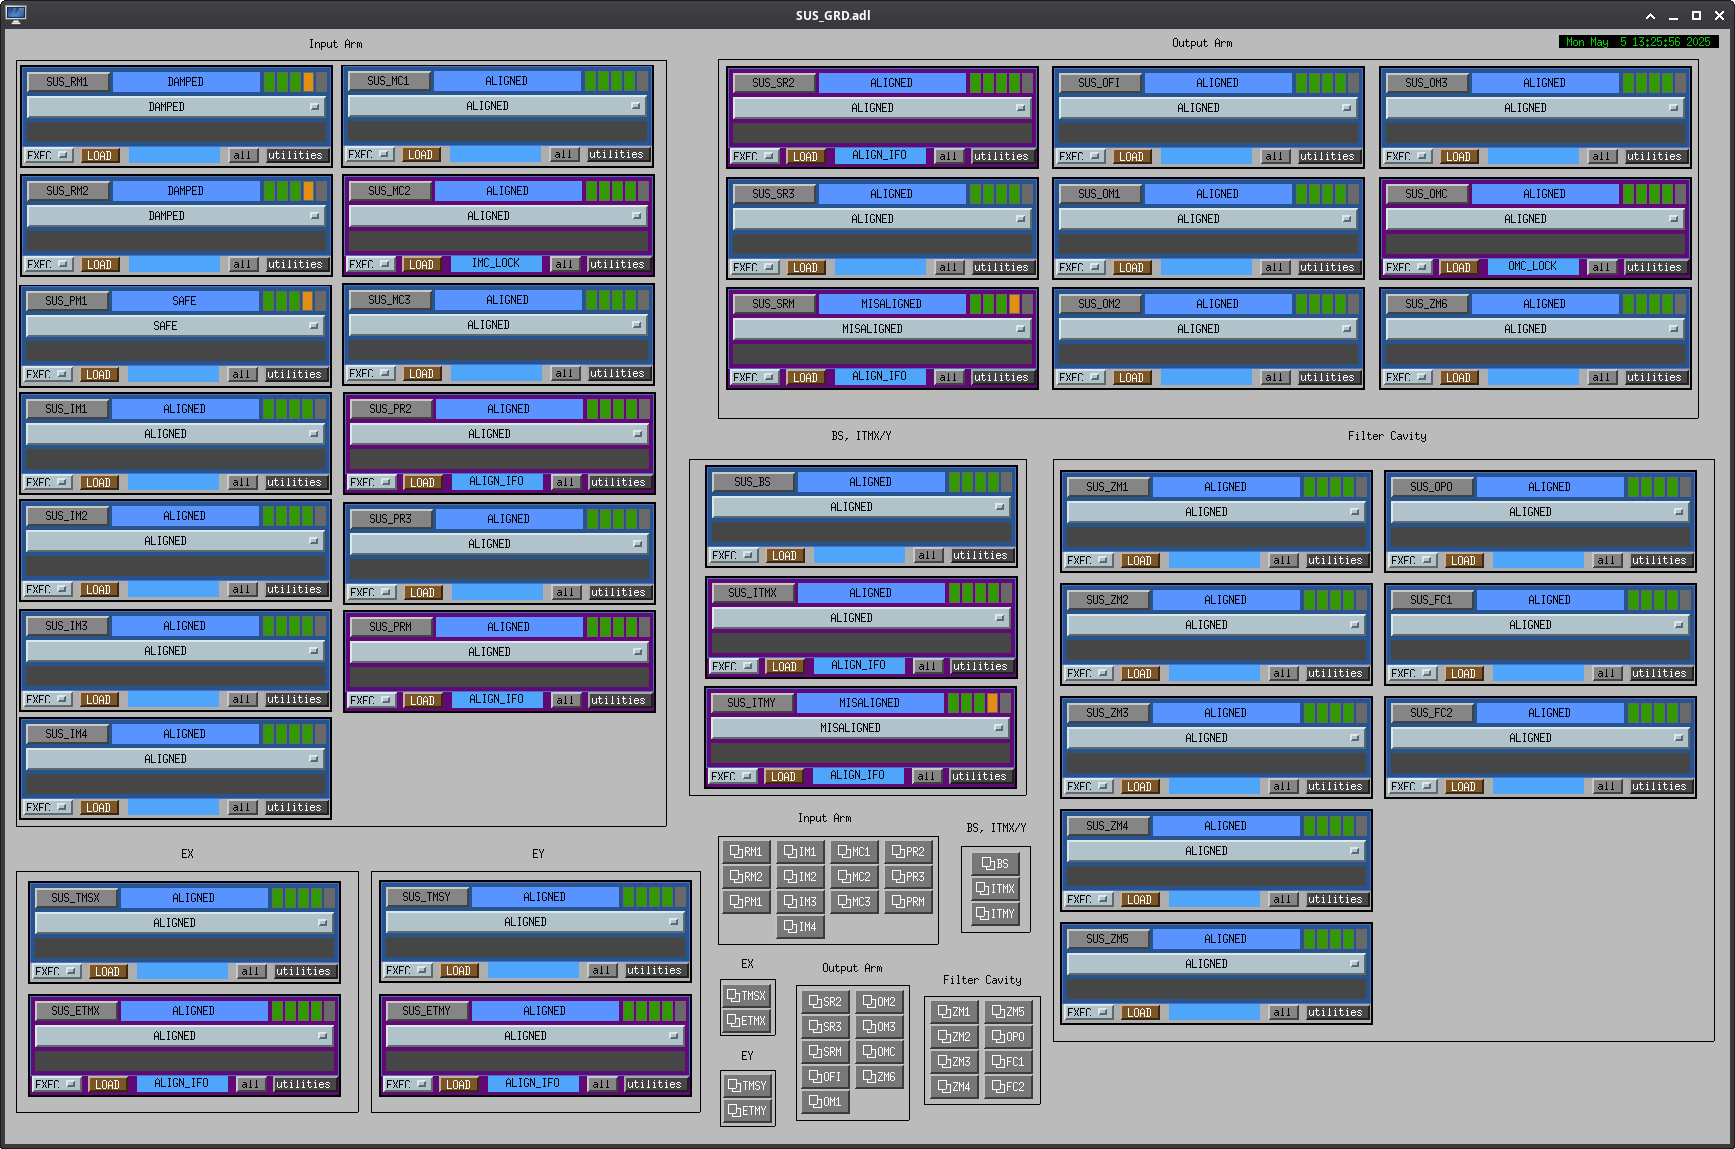
I've updated the SUS_GRD.adl screen (sitemap -> SUS -> Guardians) to include the appropriate node and button for the new PM1 suspension. I also rearranged several things in the window to keep the screen the same size.

Before and after images of this screen are attached.

Images attached to this report
H1 PSL
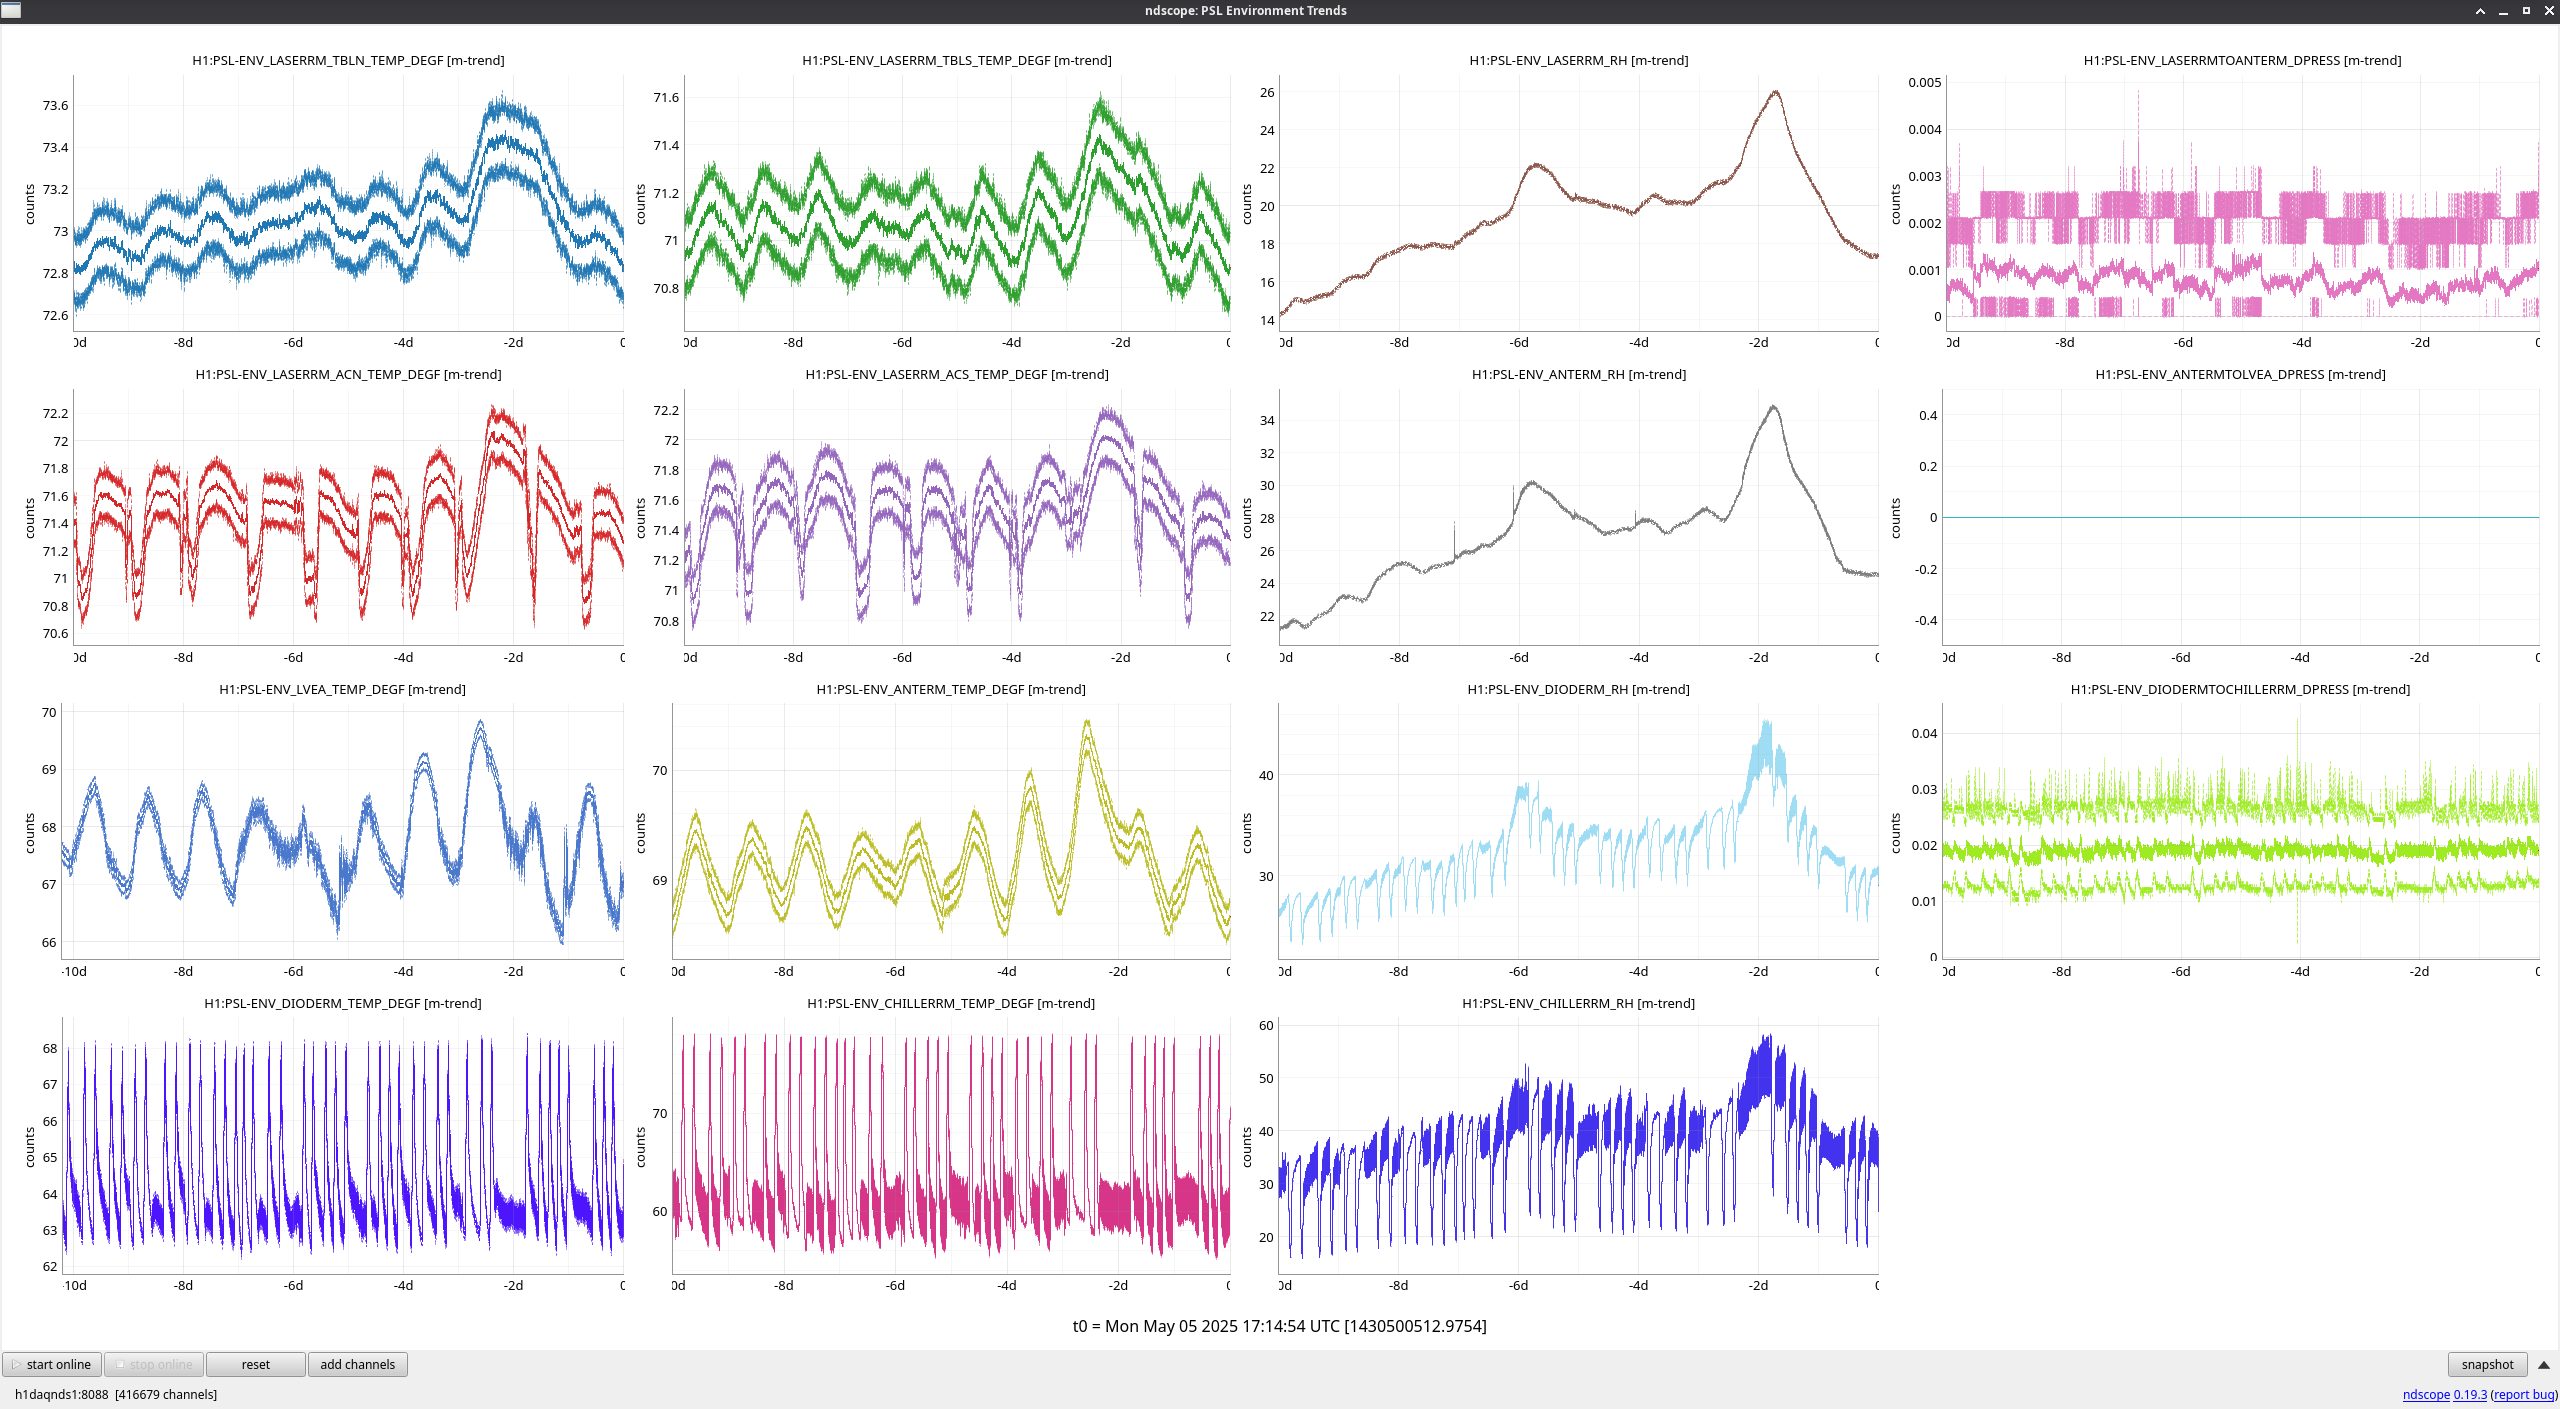
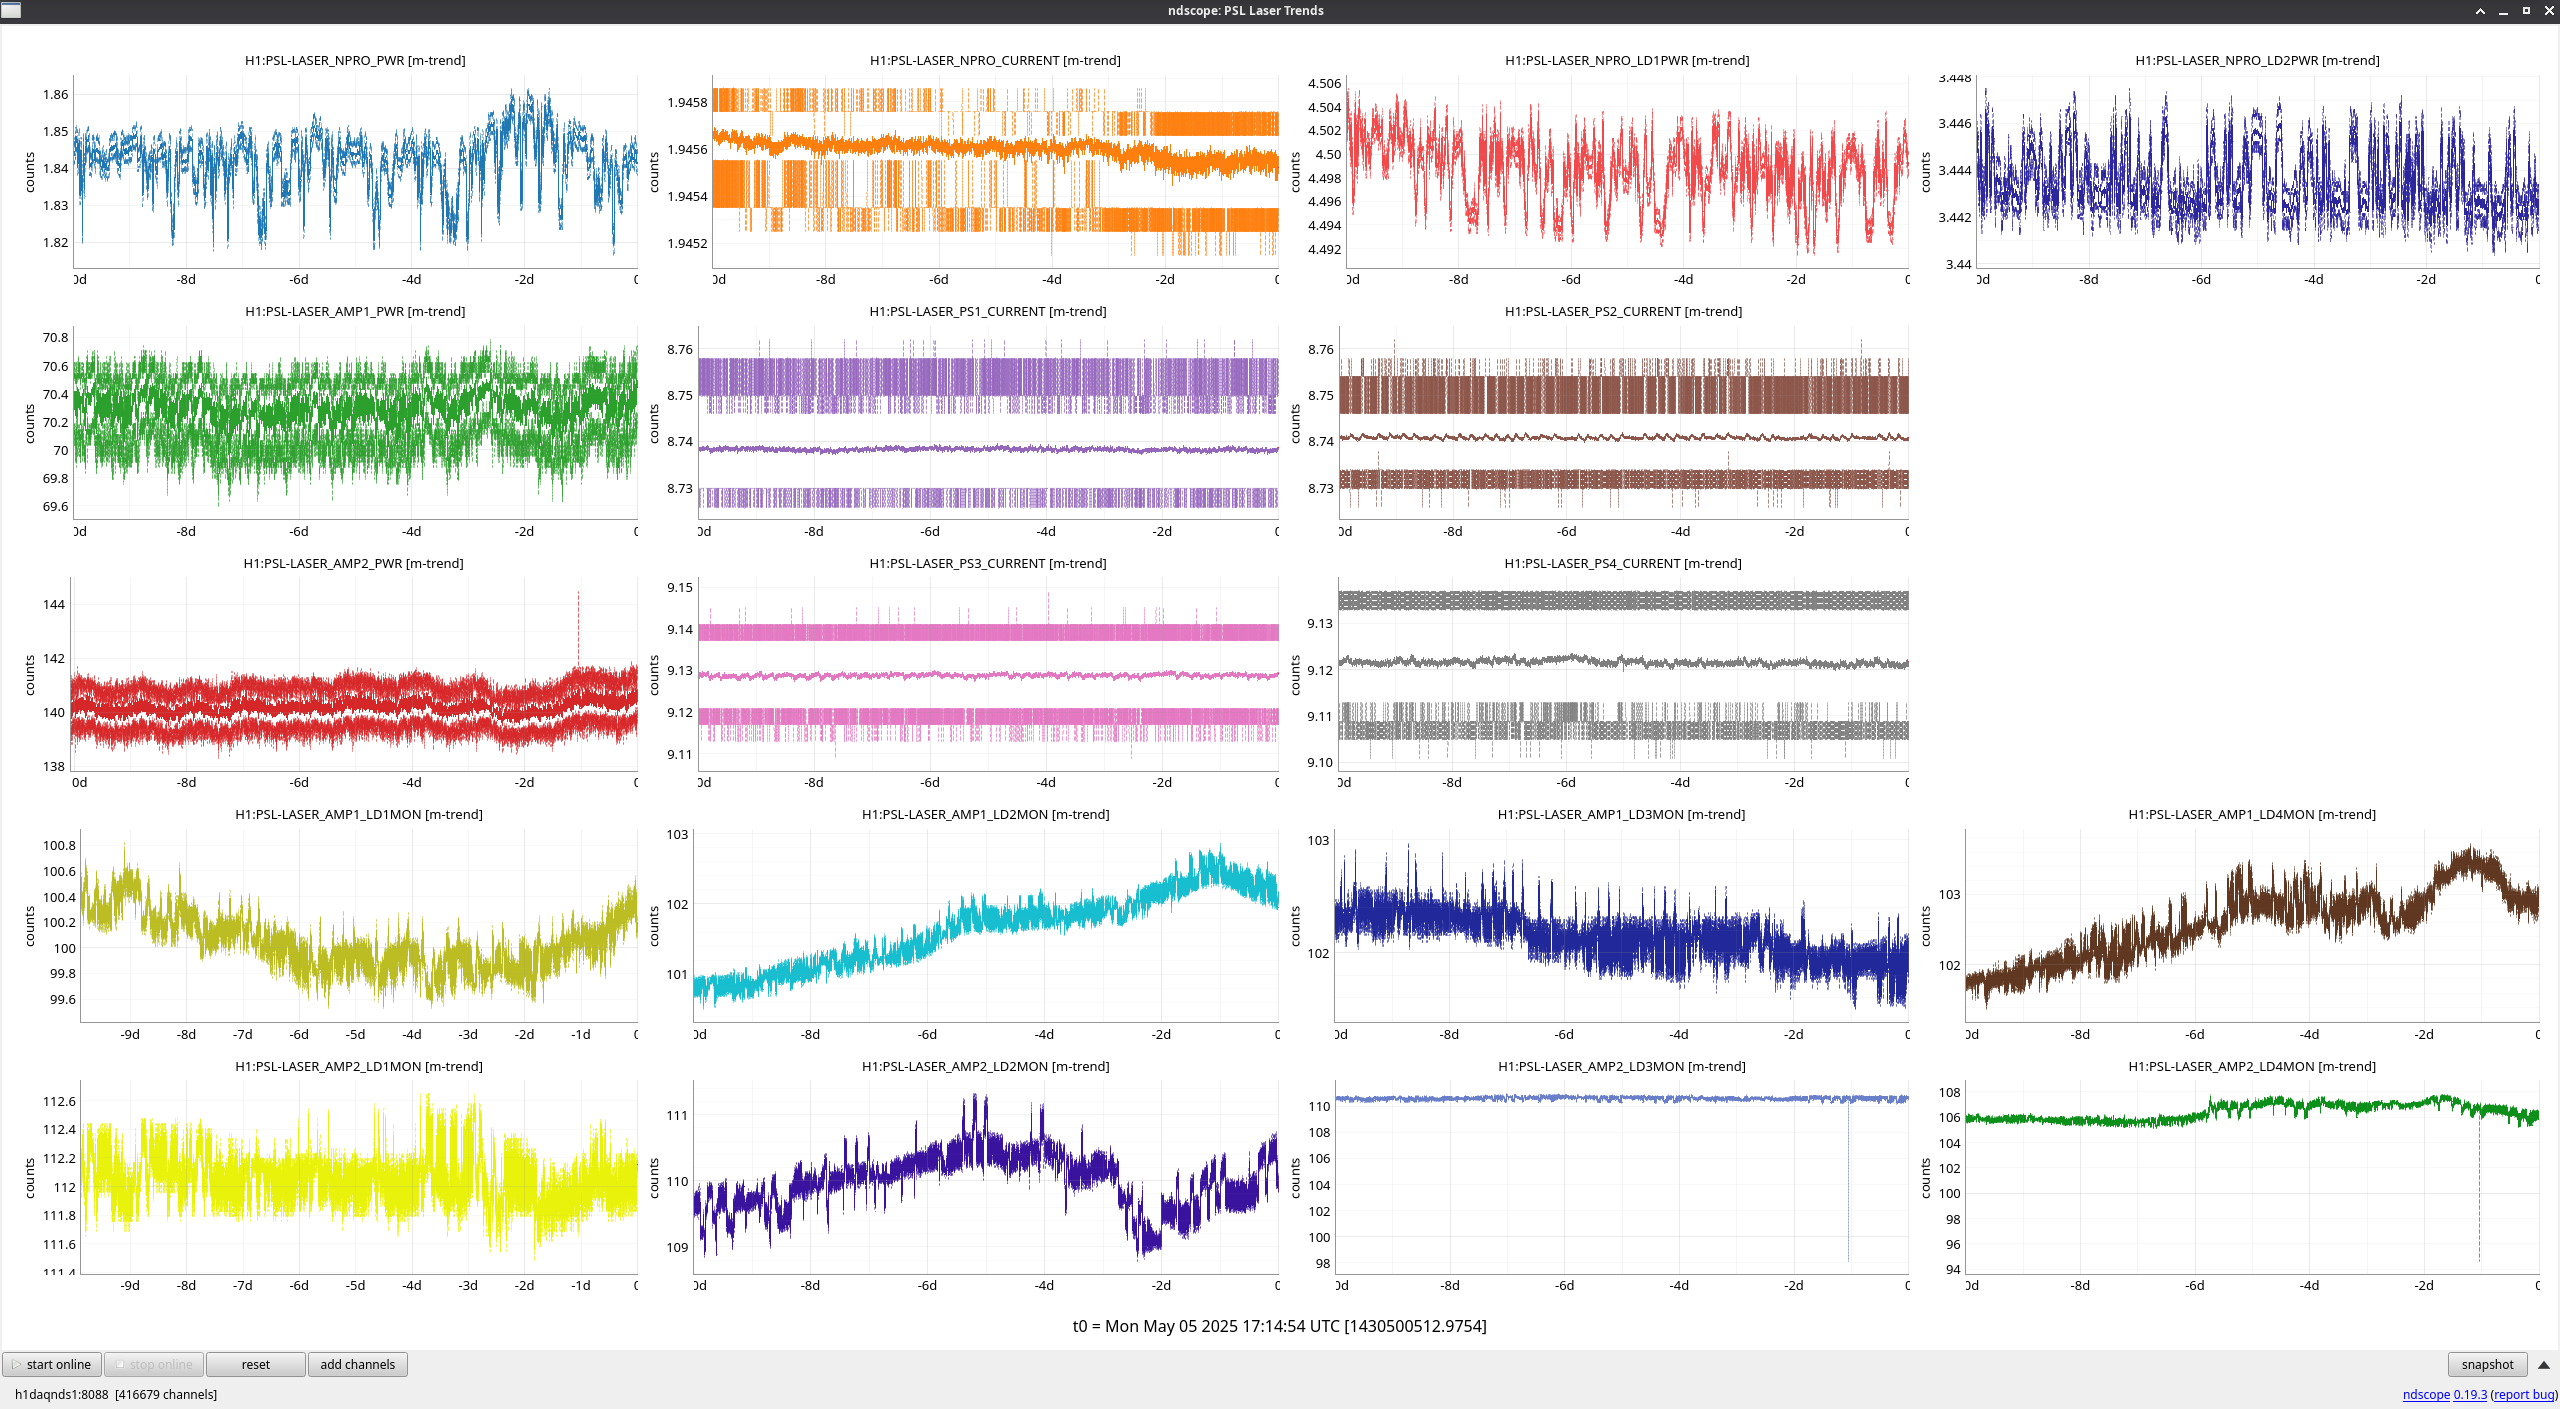
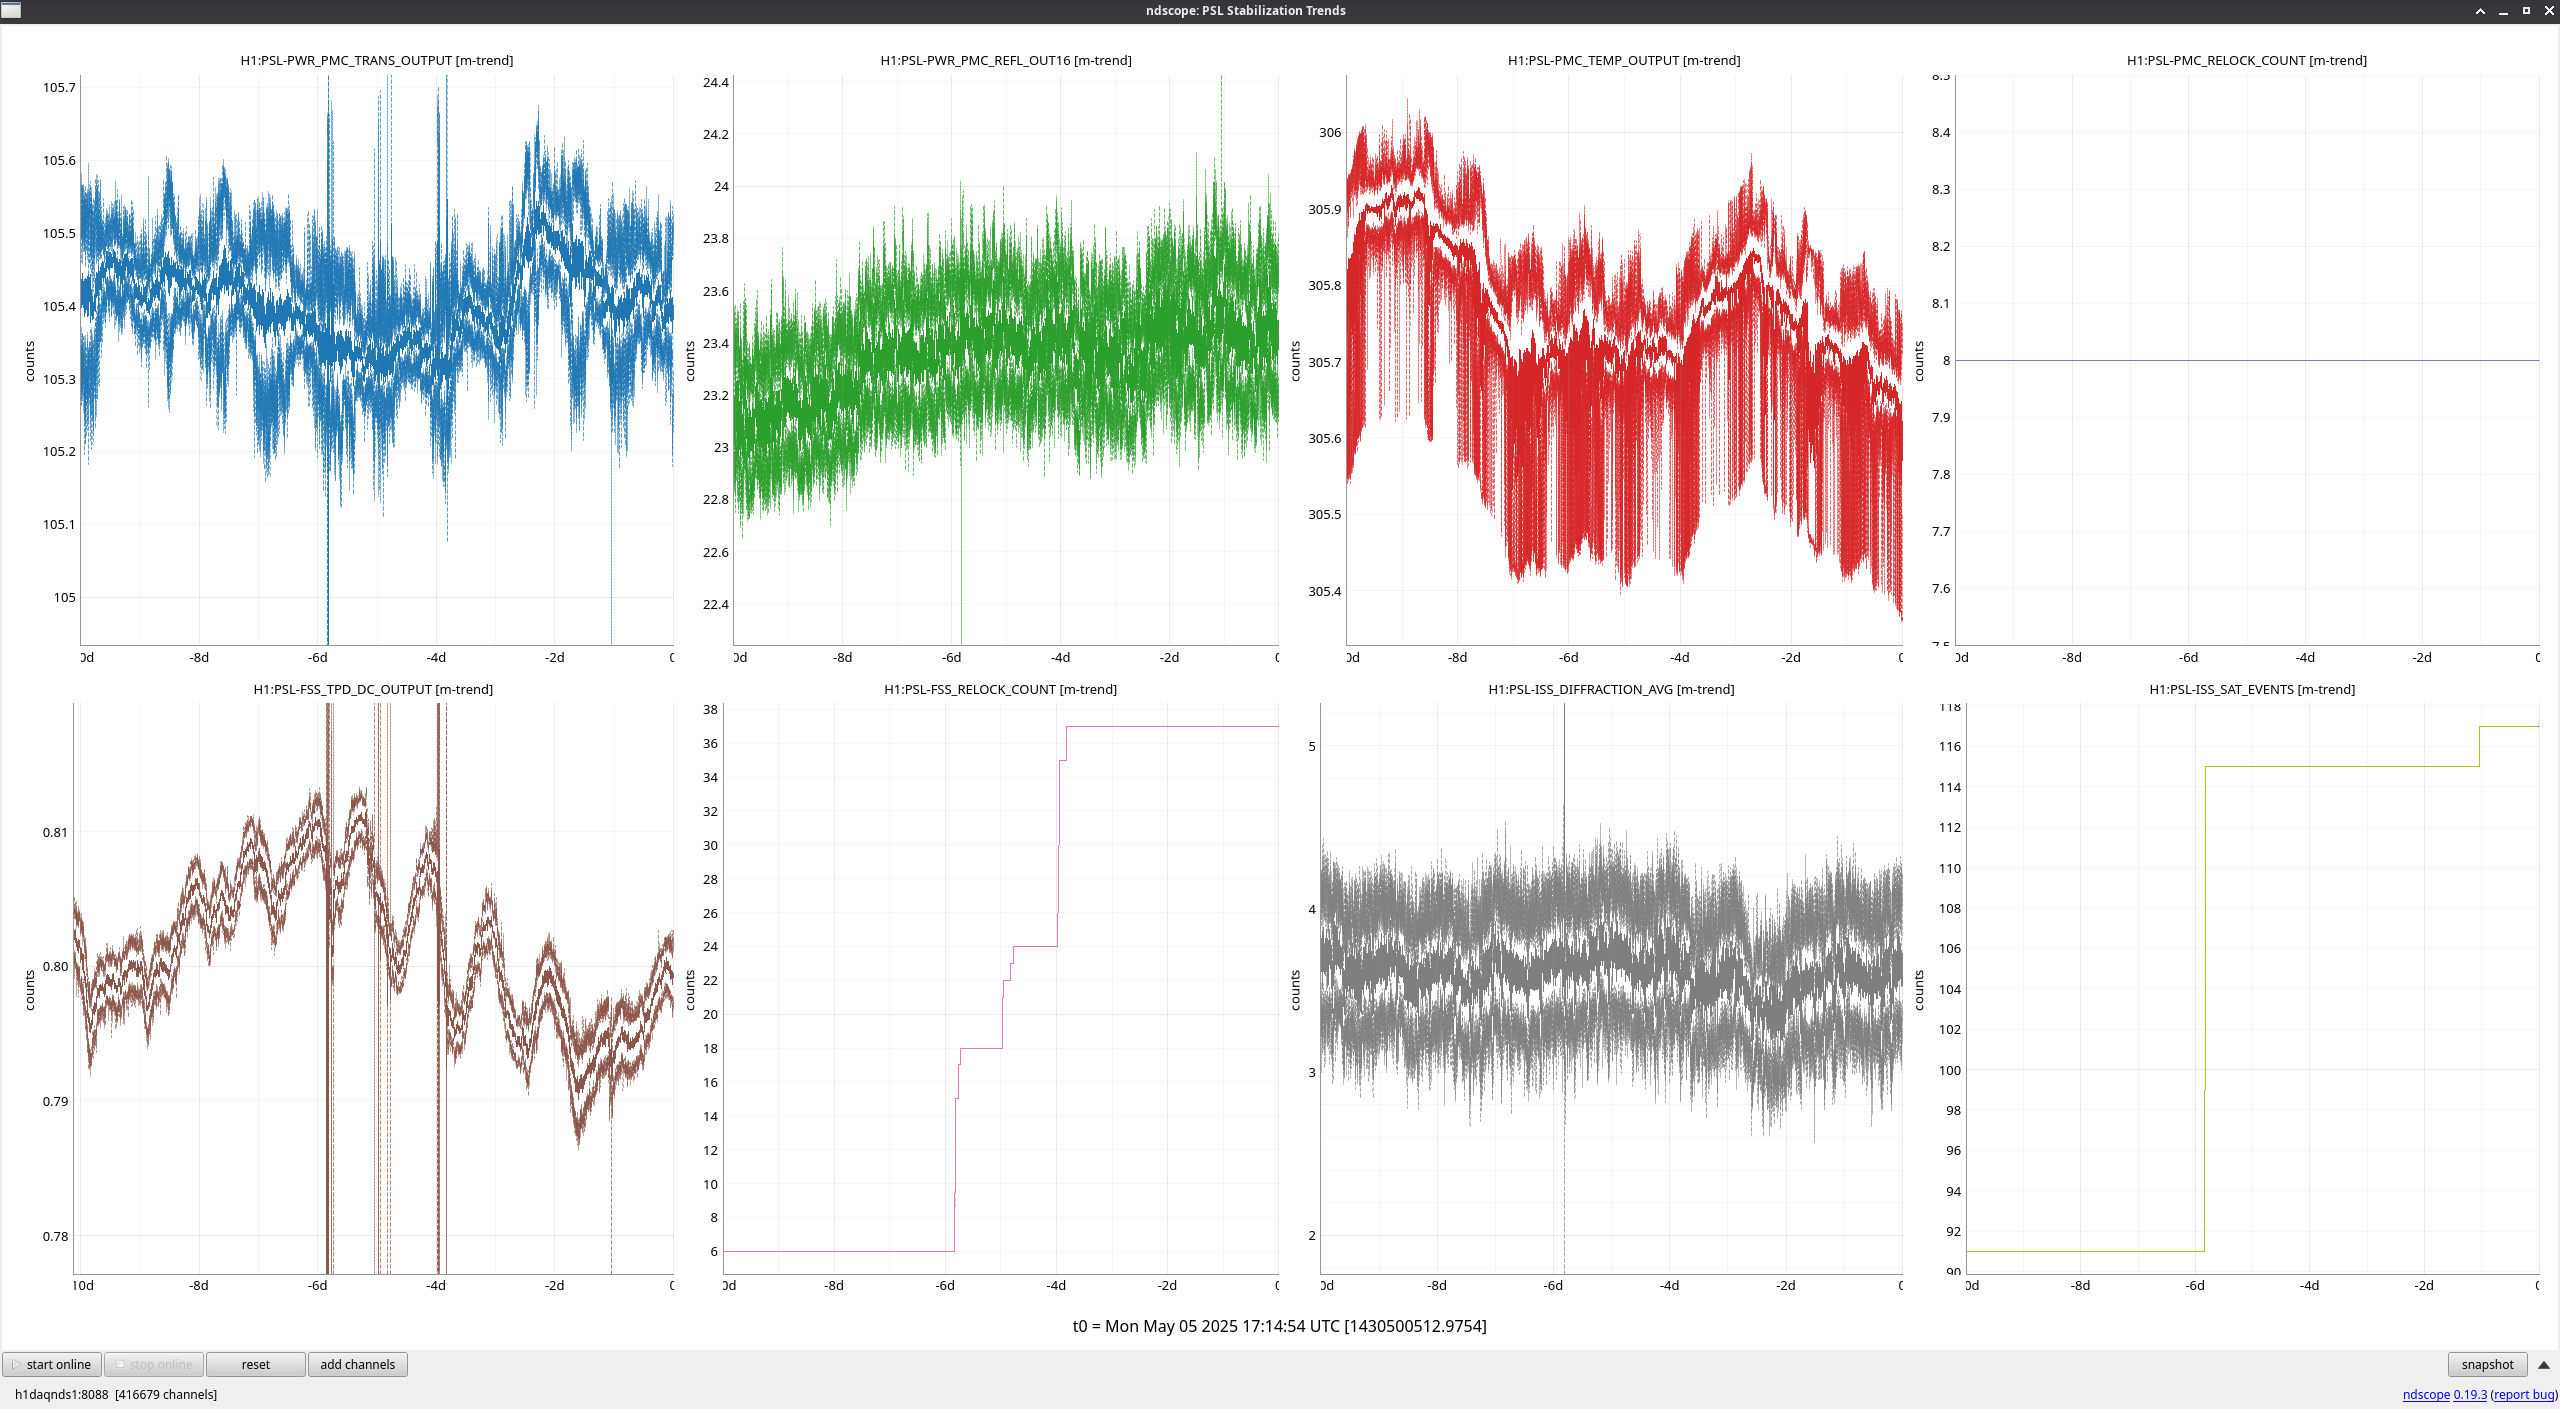
ryan.short@LIGO.ORG - posted 10:34, Monday 05 May 2025 (84253)
PSL 10-Day Trends

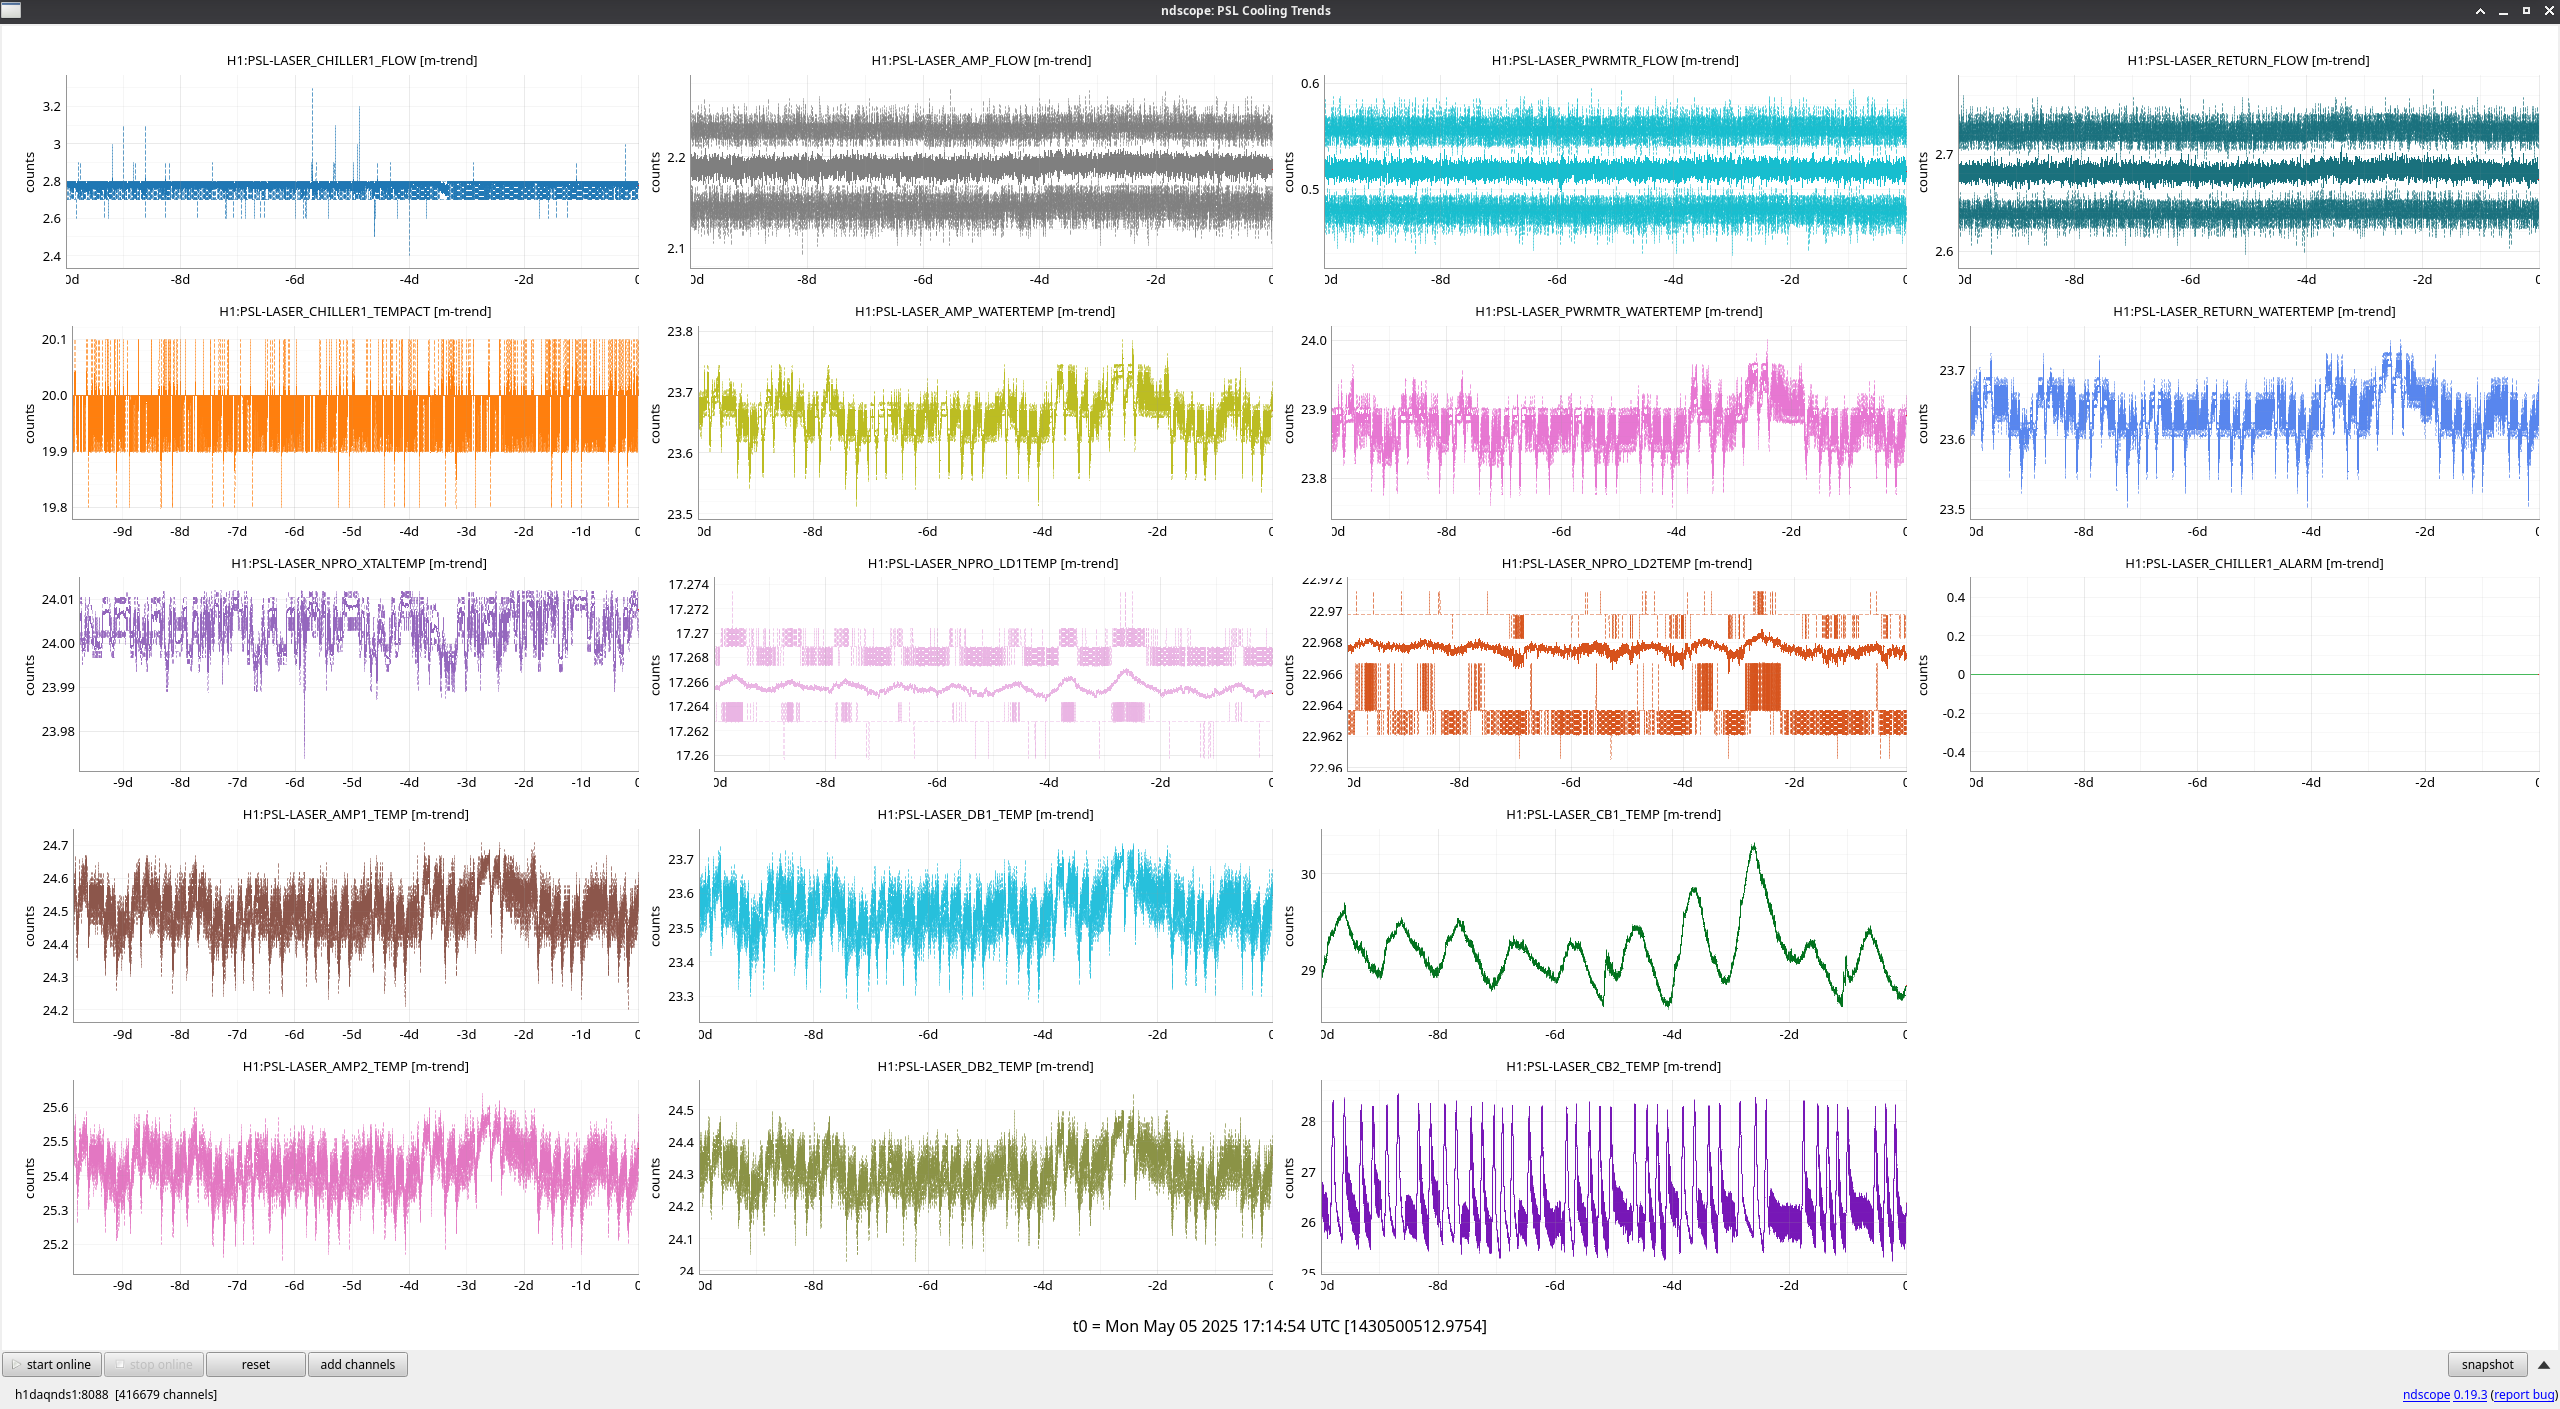
FAMIS 31084

No major events of note this week.

Images attached to this report
LHO VE
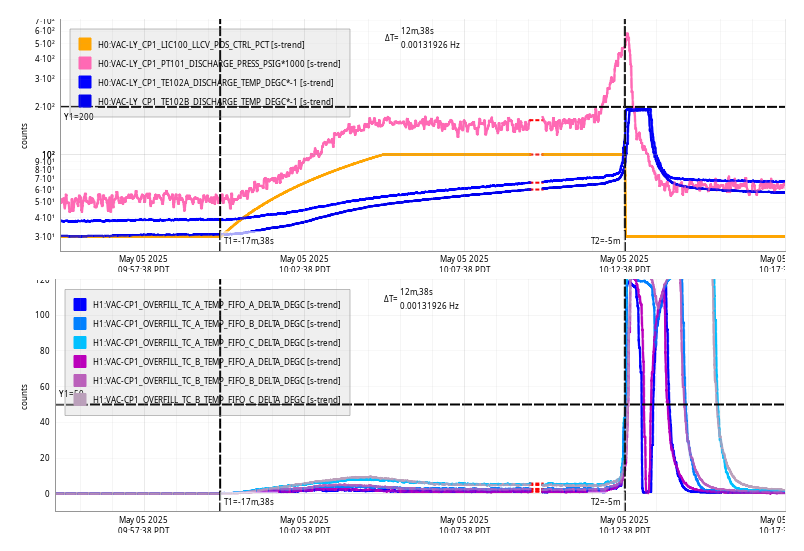
david.barker@LIGO.ORG - posted 10:24, Monday 05 May 2025 (84251)
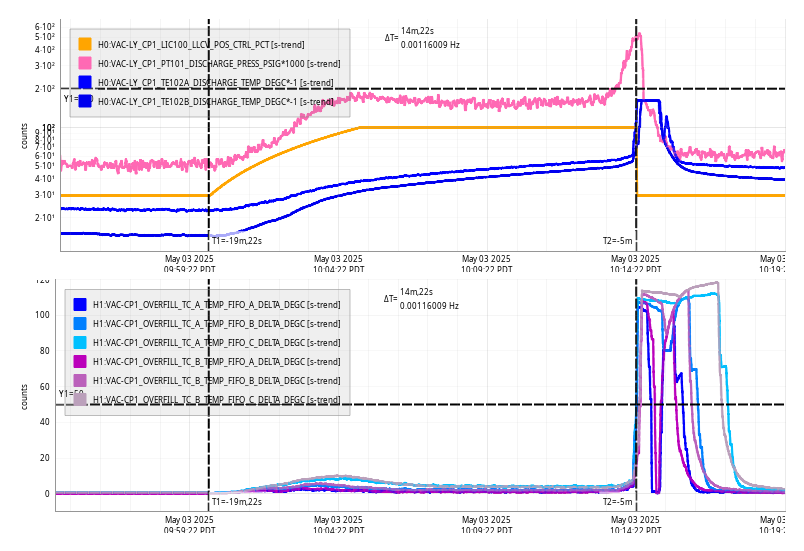
Mon CP1 Fill

Mon May 05 10:12:38 2025 INFO: Fill completed in 12min 34secs


Images attached to this report
LHO VE (VE)
gerardo.moreno@LIGO.ORG - posted 09:12, Monday 05 May 2025 (84250)
Morning Purge Air Check

Dry air skid checks, water pump, kobelco, drying towers all nominal.

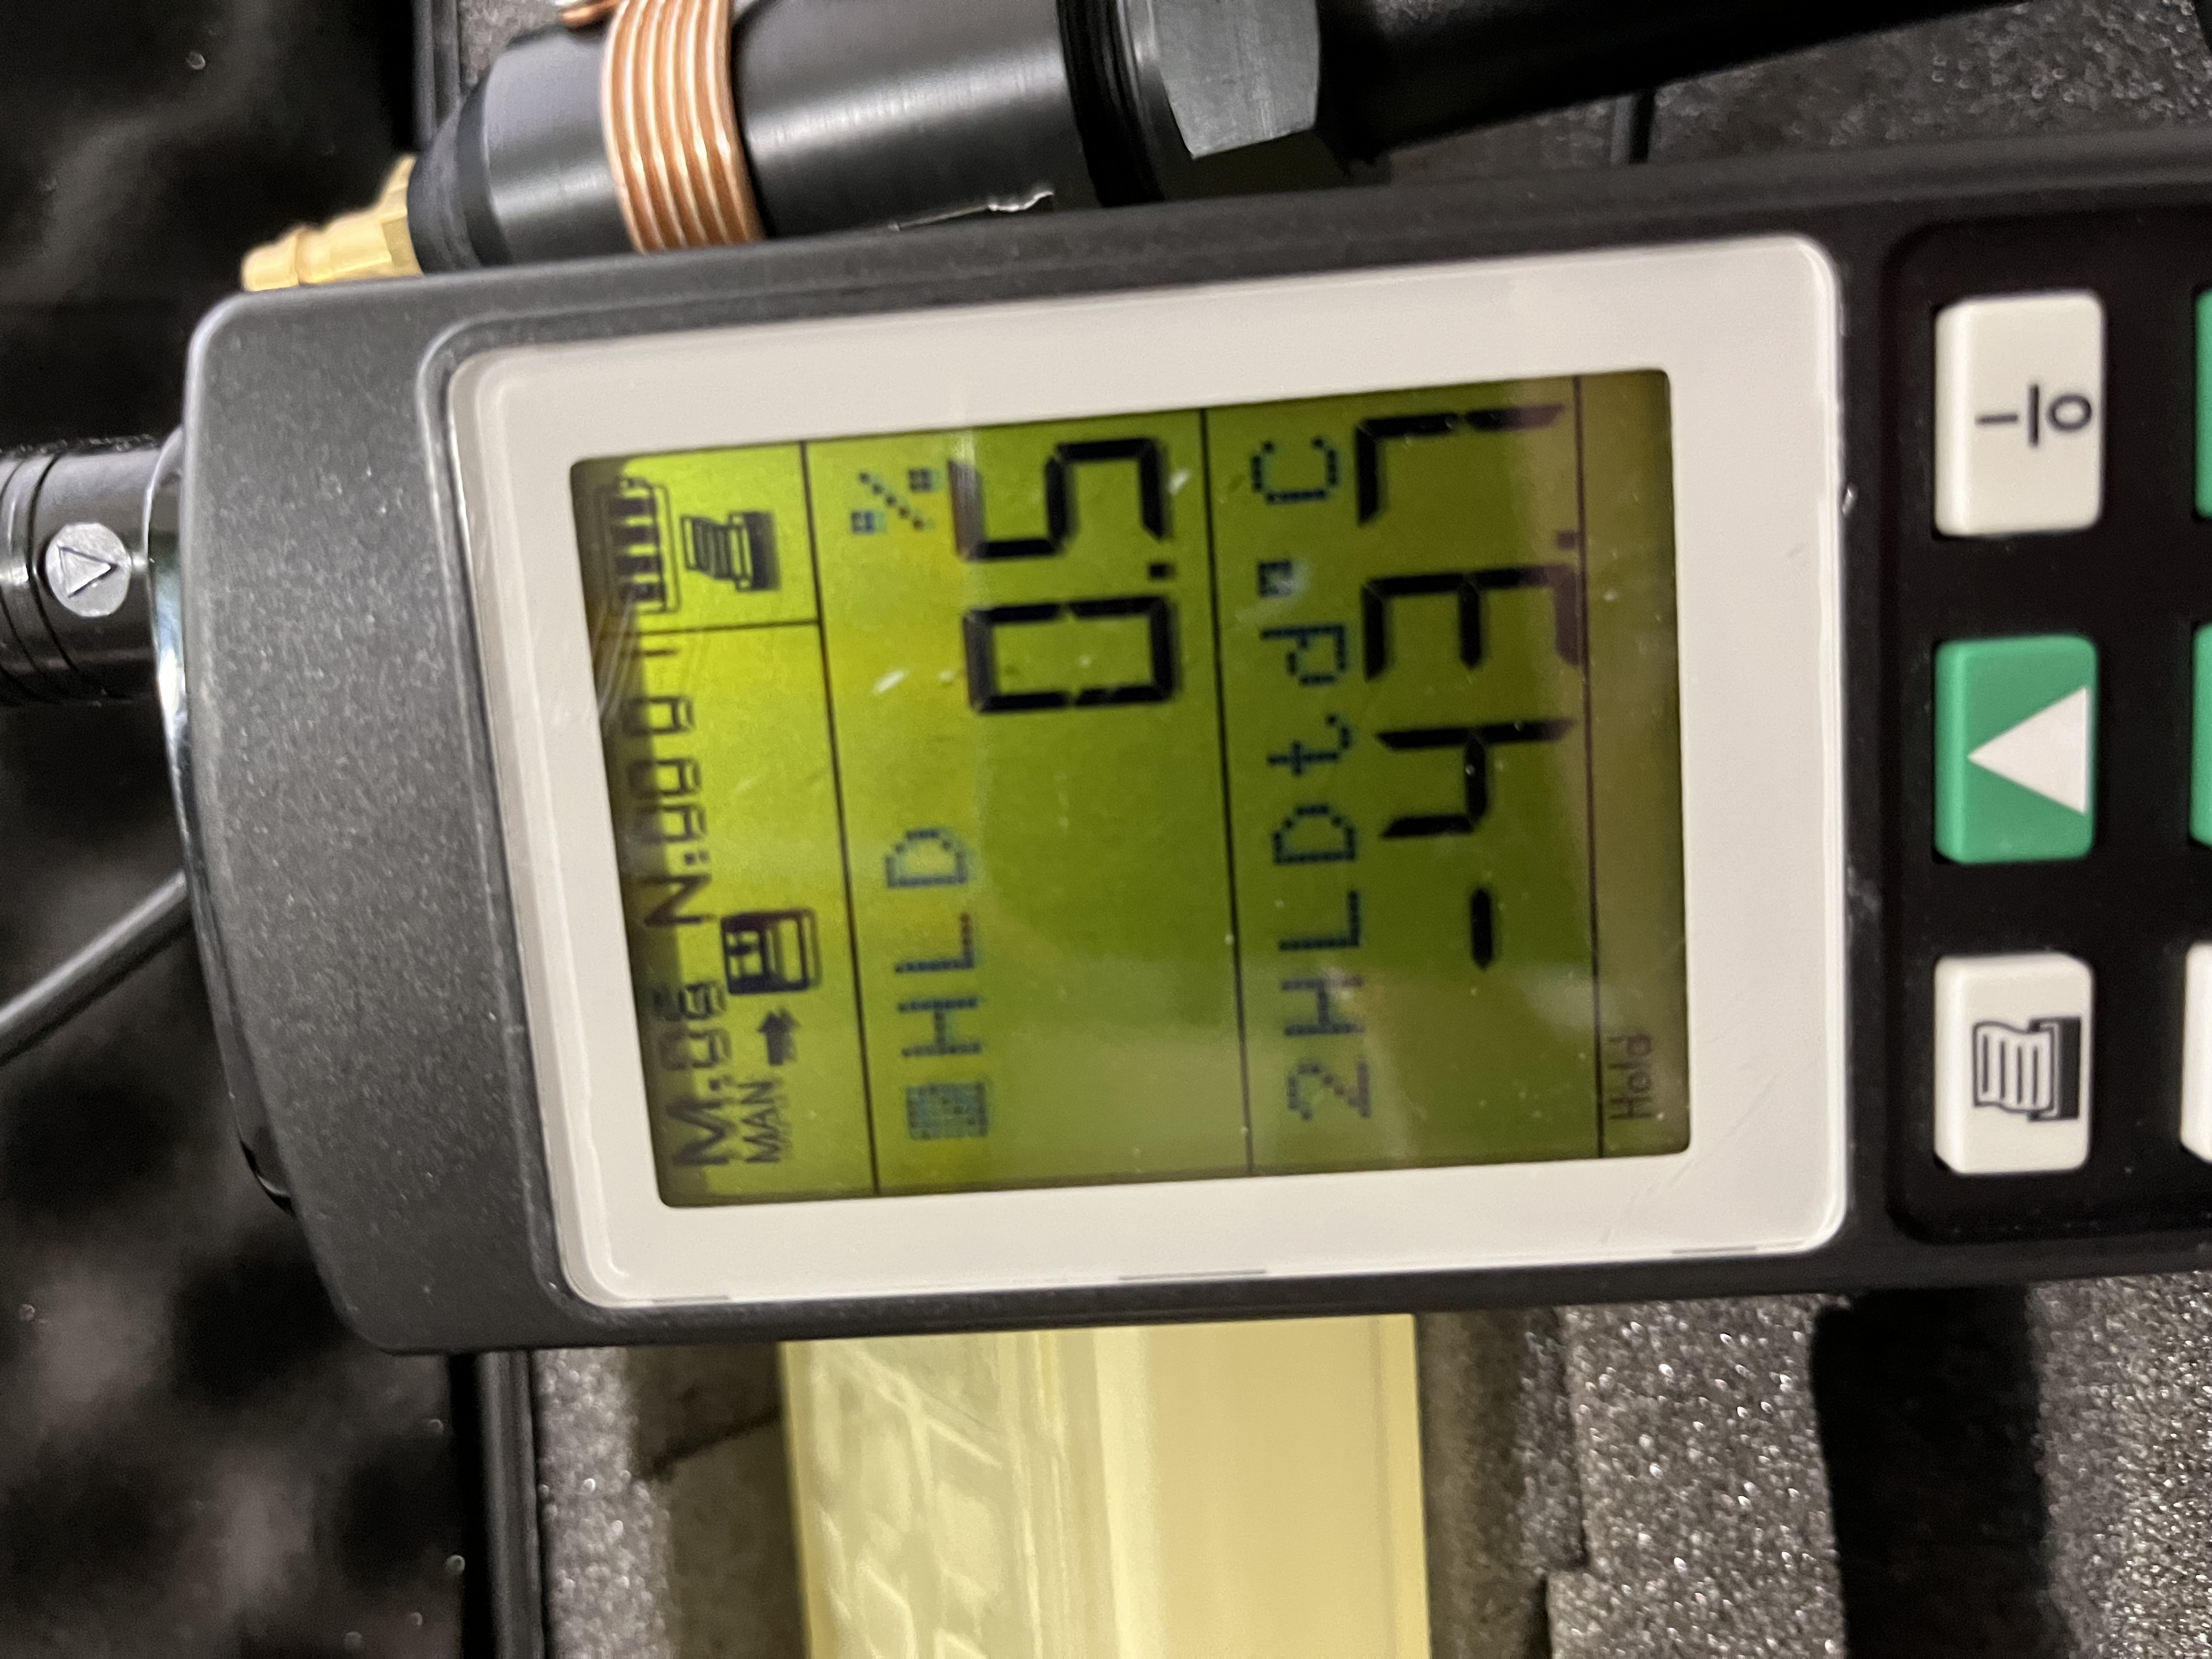
Dew point measurement at HAM1 -43.7 °C.

.

Images attached to this report
LHO VE
david.barker@LIGO.ORG - posted 07:50, Monday 05 May 2025 (84249)
Sun CP1 Fill

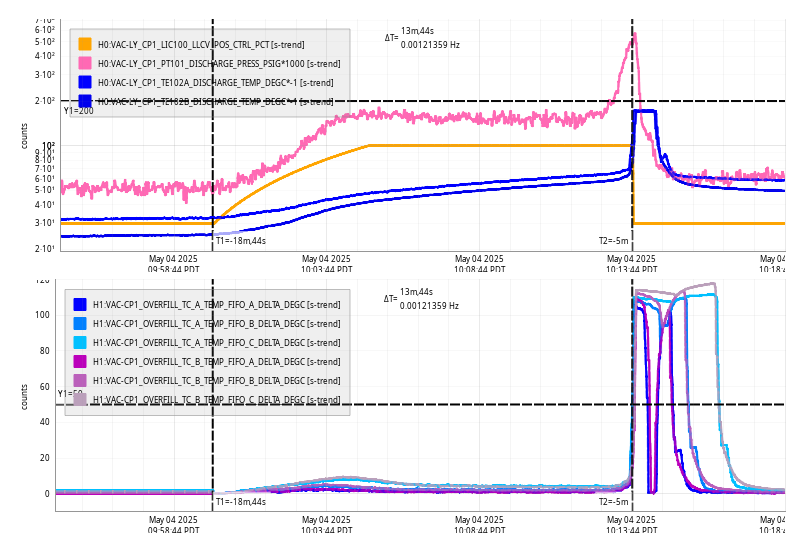
Sun May 04 10:13:44 2025 INFO: Fill completed in 13min 40secs

Late entry for yesterday's fill.

Images attached to this report
LHO General
ryan.short@LIGO.ORG - posted 07:41, Monday 05 May 2025 (84248)
Ops Day Shift Start

TITLE: 05/05 Day Shift: 1430-2330 UTC (0730-1630 PST), all times posted in UTC
STATE of H1: Planned Engineering
OUTGOING OPERATOR: None
CURRENT ENVIRONMENT:
    SEI_ENV state: MAINTENANCE
    Wind: 4mph Gusts, 1mph 3min avg
    Primary useism: 0.03 μm/s
    Secondary useism: 0.12 μm/s
QUICK SUMMARY: Vent work continues this week with ongoing alignment/profiling in HAM1 and work on the EY wind fence.

H1 CDS
david.barker@LIGO.ORG - posted 18:51, Sunday 04 May 2025 (84247)
Vertex vacuum gauges added back to VACSTAT

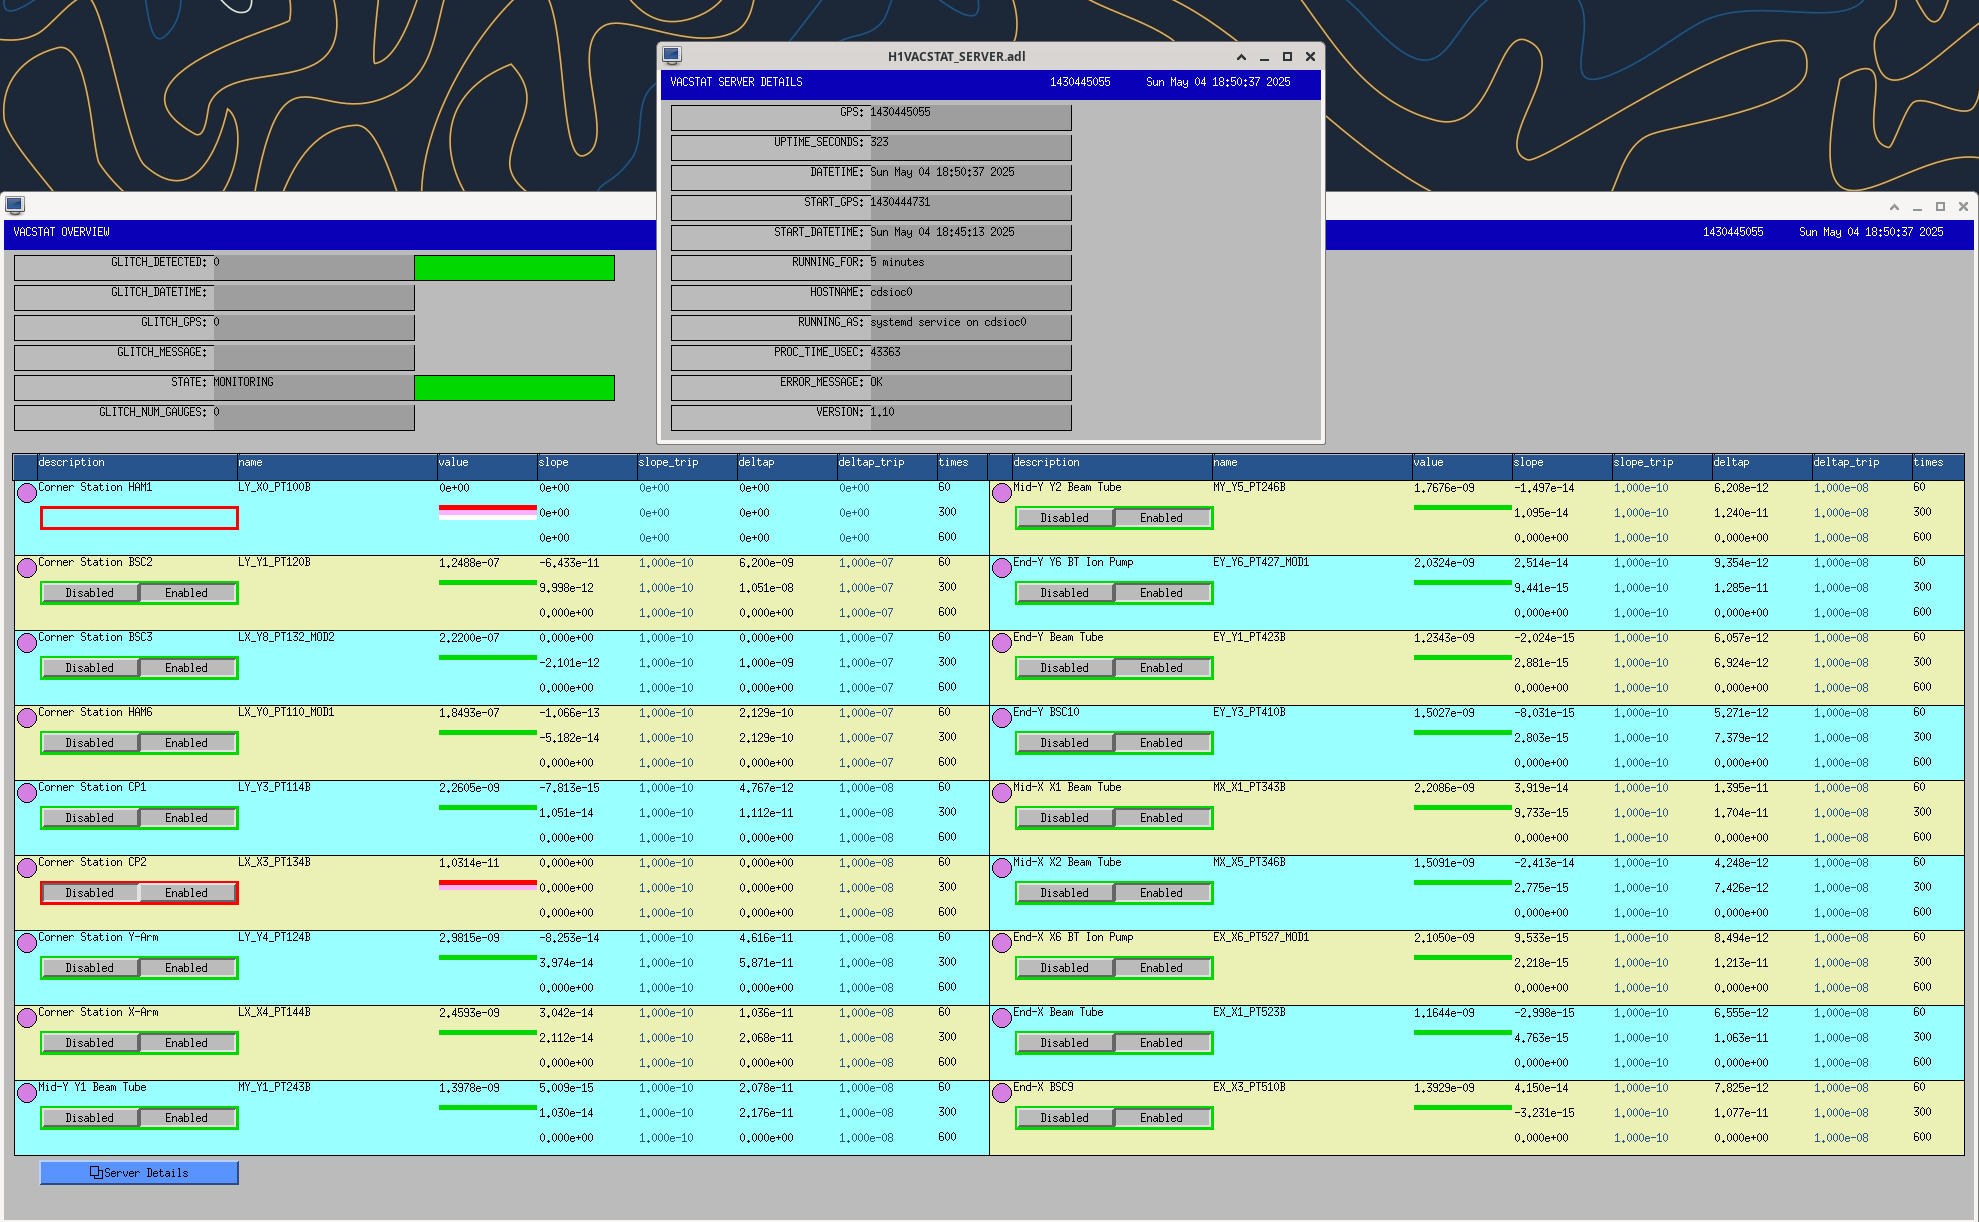
Following the vacuum issue this morning, the vacuum gauges for BSC2, BSC3 and HAM6 have been added back to VACSTAT. These gauges, plus HAM1, had been removed from VACSTAT at the beginning of the vent on 02apr2025. A temporary IOC vacstat_dummy_ioc.py had been running to serve the missing channels to the EDC.

This evening I added BSC2, BSC3, HAM6 back to vacstat's prod.yaml and restarted the service. I then removed these from vacstat_dummy_ioc.py (it now only simulates HAM1).

I re-enabled the VACSTAT multiple gauge alarm to the vacuum team in the alarms system, which was restarted at 18:34.

After the vacstat restart we quickly got a delta-p alarm for BSC2 because it still had the default sensitivity of 1e-08 but the vertex is currently running in the 1e-07Torr range. The sensitivities for BSC2,3 and HAM6 were reduced to deltap=1e-07 and vacstat was restarted.

Images attached to this report
H1 CDS
david.barker@LIGO.ORG - posted 10:47, Sunday 04 May 2025 (84246)
Power glitch at 09:09:51

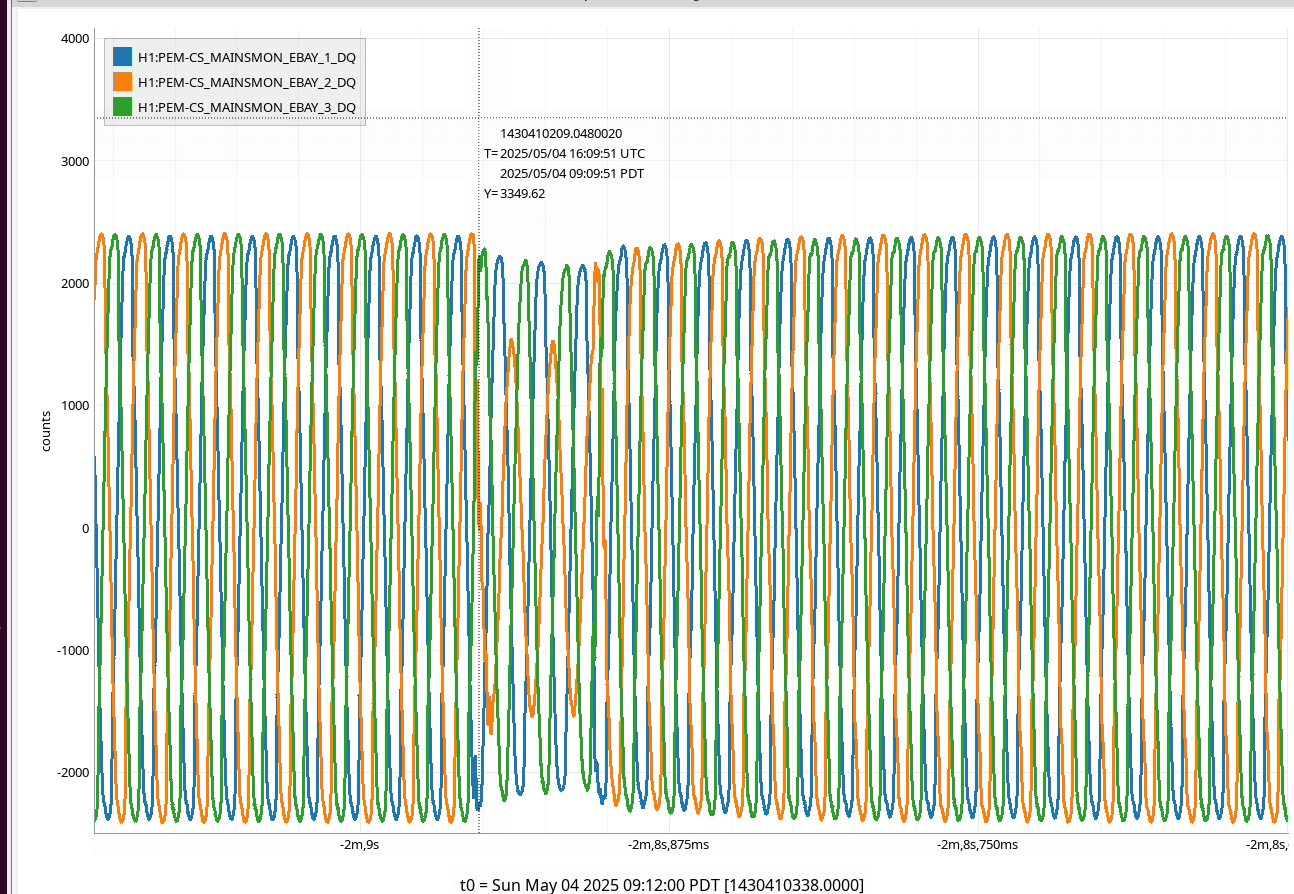
We had a power glitch 09:09:51 Sun 04may2025 PDT.


GC OSB UPS:

Time : 08:09:51
Code : 0x0109

Warning - UPS: On battery power in response to an input power problem.

Time : 08:10:11
Code : 0x0210

Informational - UPS: An input voltage or frequency problem no longer prevents switching to bypass mode.

Images attached to this report
LHO VE
janos.csizmazia@LIGO.ORG - posted 10:39, Sunday 04 May 2025 (84245)
LVEA turbos tripped
Today morning I checked the pressures, and they were suspiciously high. After refreshing the screenshots a few times, it was evident that we lost pumping power.
After arriving at the site, I immediately saw that all the 3 major turbo stations were tripped. In detail, the XBM and the OMC turbo stations were completely tripped (big and small backing turbos, scroll pumps tripped, all safety valves closed). At YBM only the main turbo was tripped, and only the main safety valve was closed.
The first trip happened at ~9:10 am this morning, and the other 2 between 9:10 and 9:20 am, roughly.

I closed the big gate valves, checked the crush bearings (all were 100%), restarted all the stations, and now they are all valved back in.
LHO VE
david.barker@LIGO.ORG - posted 10:35, Saturday 03 May 2025 (84244)
Sat CP1 Fill

Sat May 03 10:14:22 2025 INFO: Fill completed in 14min 18secs

Images attached to this report
H1 CDS
david.barker@LIGO.ORG - posted 07:12, Saturday 03 May 2025 (84243)
LAB Dust Monitor EPICS IOC failed again

LAB DUST-1 failed again at 05:44:06 Sat 03may2025 causing the EDC is disconnect from 32 channels.

Prior to the IOC crashing, there was a 10 minute stretch between 02:35 and 02:46 where the particle count was over 5000, it was below 100 at all other times.

I've restarted the DUST-LAB IOC to green up the EDC. If this continues I could simulate this IOC until Ryan can investigate.


H1 ISC
elenna.capote@LIGO.ORG - posted 16:55, Thursday 01 May 2025 - last comment - 09:17, Thursday 08 May 2025(84230)
REFL Beam Profile Measurements

Keita, Elenna, Jennie W.

We have taken three beam profile measurements along the REFL path on HAM1: one in the location where REFL WFS B will go, one in the location where REFL WFS A will go, and one measurement further "downstream" where we placed a steering mirror after where WFS B will go and steered back towards the edge of the table. We will post further details later, more measurements to be made along this path tomorrow.

Comments related to this report
keita.kawabe@LIGO.ORG - 16:32, Friday 02 May 2025 (84241)

Note that the same glitches we had in the original installation (alog 8934) were still there. Quoting my alog from 2013,

it was still difficult to obtain good data because of some kind of glitches. It's not clear if it was due to NanoScan or the beam, the beam was well damped and was not moving on the viewer card, there was no noticable intensity glitch either. But the symptom was that the statistics window shows nice steady data for anywhere from one second to 30 seconds, then there's some kind of glitch and the scan/fit image looked noticably different (not necessarily ugly), the diameter mean becomes larger and the stddev jumps to a big number (like 10% or more of the mean, VS up to a couple % when it's behaving nice), and the goodness of fit also becomes large. Somehow no glitch made the beam diameter number smaller. I just kept waiting for a good period and cherry-picked.

keita.kawabe@LIGO.ORG - 16:30, Friday 02 May 2025 (84240)

We measured the beam radius using NanoScan at four points around the WFS sled (roughly WFSA position, roughly WFSB position, far field 1, far field 2). We used D4sigma numbers instead of 1/e**2 numbers. NanoScan outputs diameter not the radius, and the table below shows the raw number.

We assumed that the WFS position would be ~0.5" from the +Y edge of the WFS sled for both A and B. Distances were measured using stainless steel rulers and are relative to the 50:50 splitter on the WFS sled that also acts as the steering mirror for WFSa.

position distance [mm] 2*avg(wx) [um] 2*std(wx) 2*avg(wy) 2*std(wy)
WFSA 94 670.26 2.34 778.95 2.82
WFSB 466.5 793.73 6.38 711.29 11.95
downstream 2 788.5 1484.15 12.46 1387.24 58.32
downstream 1 1092.5 2253.78 50.67 2119.24 68.30

In all of the above measurements, "Profile averages" was 10, "Rolling profile Averages" was 3.

We also measured between M5 and 50:50 splitter for ASC-LSC split as well as between M2 and RM1. Numbers will be added to this alog.

We'll also measure the beam size at LSC REFL_B location on Monday before proceeding to POP path.

elenna.capote@LIGO.ORG - 16:41, Friday 02 May 2025 (84242)

Here are some comments about the measurement process:

The beam profiler is difficult to use because the profiler head easily swivels once it is place. The swivel seems to be driven by the fact that the cable is very stiff and made stiffer by the addition of the foil so it is cleanroom safe. Several times today, I would pick up or set down the profiler and the head would swivel. I tried tightening the screw holding the post to the base, and I tried tightening the screw that holds the post to the head, but it is not tight enough to prevent swiveling. I found the best method was to line up the profiler in the designed location, and hold the head and cable in place while someone else ran the measurement. That makes this a minimum two person job, but there was enough juggling that having a third person was sometimes helpful.

When we went in around 3 pm to do the final measurement of the day I measured the particle count: 0.3u was 10 and 0.5u was 0. I used the standing particle counter on the +Y side of the HAM1 chamber- briefly unplugged to carry it over to the -Y side for the measurement. I didn't measure when closing up because Keita is heading out to do a few more tasks on HAM1. The handhelp particle counter isn't working, so we have to carry this large one on a stand around to use.

keita.kawabe@LIGO.ORG - 11:10, Monday 05 May 2025 (84252)

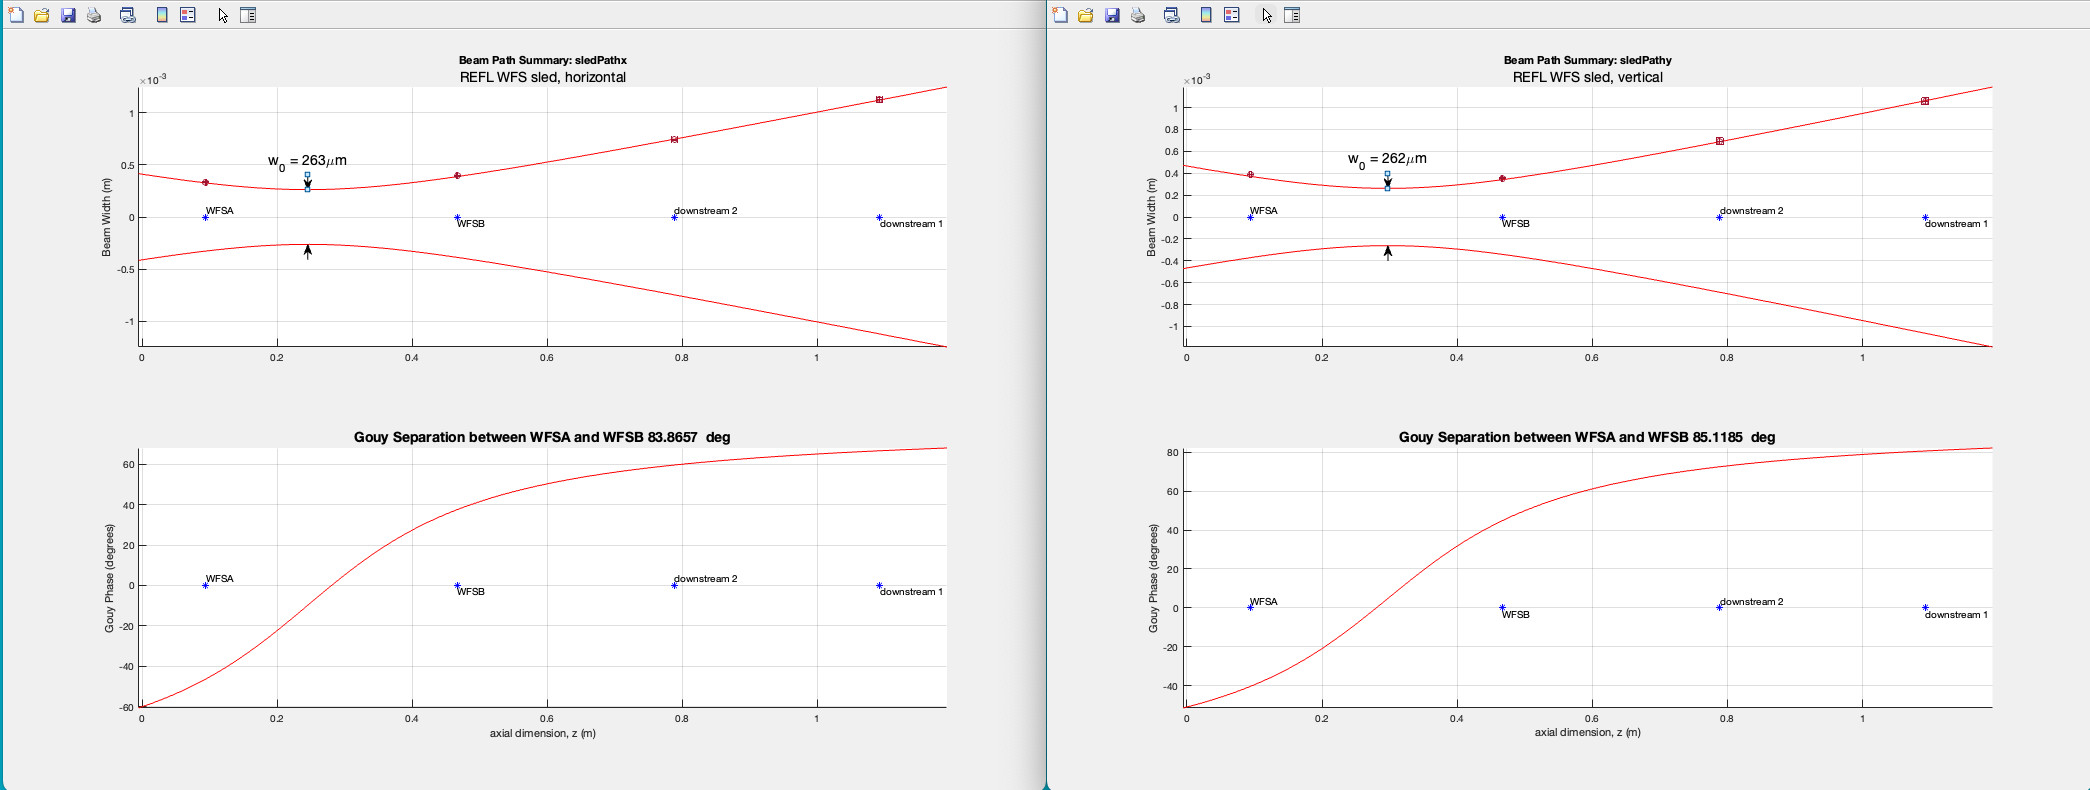
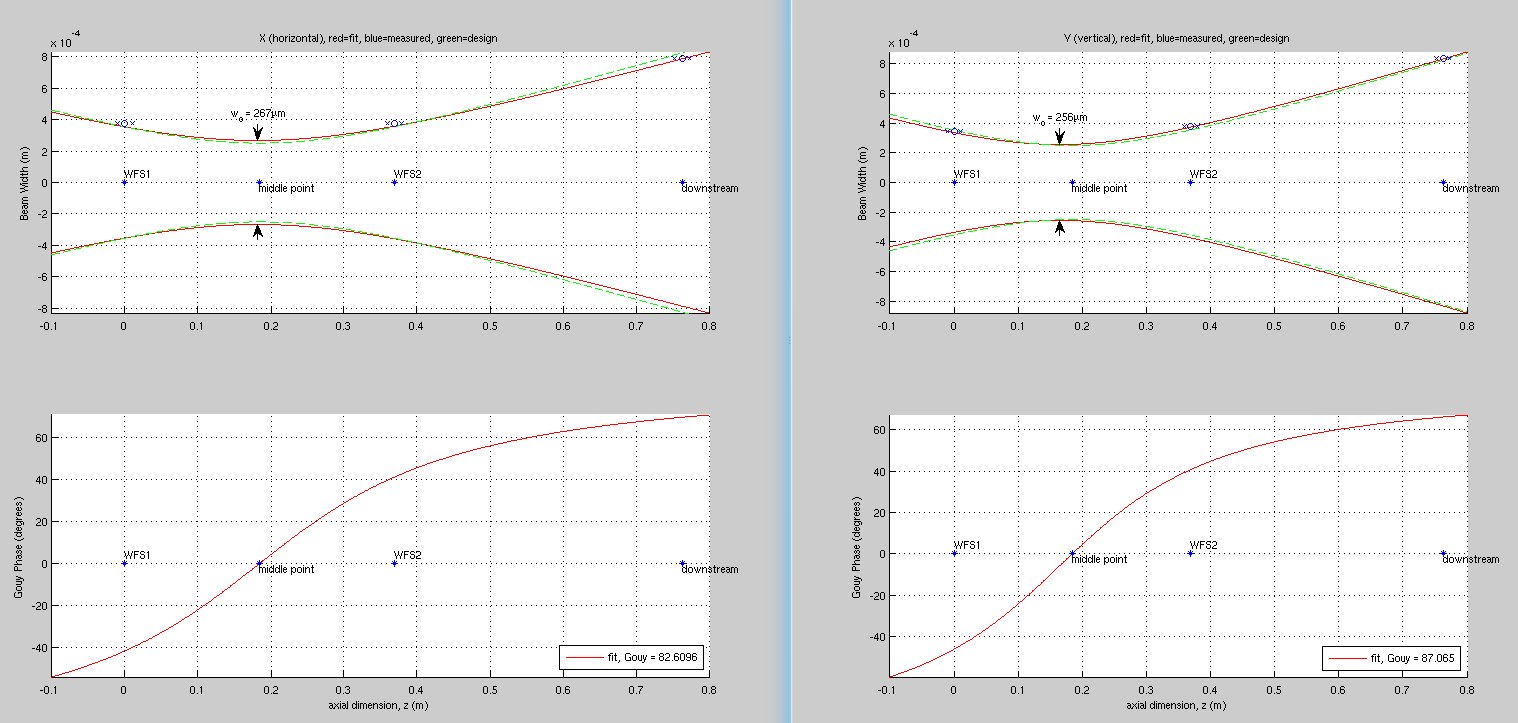
WFS sled is still excellent, 84 to 85 deg Gouy phase separation.

In the attached, four measurement points have error bars both in the position and the beam size but it looks negligible. There's no concern for WFS, it's good to go as is. 

However, just for the record, the astigmatism is bigger now (which is inconsequential in that ASC DOF separation is determined by the Gouy phase even if there's an astigmatism). The waist location difference is ~49mm now VS ~14mm or so before (just eyeballing the old plot from alog 8932) for a beam with the Rayleigh range of ~200mm. Not sure if this is the result of the AOI change or beam position change on curved mirrors and lenses, but I won't fix/correct this.

Images attached to this comment
elenna.capote@LIGO.ORG - 11:40, Monday 05 May 2025 (84254)

This morning we entered to do one more beam profile measurement. First Jennie and I refoiled the cable of the nanoscan profiler, since it was very stiff from multiple layers of foil. Then, before opening the cover to the table, I measured the dust counts by carrying the stand particle counter over to our working side like I did on Friday. The read was 0 and 0 for 0.3um and 0.5 um particles. I know it was working however, because as I carried the counter over outside the cleanroom it counted 19 each of 0.3 and 0.5 um particles.

Then, Jennie and I took one more beam profile measurement, this time on the LSC REFL path, after the final beamsplitter (M18). LSC REFL A (on transmission of M18) is placed on the table as in the drawing, but the LSC REFL B sensor (reflection of M18) was further away relative to the splitter. My quick rough measurement showed that LSC REFL B was about 160 mm away from M18.

I measured the distance of LSC REFL A to the front surface of M18 to be 128 mm. Then, I set LSC REFL B off to the side, and placed the profiler about 128 mm away from M18 on reflection of the splitter. We measured the beam profile, and then I re-placed LSC REFL B, this time at a distance of 128 mm to M18.

elenna.capote@LIGO.ORG - 12:26, Monday 05 May 2025 (84256)

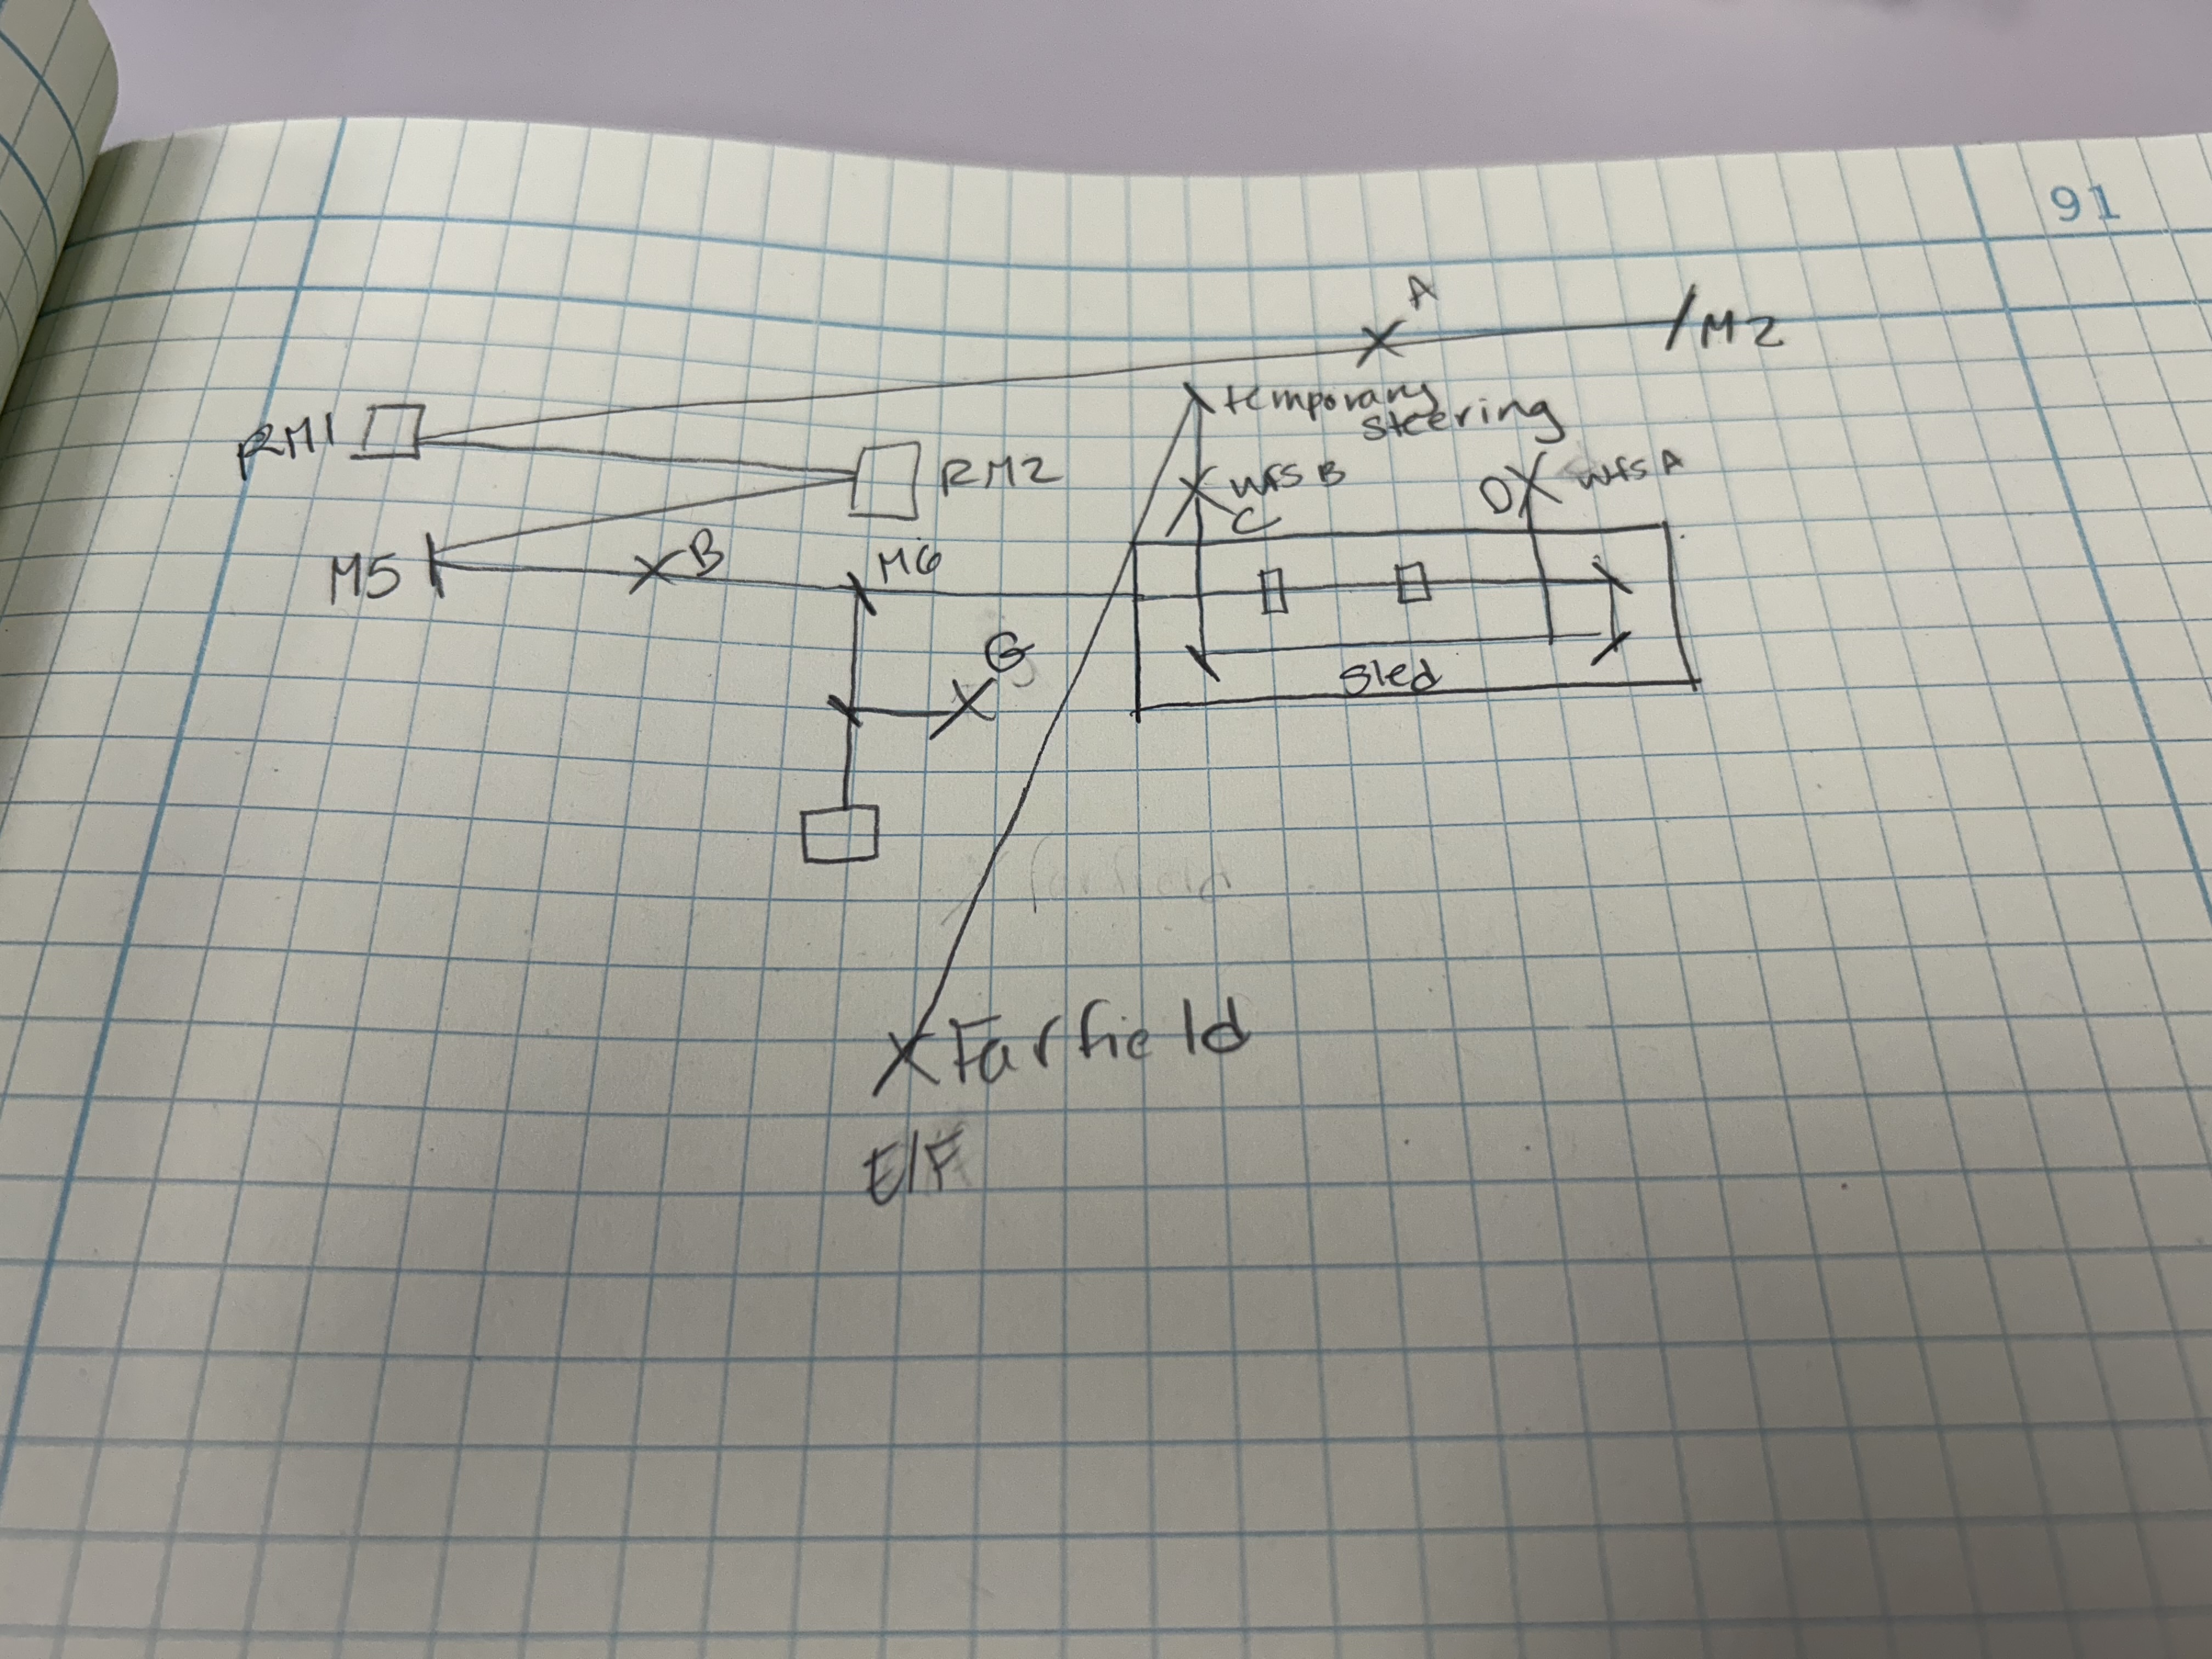
I have attached a very rough drawing of the REFL path and the locations where we made beam profile measurements. Each X on this drawing marks a beam profile measurement location. I also marked the Xs with letters A-G.

The measurements Keita reports above correspond the measurements C, D, E and F on this drawing. The difference between E and F, which is not depicted in my drawing, is a different placement of the temporary steering mirror relative to the sled.

 We still need to report details on the measurements for locations A, B, and G.

Images attached to this comment
keita.kawabe@LIGO.ORG - 15:31, Monday 05 May 2025 (84257)

Beam size upstream of the WFS sled

Unfortunately this is preliminary.

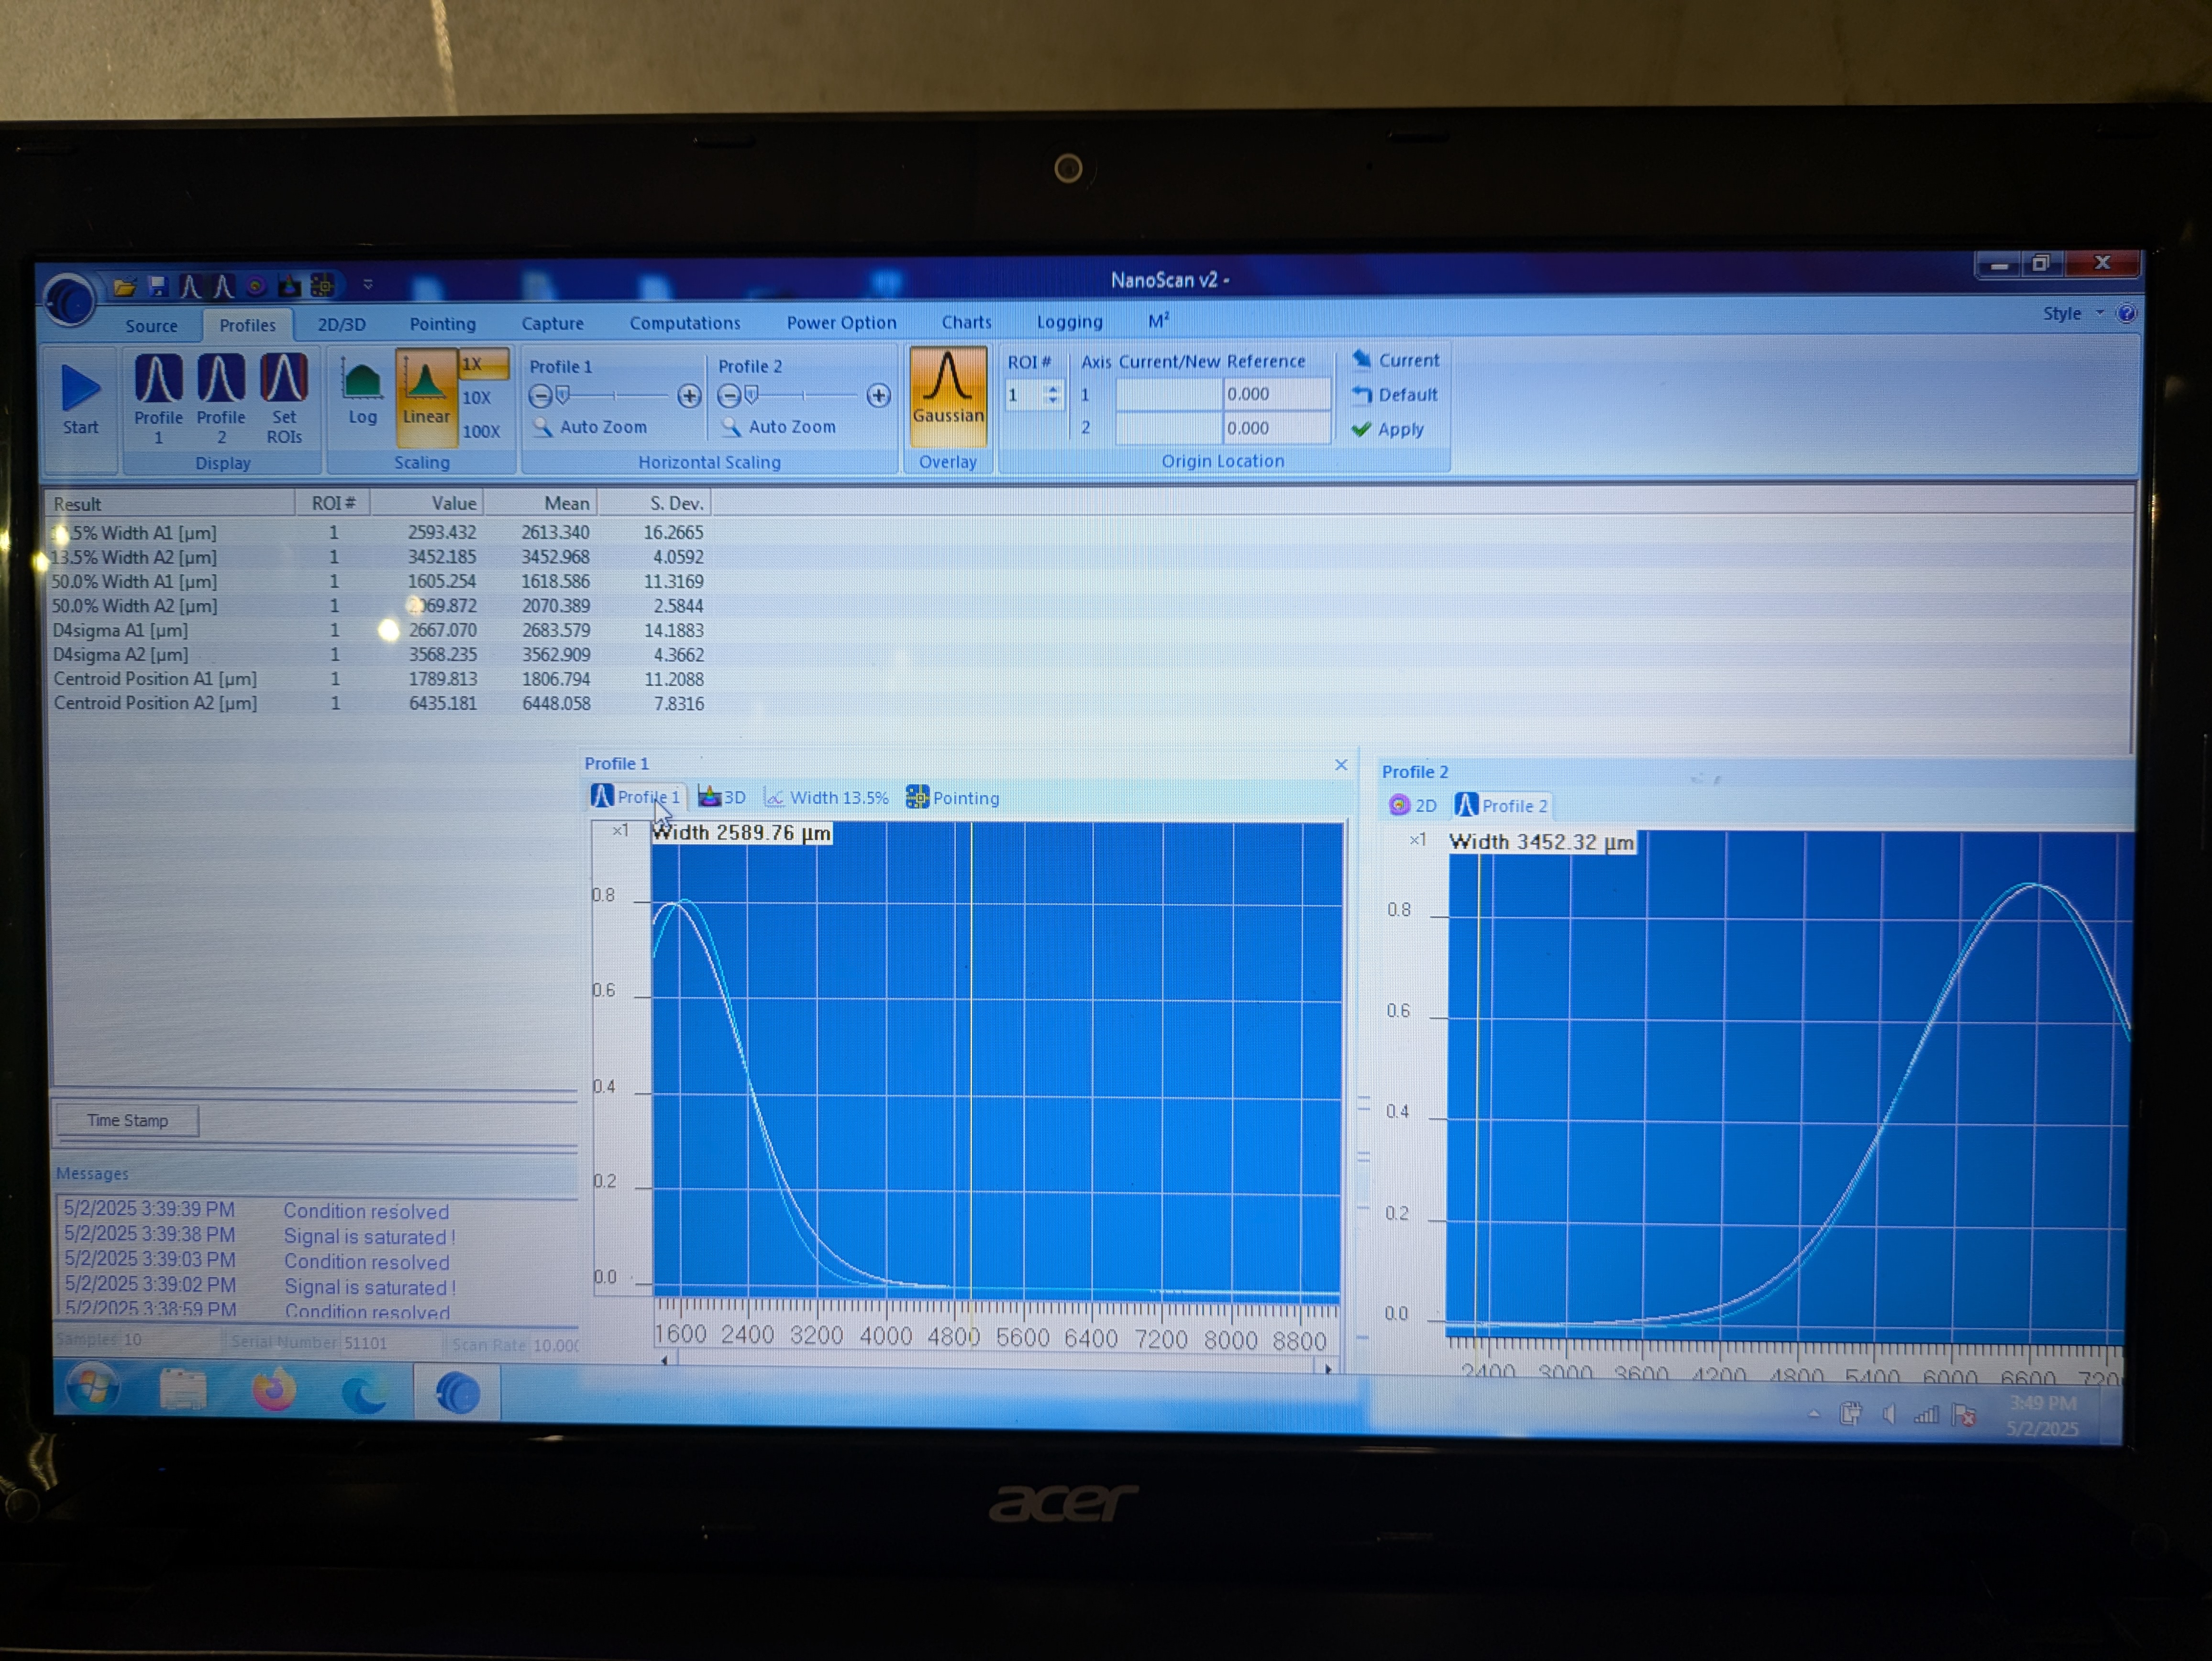
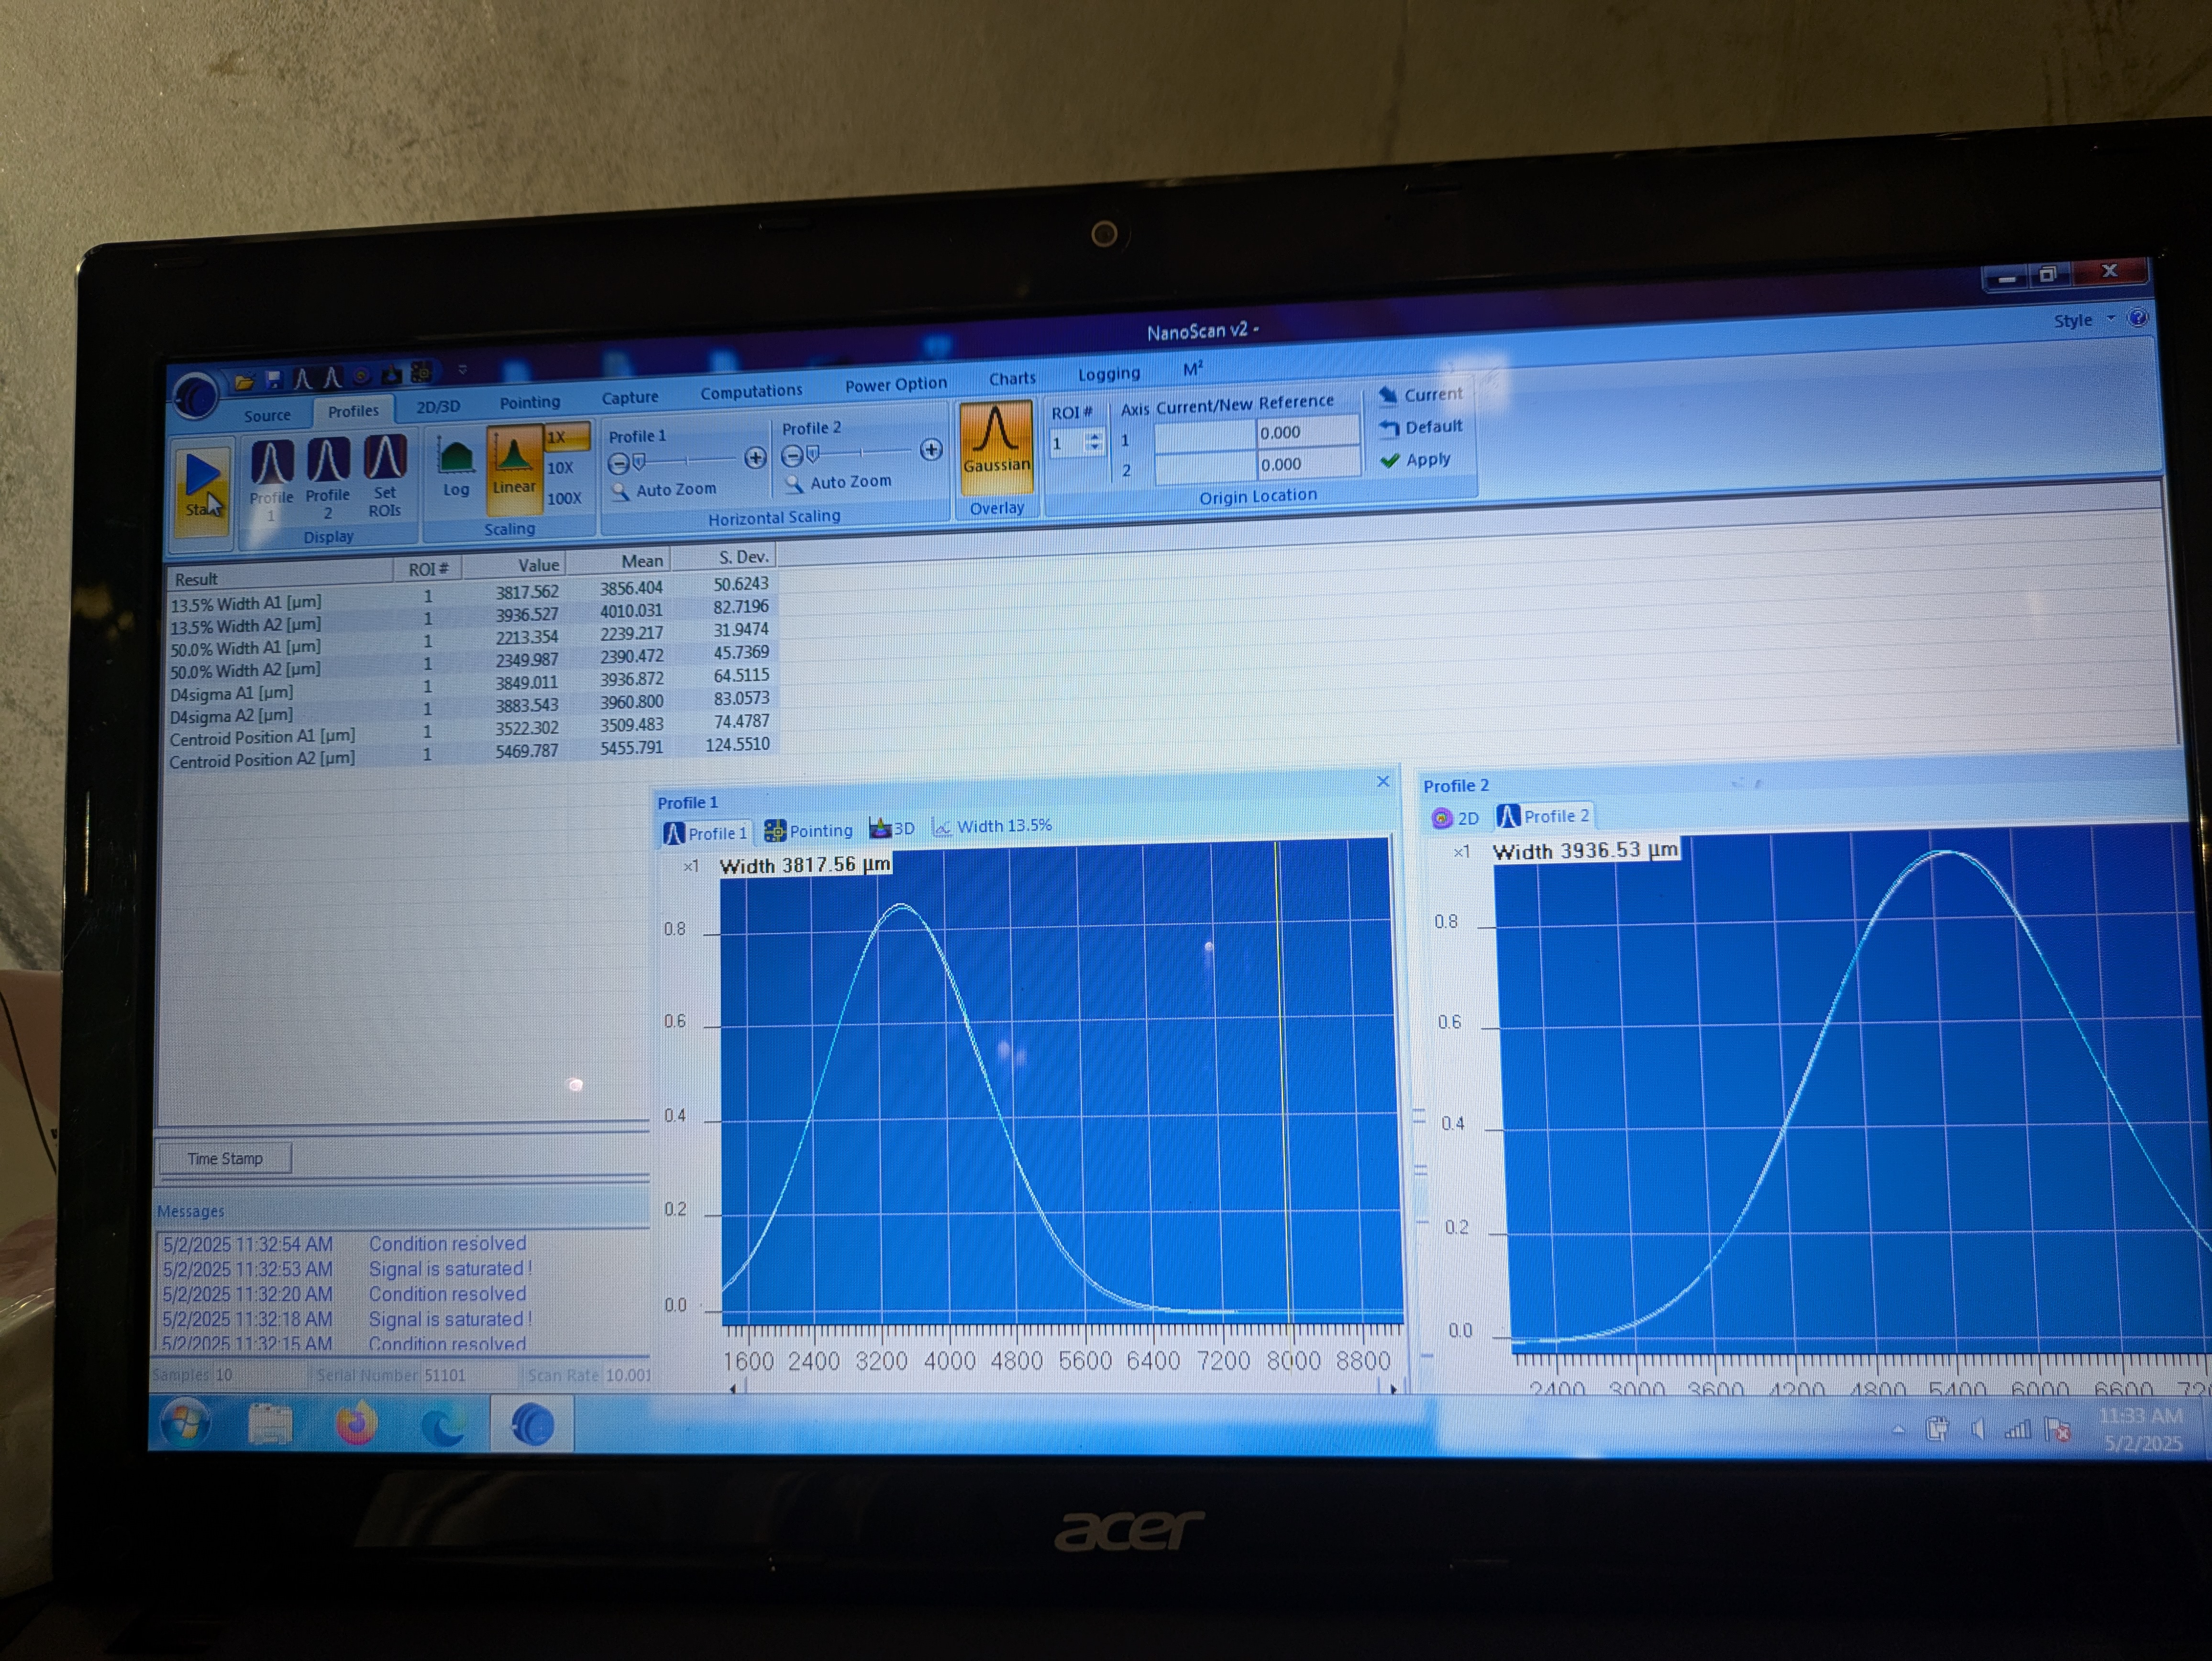
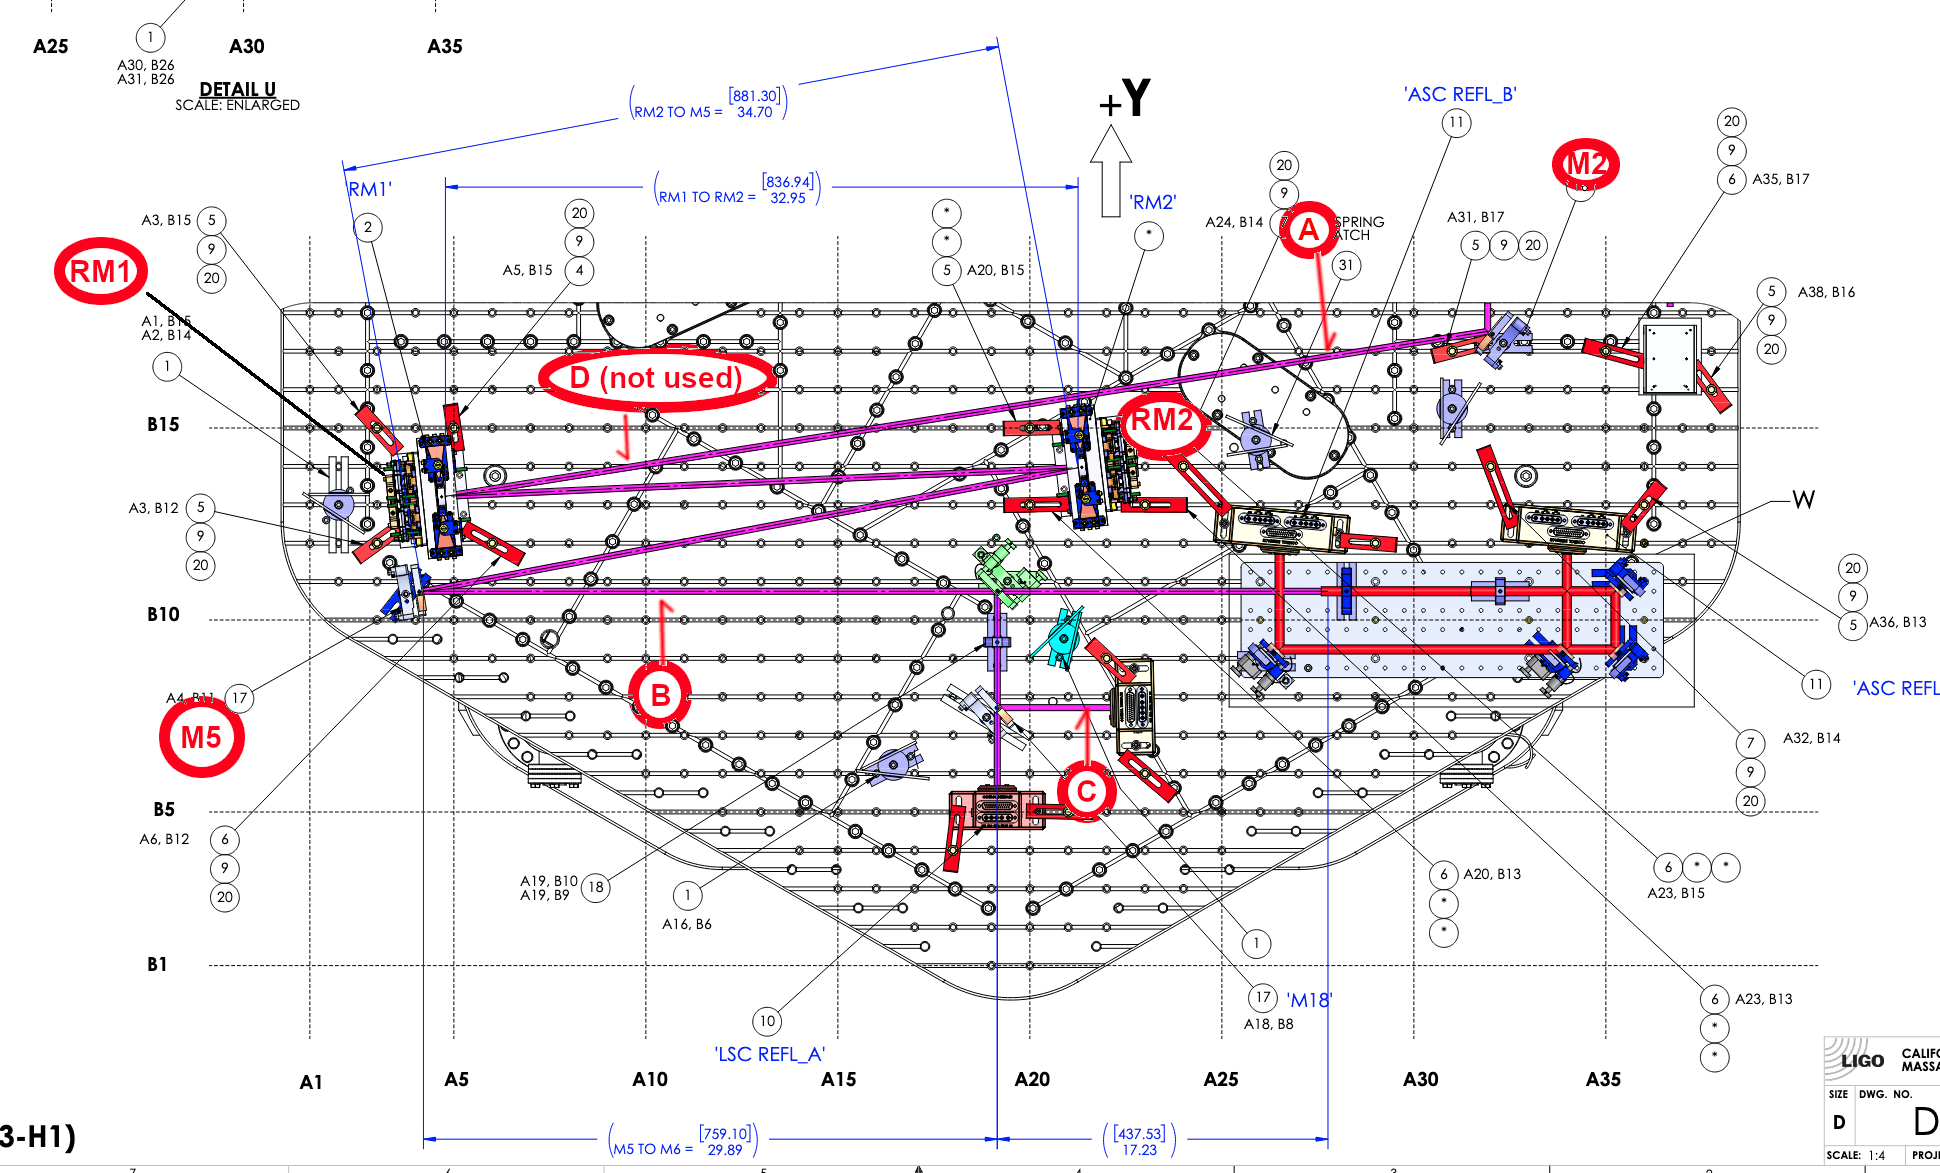
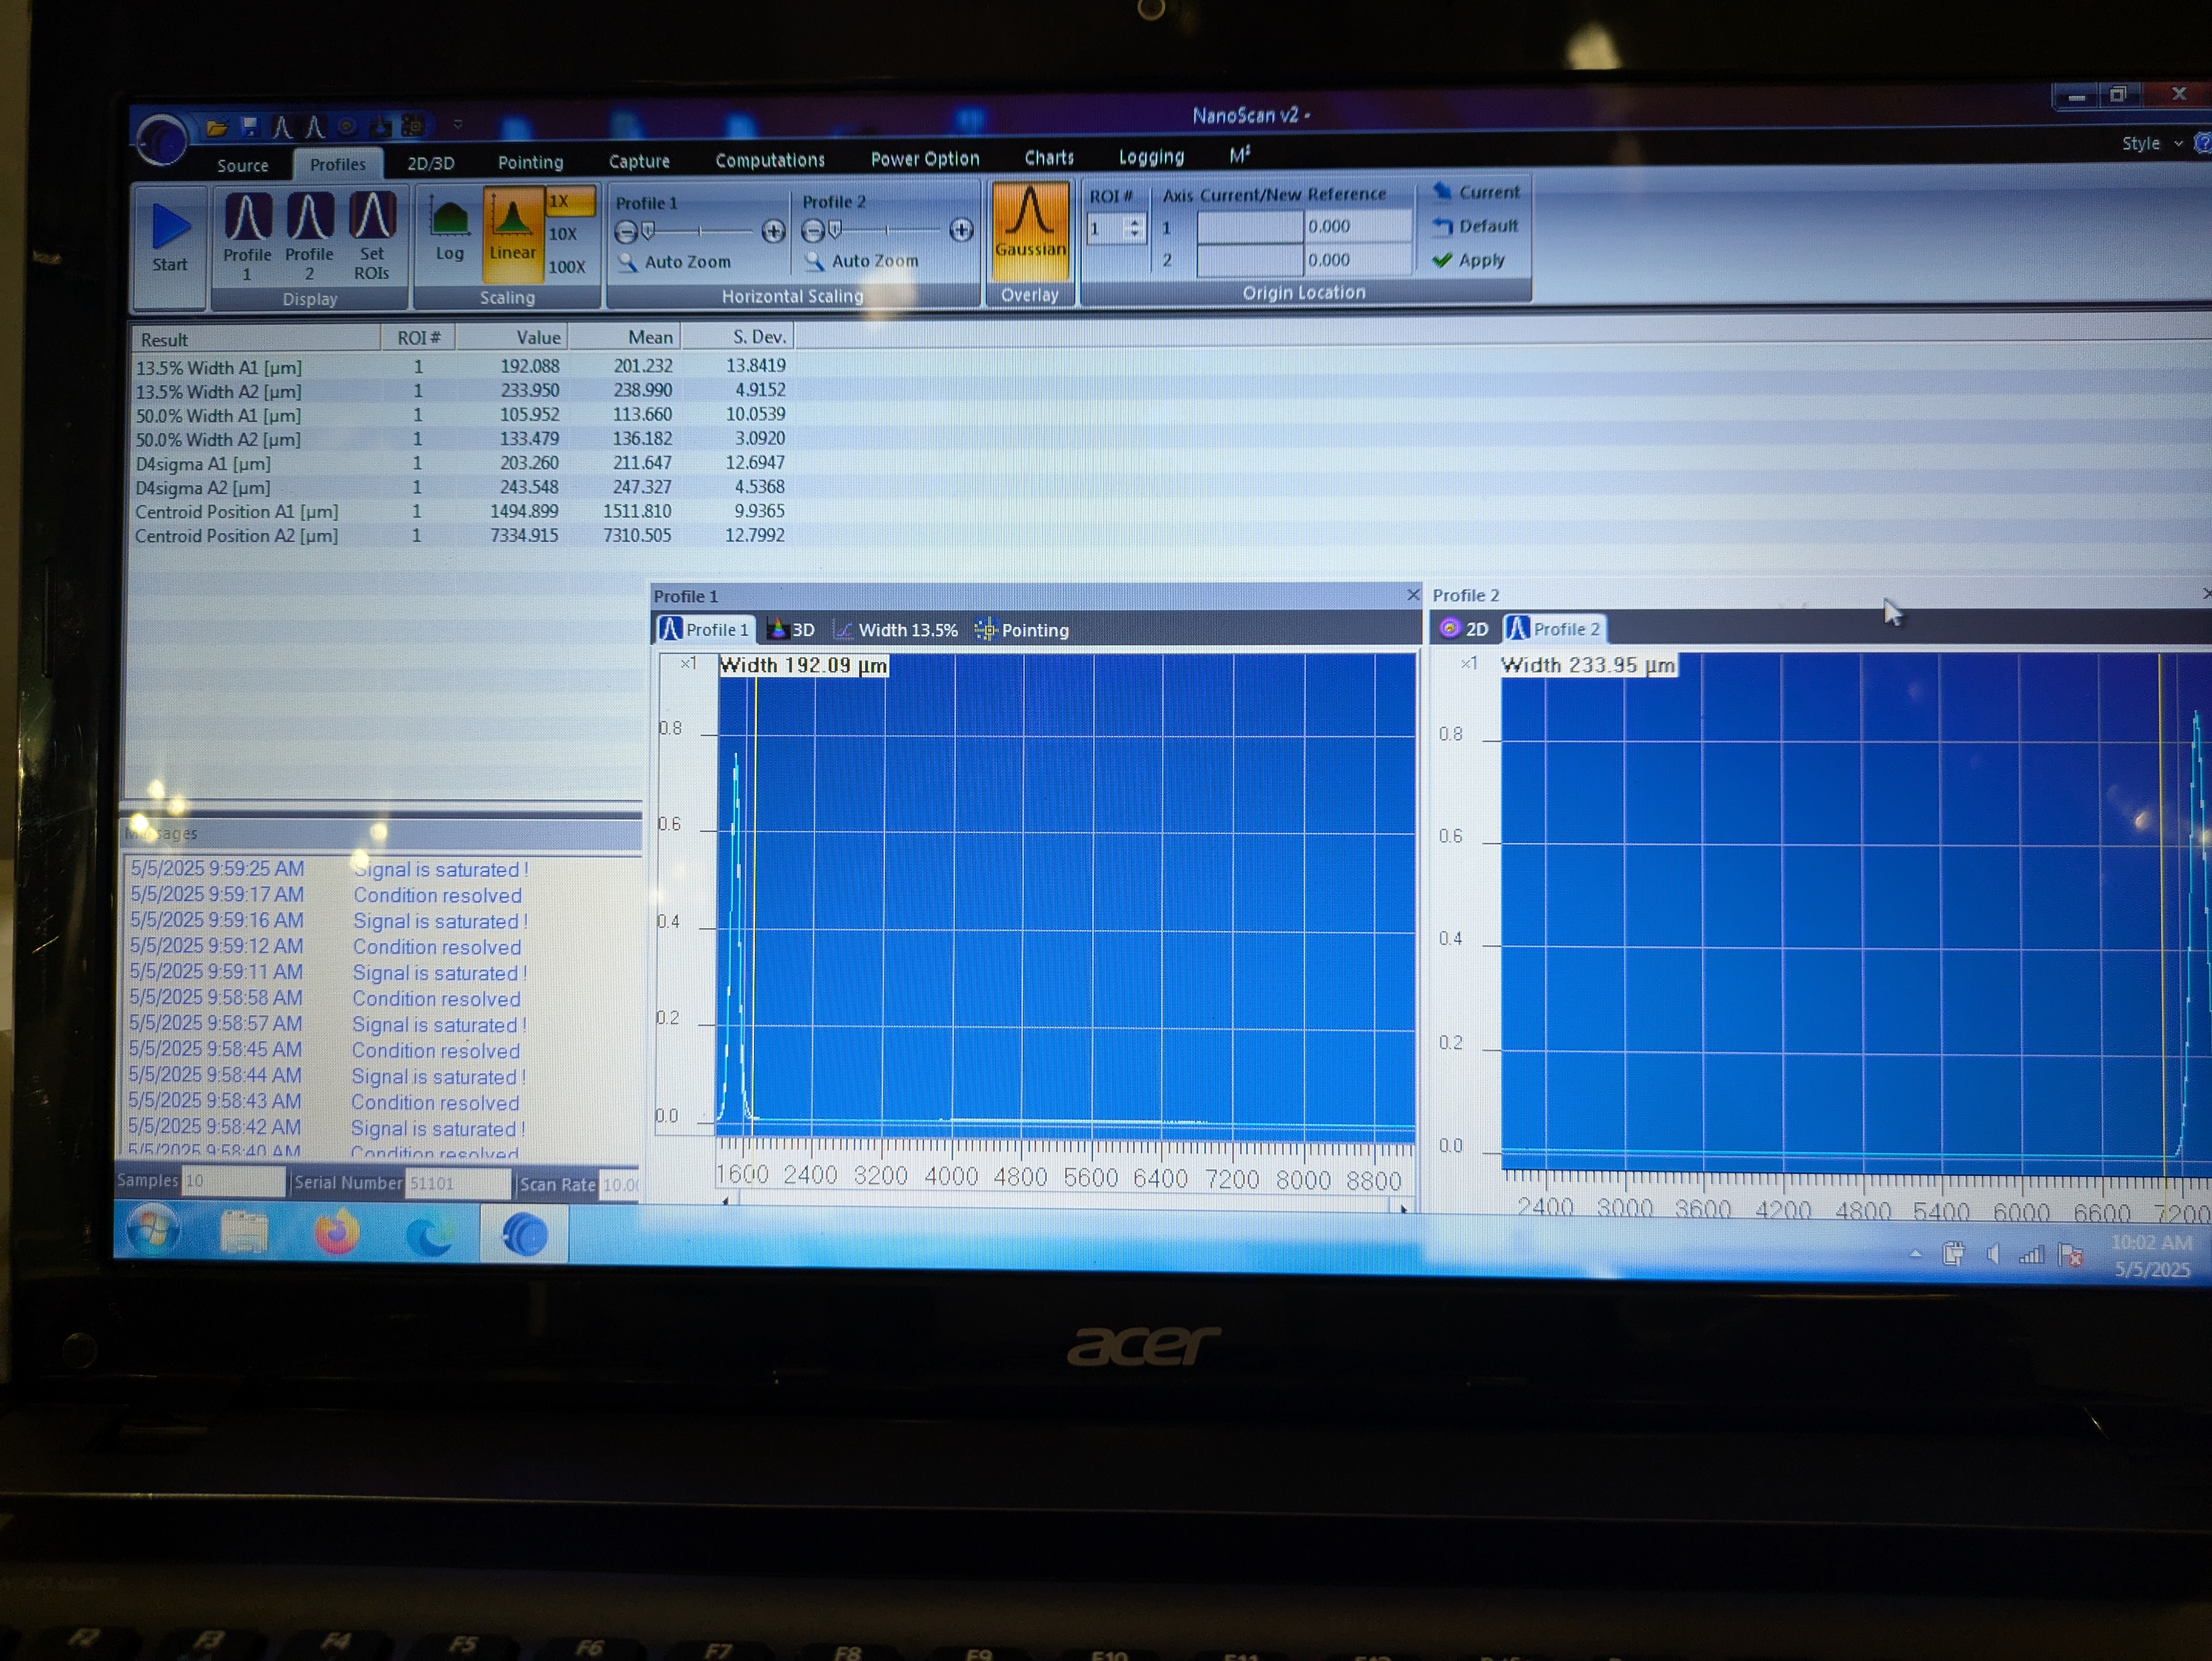
We measured the beam size at 4 different location upstream of the WFS sled marked as A, B, C and D. D data cannot be used as there's no data/picture of D locaiton but that's fine as far as position A data is good. Unfortunately, though, the position A horizontal width looks narrower than it really is (2nd attachment). The beam might be clipping in the nanoscan aperture or there might be a ghost beam or bright background light in the Region Of Interest (ROI), or ROI is defined poorly, effectively clipping the beam. Must remeasure.

LSC REFL_B (and therefore REFL_A) beam radius is ~0.1mm, which is tinier than my preference, the diode is 3mm (in diameter) so the beam could be larger.  The diodes are placed close to the focus of the lens upstream (number 18 in a circle in the first attachment) so the beam won't move when the beam position moves on that lens. Moving away from that position will be fine as far as the deviation is much smaller than the focal length (~200mm). Rayleigh range is like 3cm or maybe smaller (0.1mm waist -> RR=10*pi mm),  it should be easy to double the beam size by moving the sensors away from the lens by a couple inches. We'll do this after POP alignment.

Location Distance from the closest component wx [um] std(wx) [um] wy [um] std(wy) [um]
A

225mm downstream of M2, hard to measure the position accurately.

Nanoscan wx*2 number looks narrower than it really is. Must remeasure.

2683.6/2
14.2/2
3562.9/2 4.4/2
B 303mm downstream of M5. 3936.9/2 64.5/2 3960.8/2 83.1/2
C

128mm downstream of the last 50:50 for LSC REFL_A/B. LSC-REFL_B location (tentative).

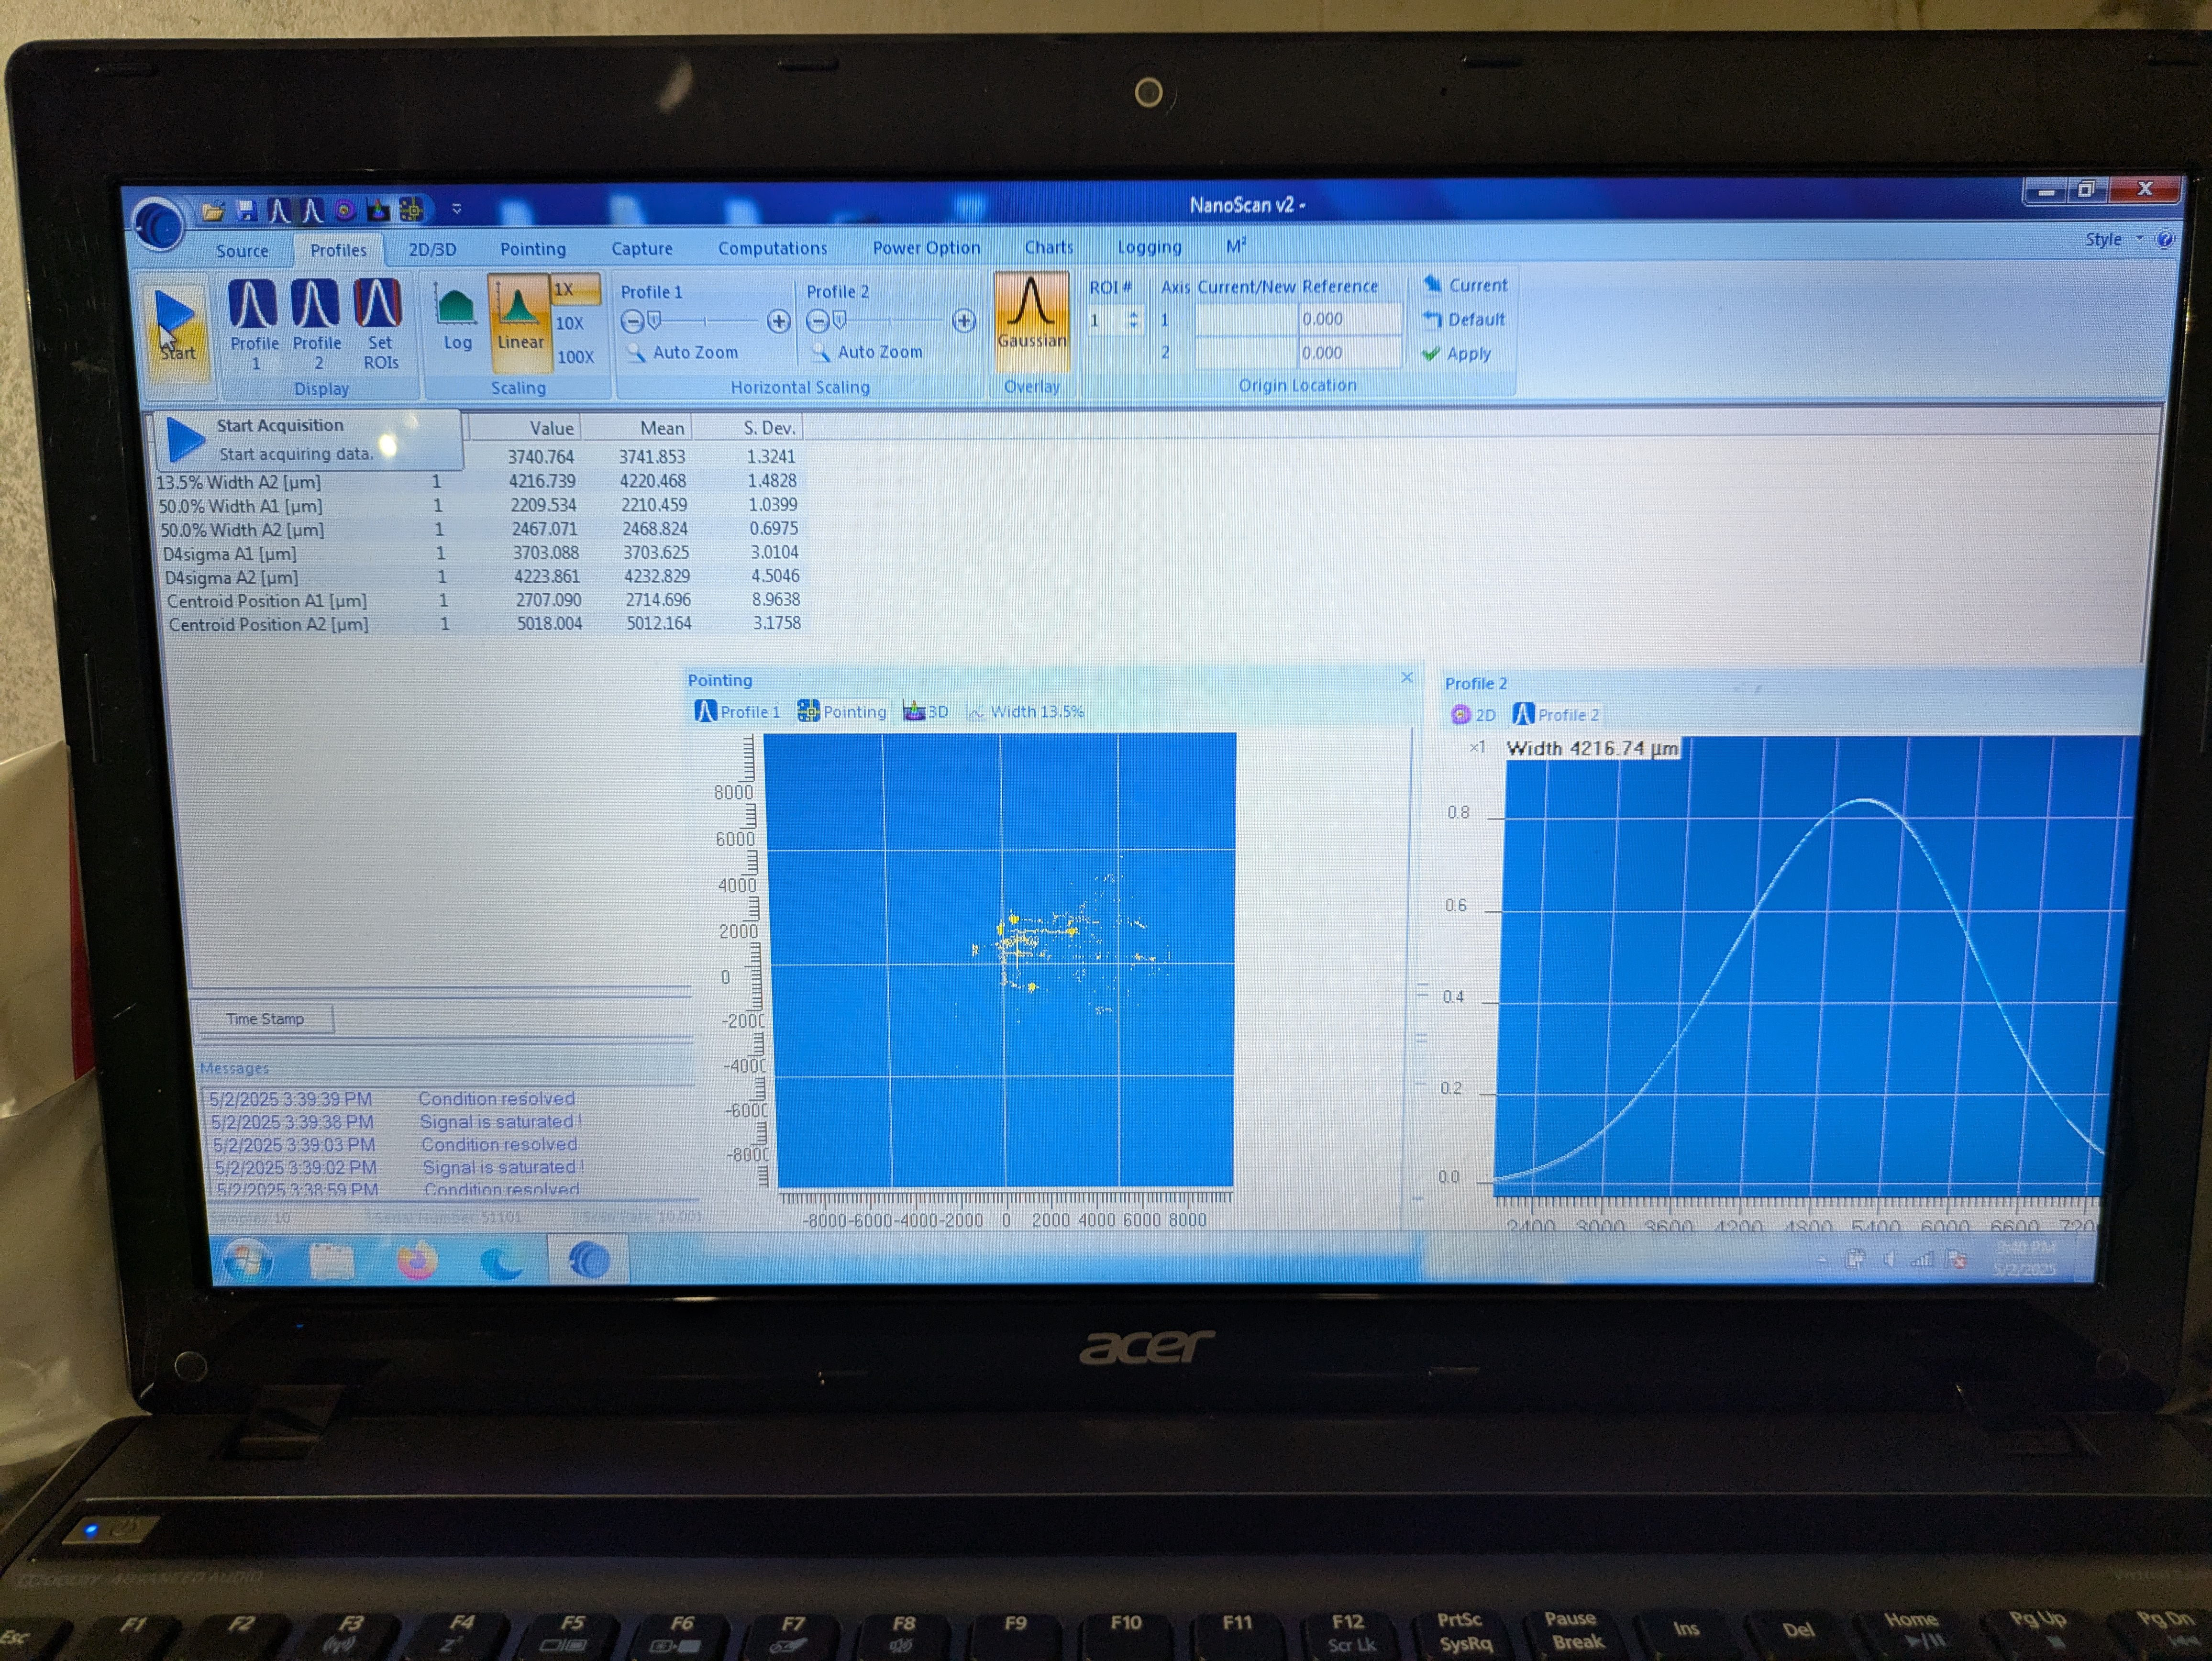
211.6/2 12.7/2 247.3/2 4.5/2
D Exact position unknown, between RM1 and M2, less than 1400 downstream of M2. Beam size numbers look good. 3703.6/2 3.0/2 4332.8/2 4.5/2

After everything is done we'll make a good measurement of distances between everything by either using a long/short ruler (preferred) or counting bolt holes or both.

Images attached to this comment
camilla.compton@LIGO.ORG - 09:04, Tuesday 06 May 2025 (84263)

Yesterday Betsy and I measured the distances between these optics:

  • 856mm from RM1 to RM2, measured 827mm between the front D1000767 plate structure of each SUS and Don and Rahul measured on D1001396 the horizontal distance between plate and optic is 14.3mm for each RM1 and RM2.
  • 895mm from RM2 to M5: Front of RM2 mirror to HR of M5 mirror
  • 758mm from M5 to M6 (BS): HR of M5 mirror to front HR of M6 BS (-X side of M6)
  • 468mm from M6 (BS) to 2" Lens on SLED: front HR of M6 BS (-X side of M6) to front side of 2" lens (0.5" thick lens holder, from siskiyou FOH 2", so add 0.25" if you want center of lens).
elenna.capote@LIGO.ORG - 17:24, Tuesday 06 May 2025 (84266)

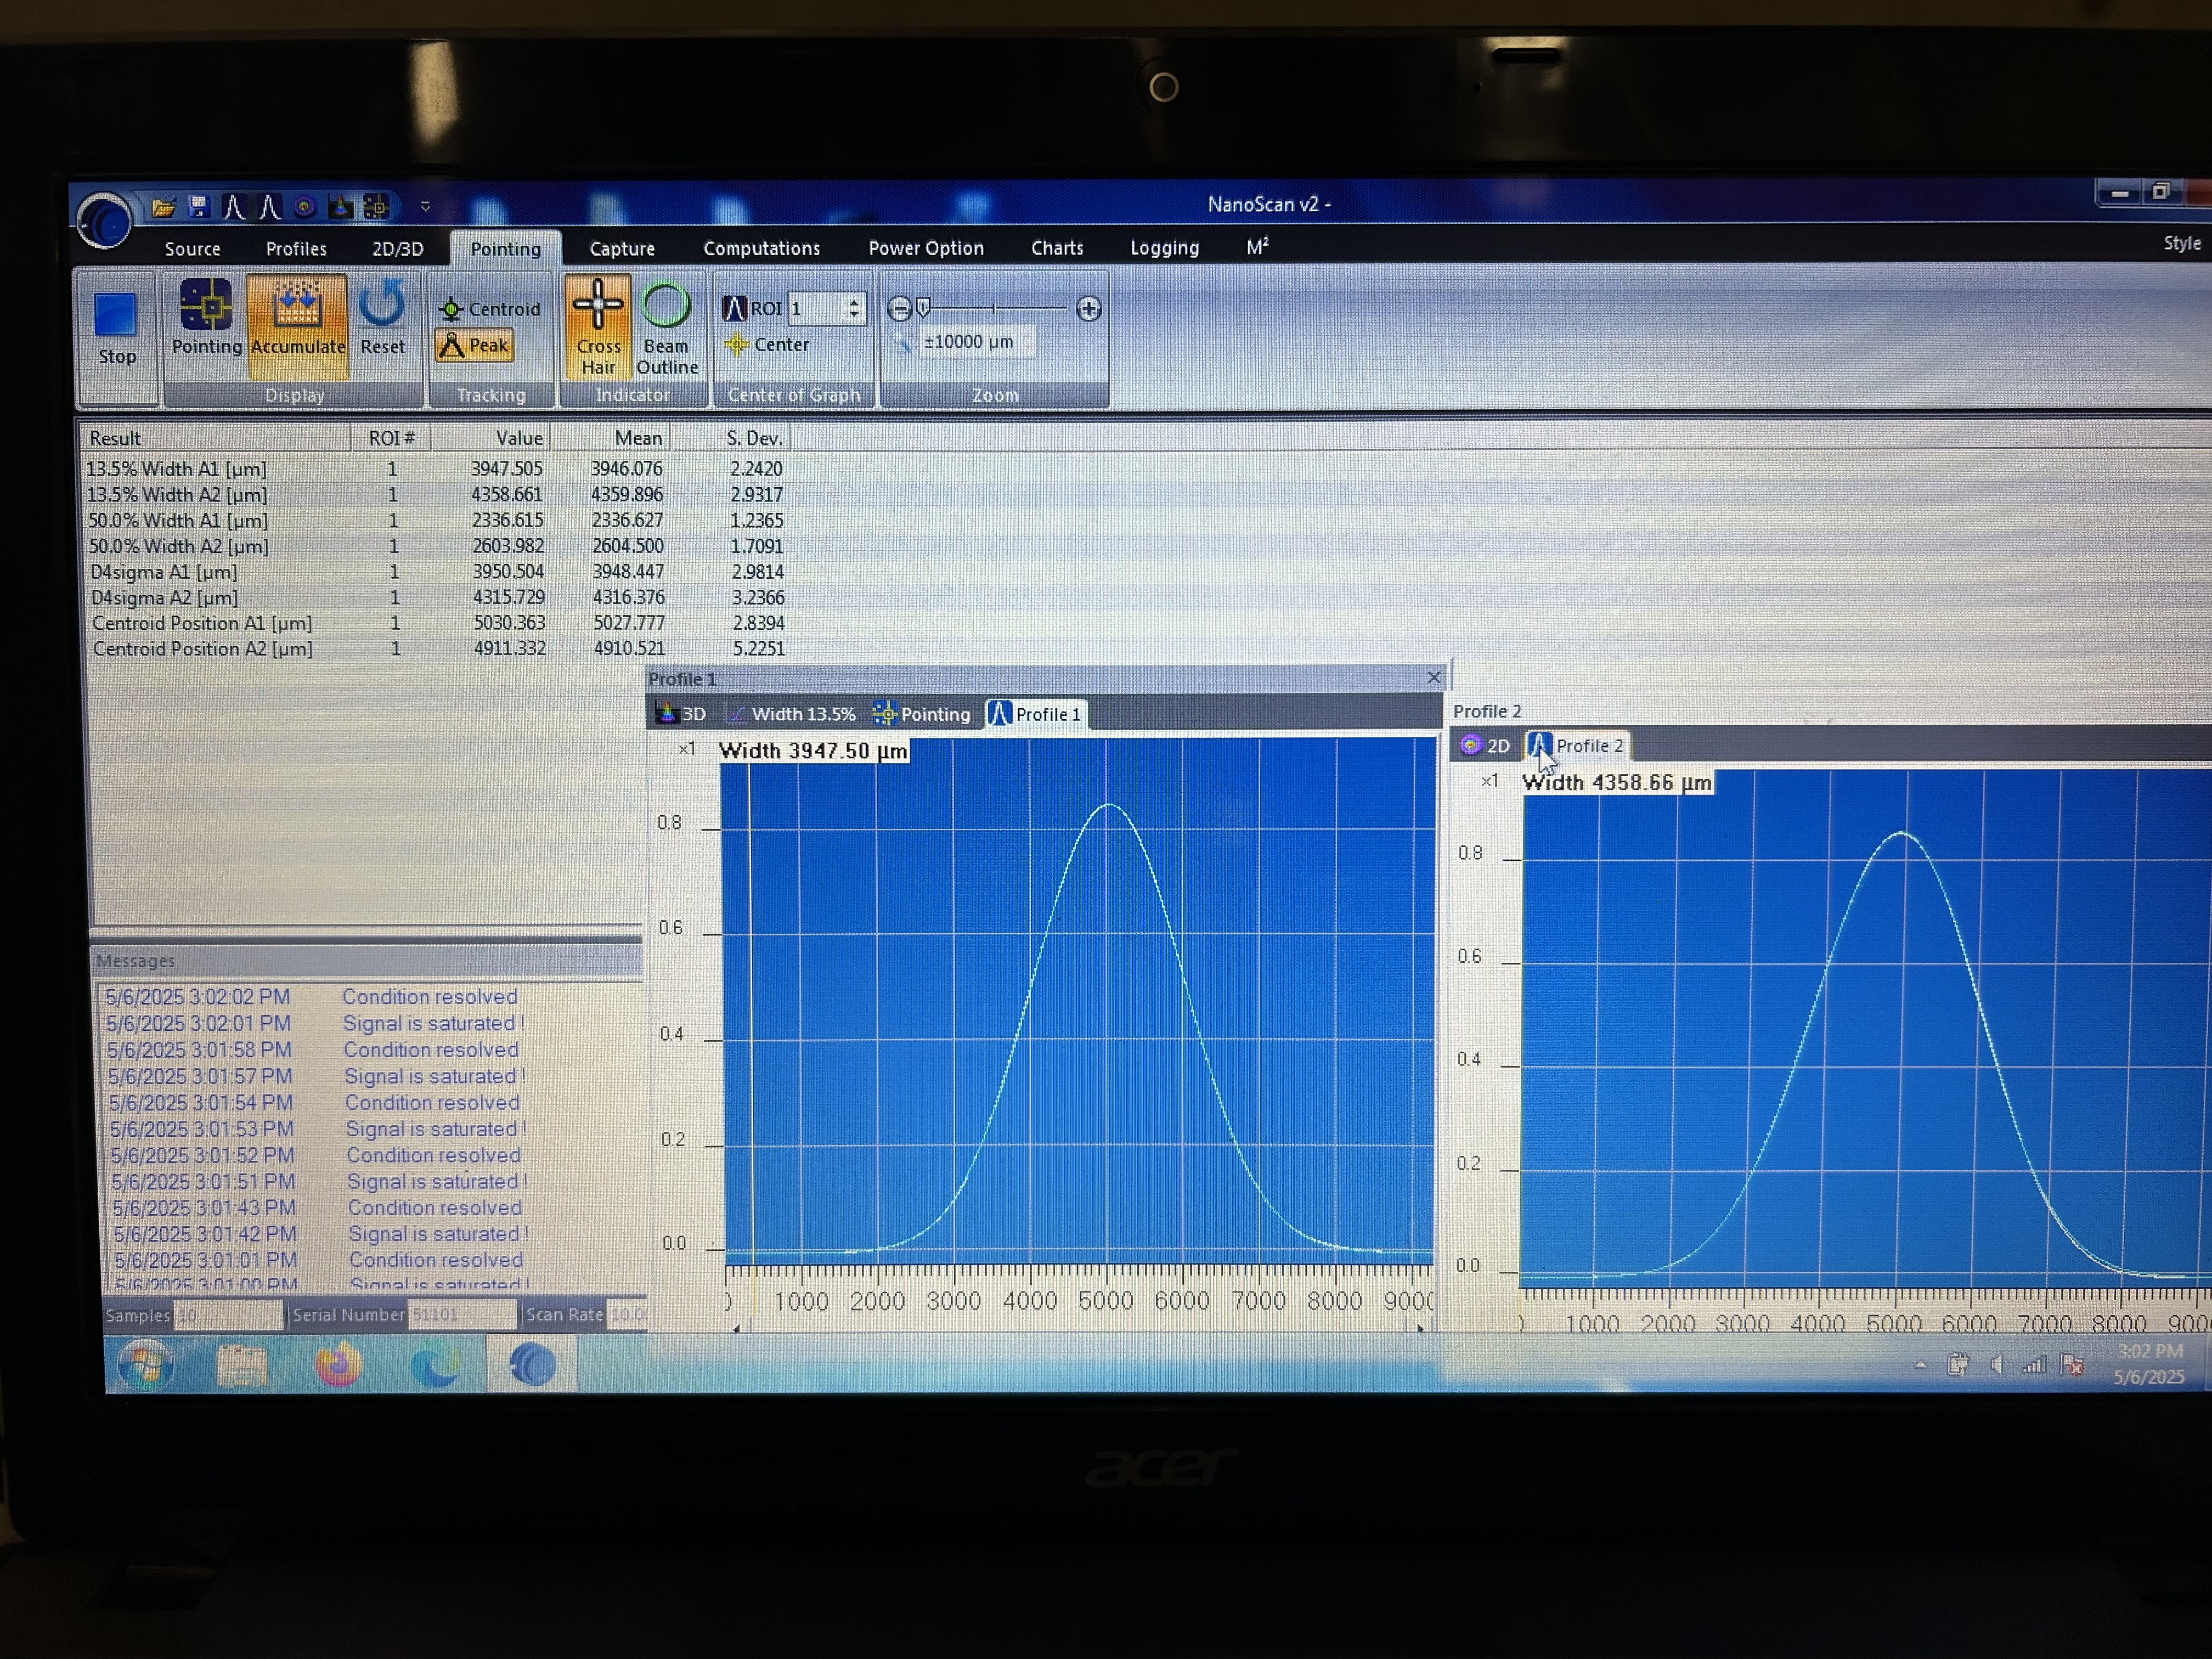
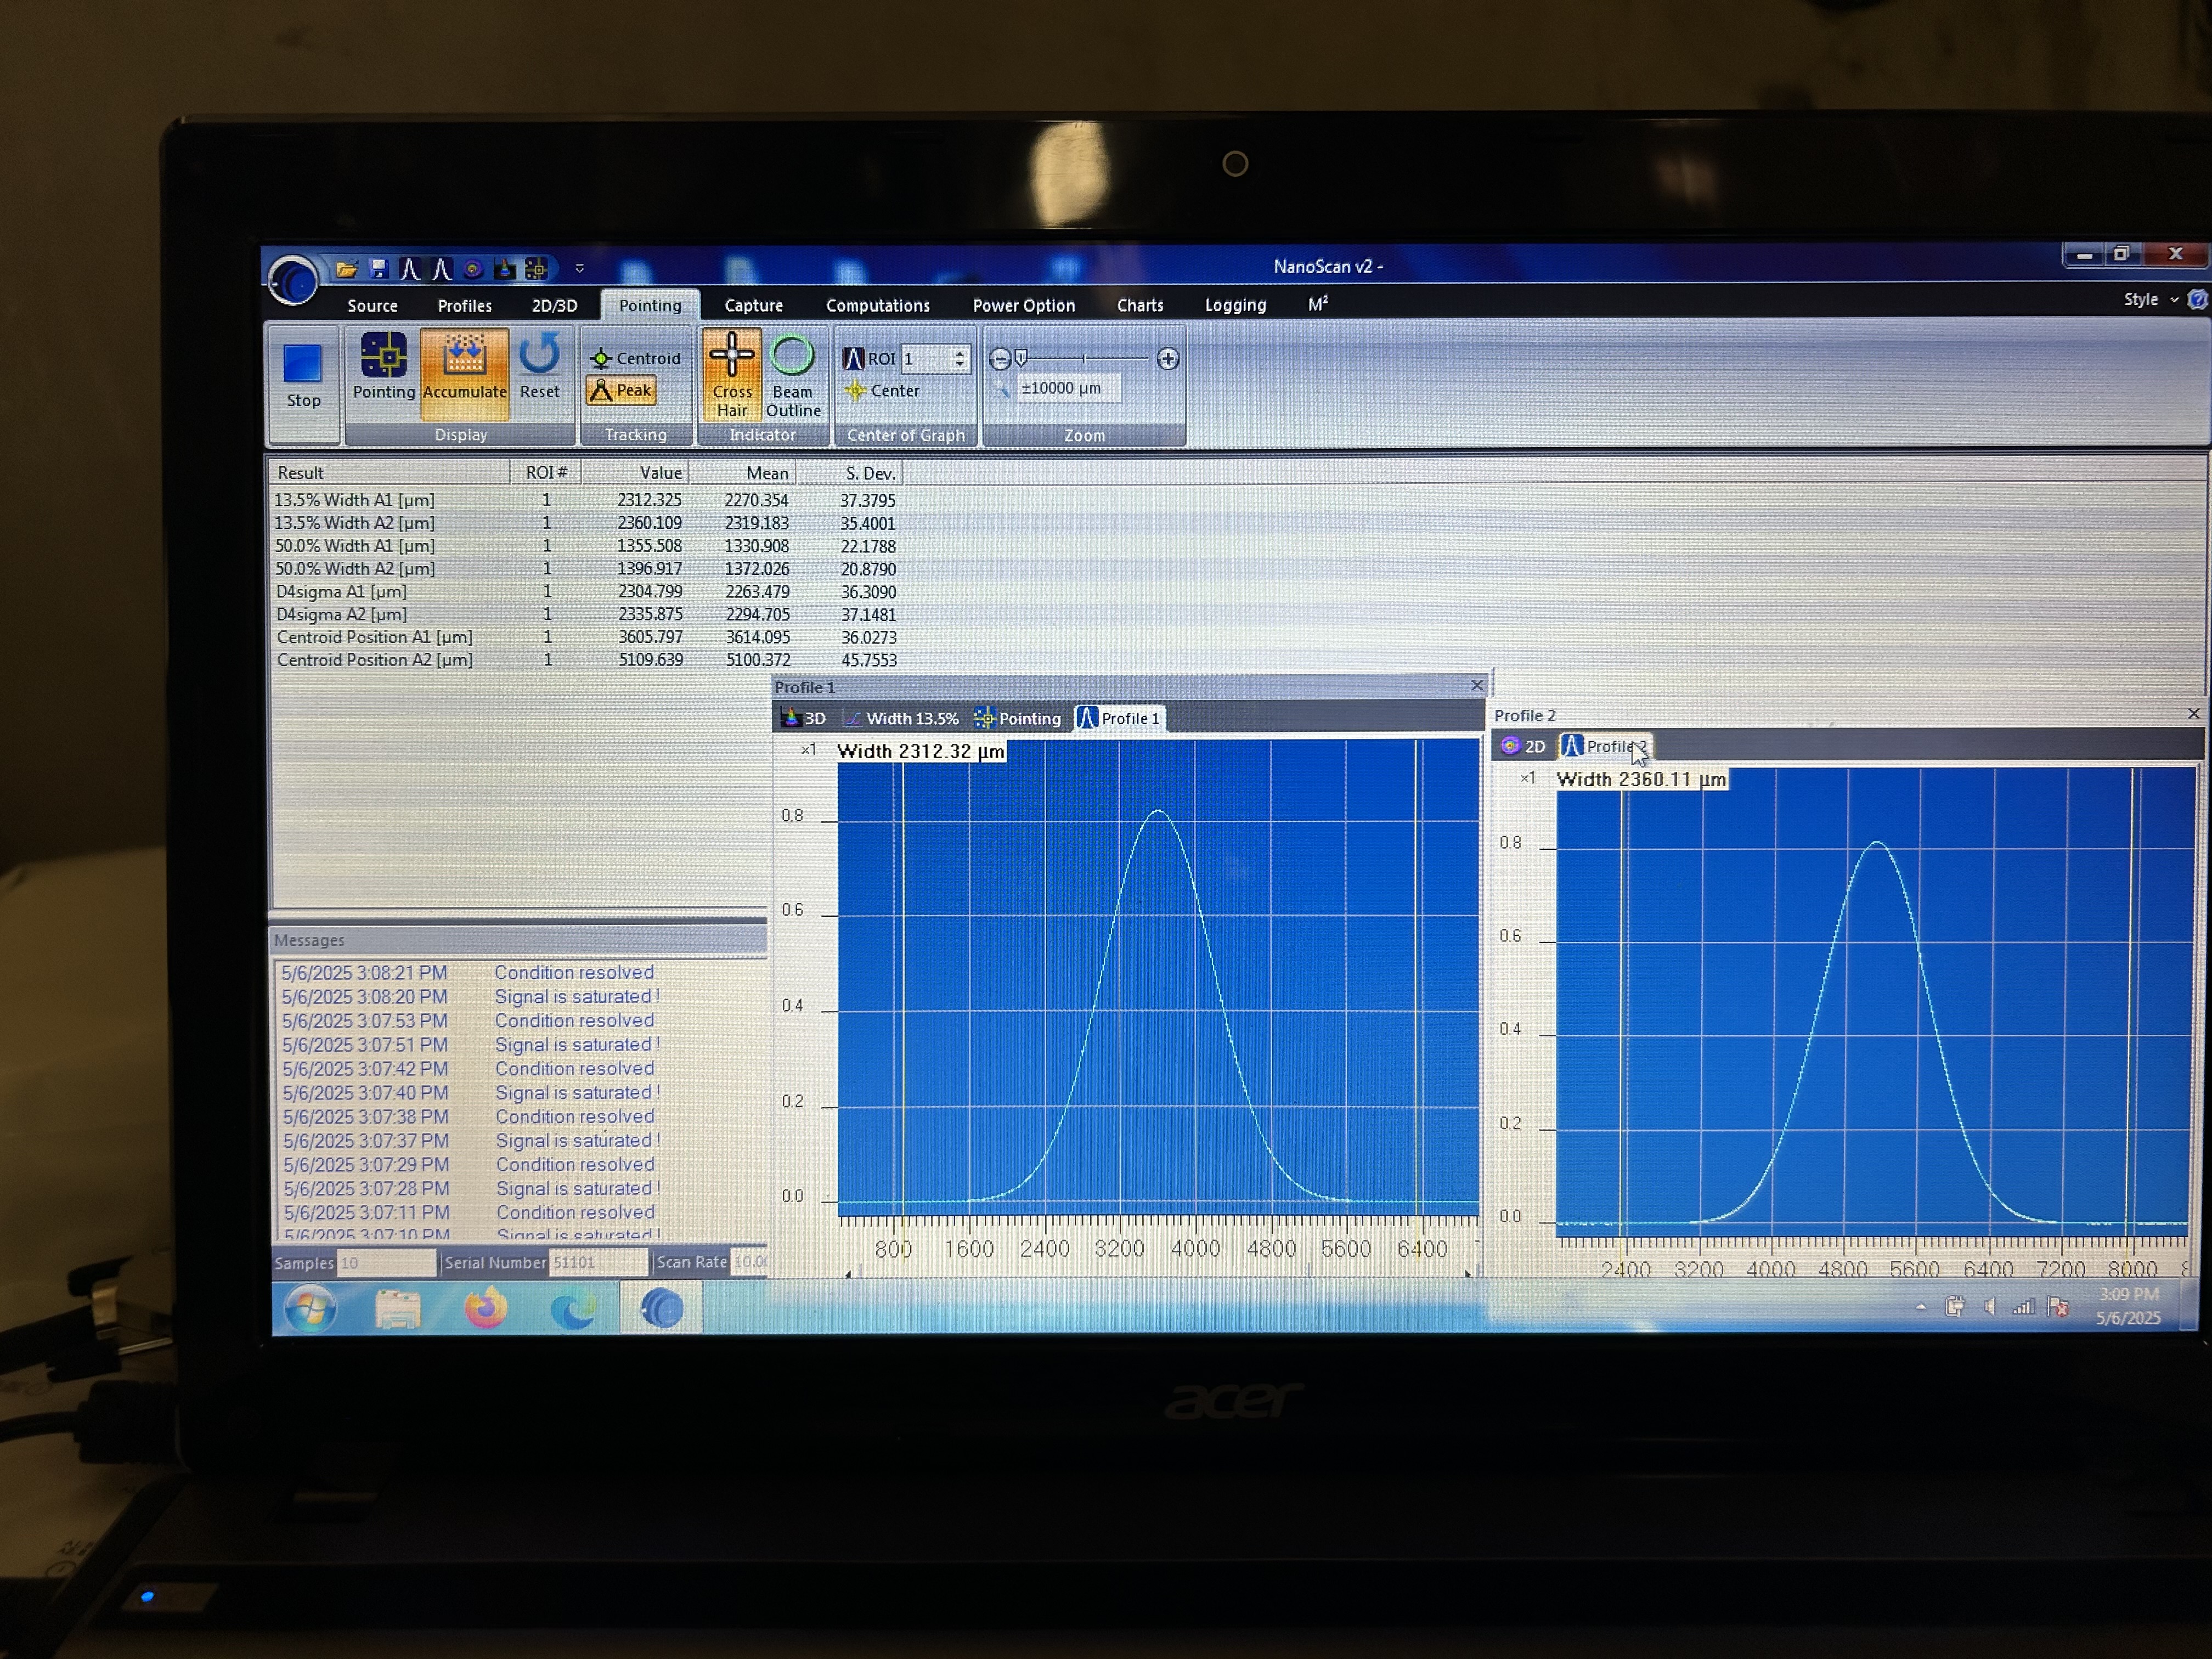
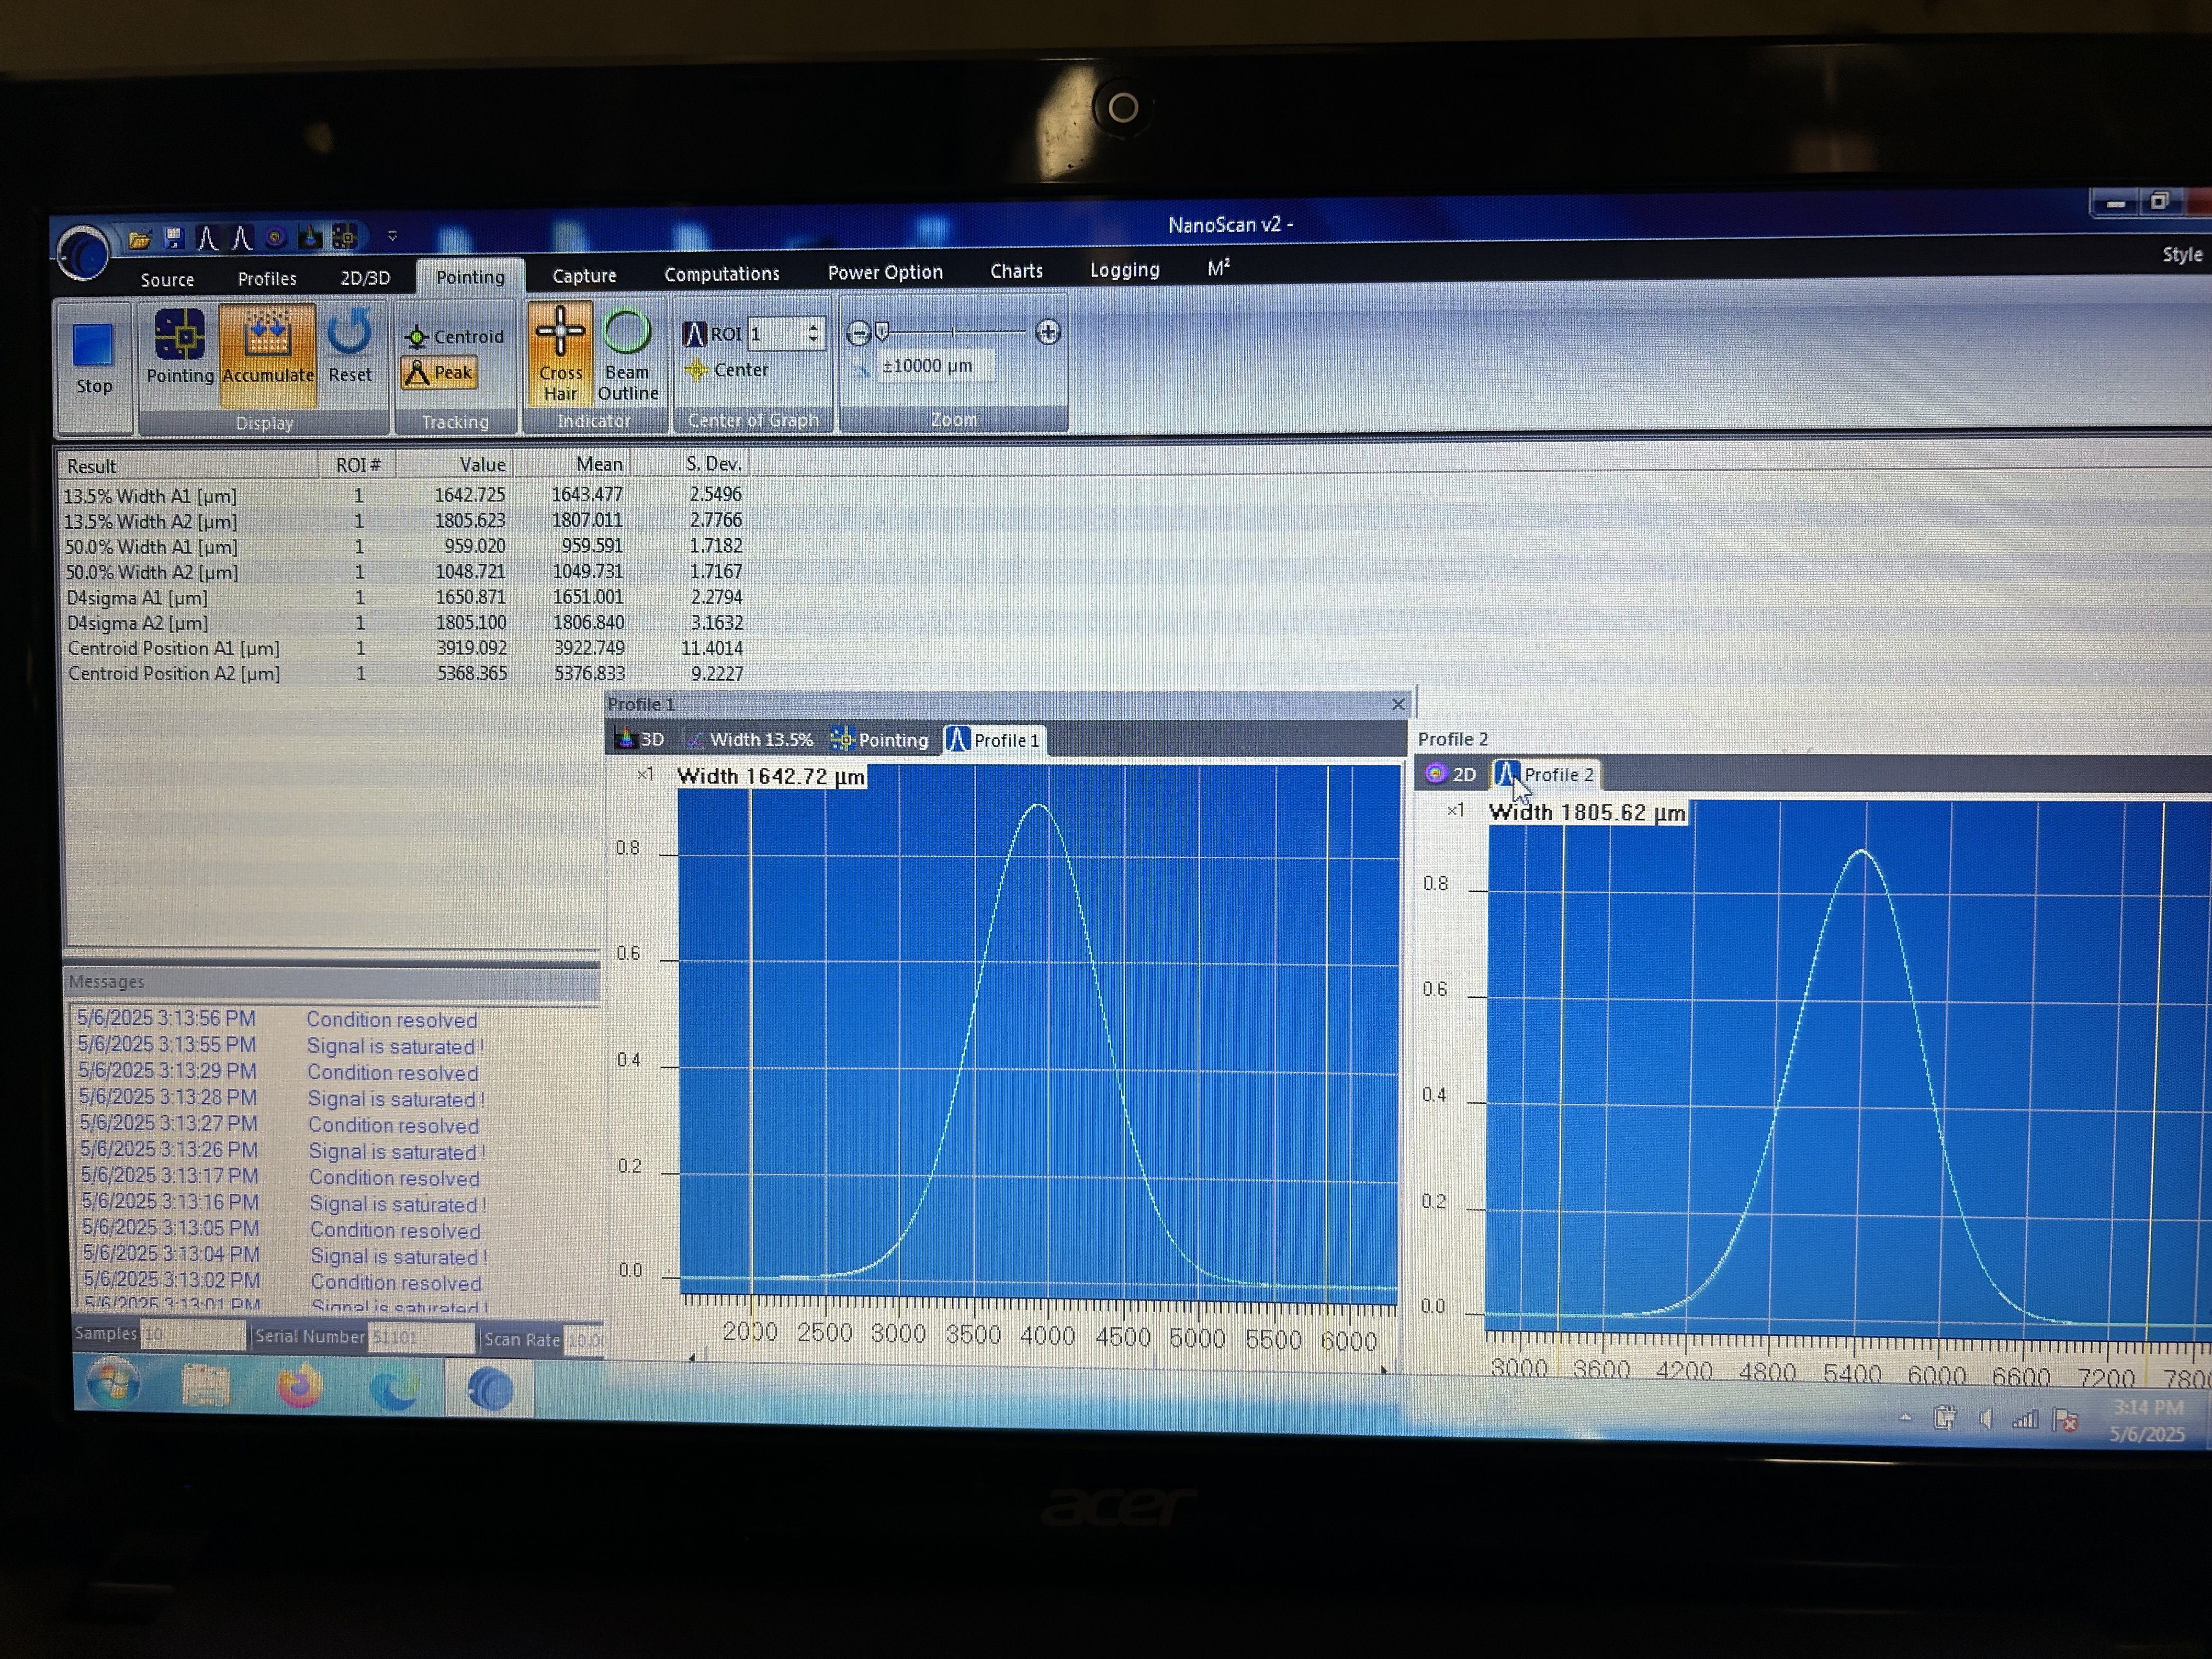
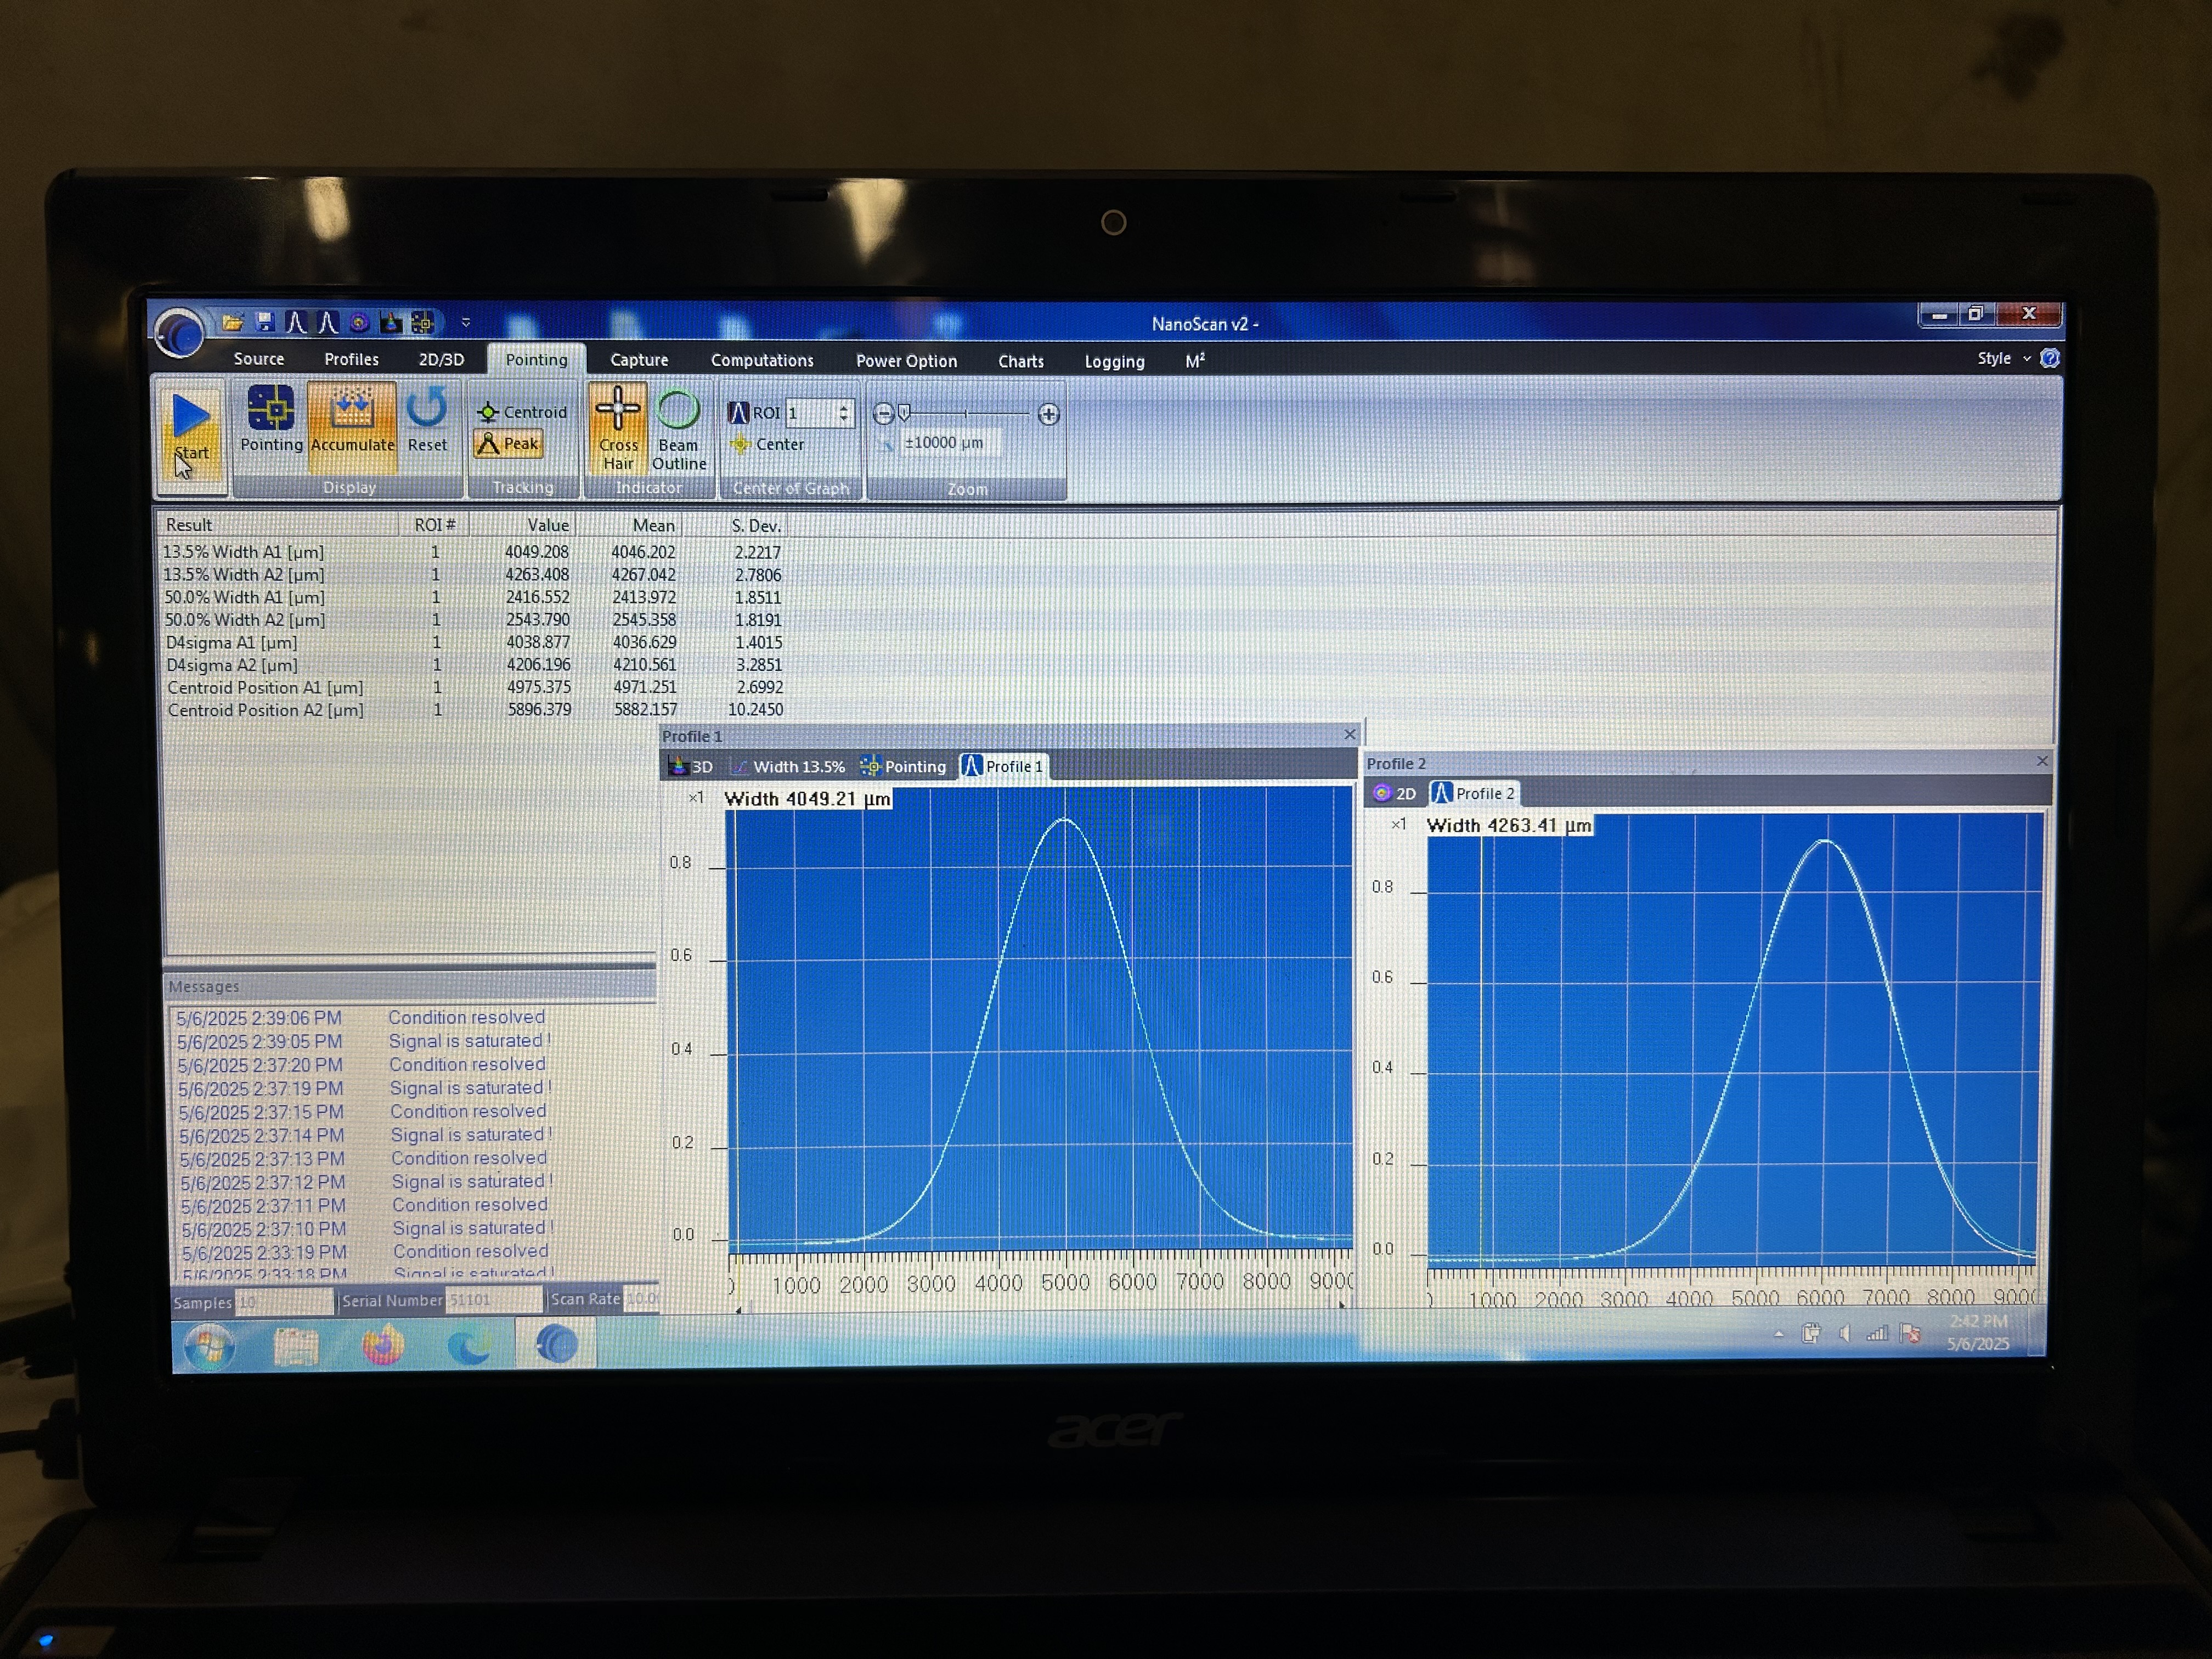
Camilla and I went back out today to redo the measurements at the locations labeled "A" and "D" in Keita's diagram. This table reports the D4sigma values, like Keita's tables above.

We forgot that we had left ITMX aligned, so the original measurements in this alog are no good. Keita and I remeasured these again today (May 6) and I am updating the table below with the new data. We also got two more measurements in new locations that are not indicated in Keita's diagram.

Location Distance from closest component wx [um] std wx [um] wy [um] std wy [um]
A 238 mm (+- 3 mm) downstream of M2 (nanoscan image) 4038.9/2 1.4/2 4206.2/2 3.3/2
D 314 mm (+- 3 mm) upstream of RM1 (measured from nanoscan front to metal ring around the RM, the mirror surface may be set back from the ring by another 1mm or so, hard to tell) (nanoscan image) 3950.6/2 2.8/2 4315.0/2 2.6/2
New location, after RM2 374 mm upstream of M5 (nanoscan image) 2304.8/2 36.3/2 2335.9/2 37.1/2
New location, between RM1 and RM2 345 mm upstream of RM2 (measured from nanoscan front to metal ring around RM) (nanoscan image) 1650.9/2 2.3/2 1805.1/2 3.2/2

Leaving this older comment: It is difficult to measure these distances well with the ruler, so I would guesstimate error bars of a few mm on each distance measurement reported here.
Some new notes: when we reduce teh purge air flow, the measurements become much more stable and there is no need to "cherry pick" data as Keita discussed in earlier comments. Also, I think we have finally managed to tighten the screws on the nanoscan posts enough that it doesn't slide around anymore.
Images attached to this comment
H1 SUS (SEI, SUS)
edgard.bonilla@LIGO.ORG - posted 12:02, Tuesday 29 April 2025 - last comment - 14:56, Monday 05 May 2025(84171)
SR3 OSEM estimator update

Edgard, Oli.

Follow up to the work summarized in 84012 and 84041.

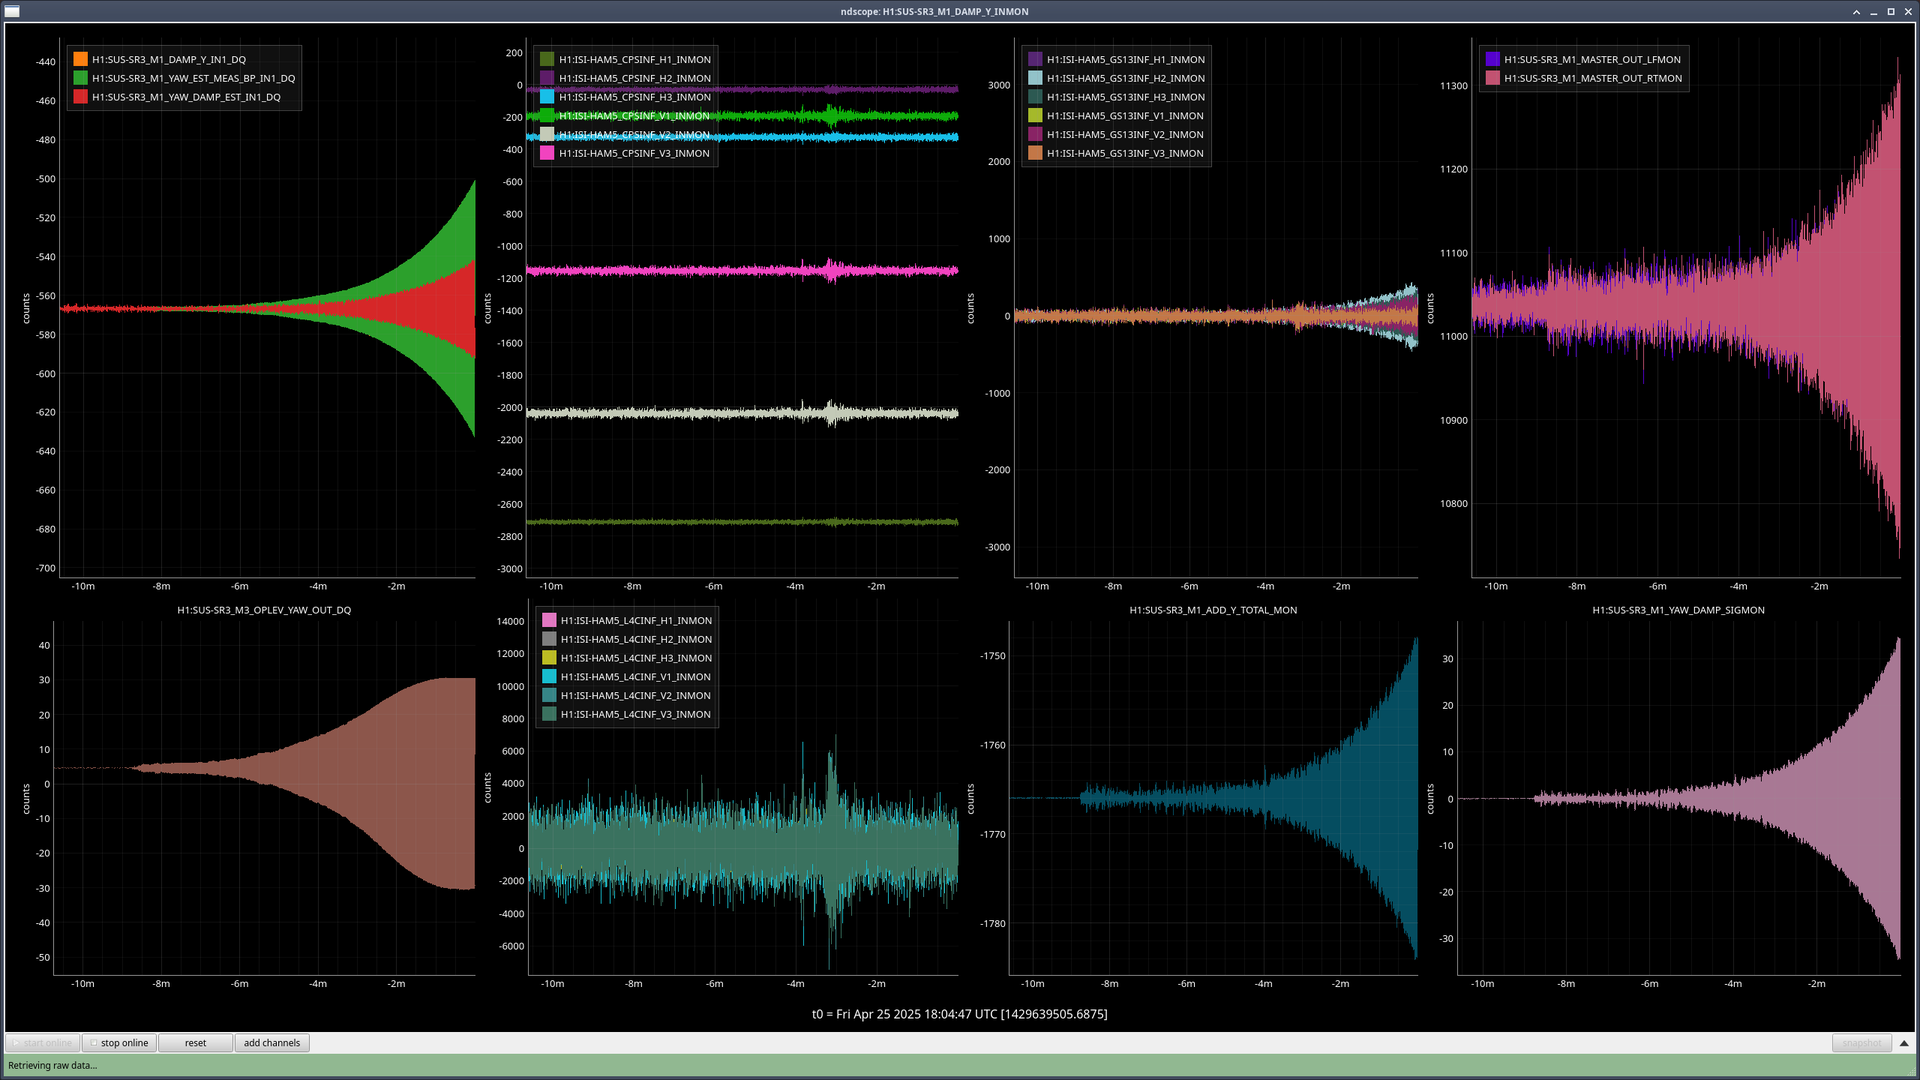
TL;DR: Oli tested the estimator on Friday and found the ISI state affects the stability of the scheme, plus a gain error in my fits from 84041. The two issues were corrected and the intended estimator drives look normal (promising, even) now. The official test will happen later, depending on HAM1 suspension work.

____

Oli tested the OSEM estimator damping on SR3 on Friday and immediately found two issues to debug:

1) [See first attachment] The ISI state for the first test that Oli ran was DAMPED. Since the estimator was created with the ISI in ISOLATED (and it is intended to be used in that state), the system went unstable. This issue is exacerbated by point 2) below. This means that we need to properly manage the interaction of the estimator with guardian and any watchdogs to ensure the estimator is never engaged if the ISI trips.
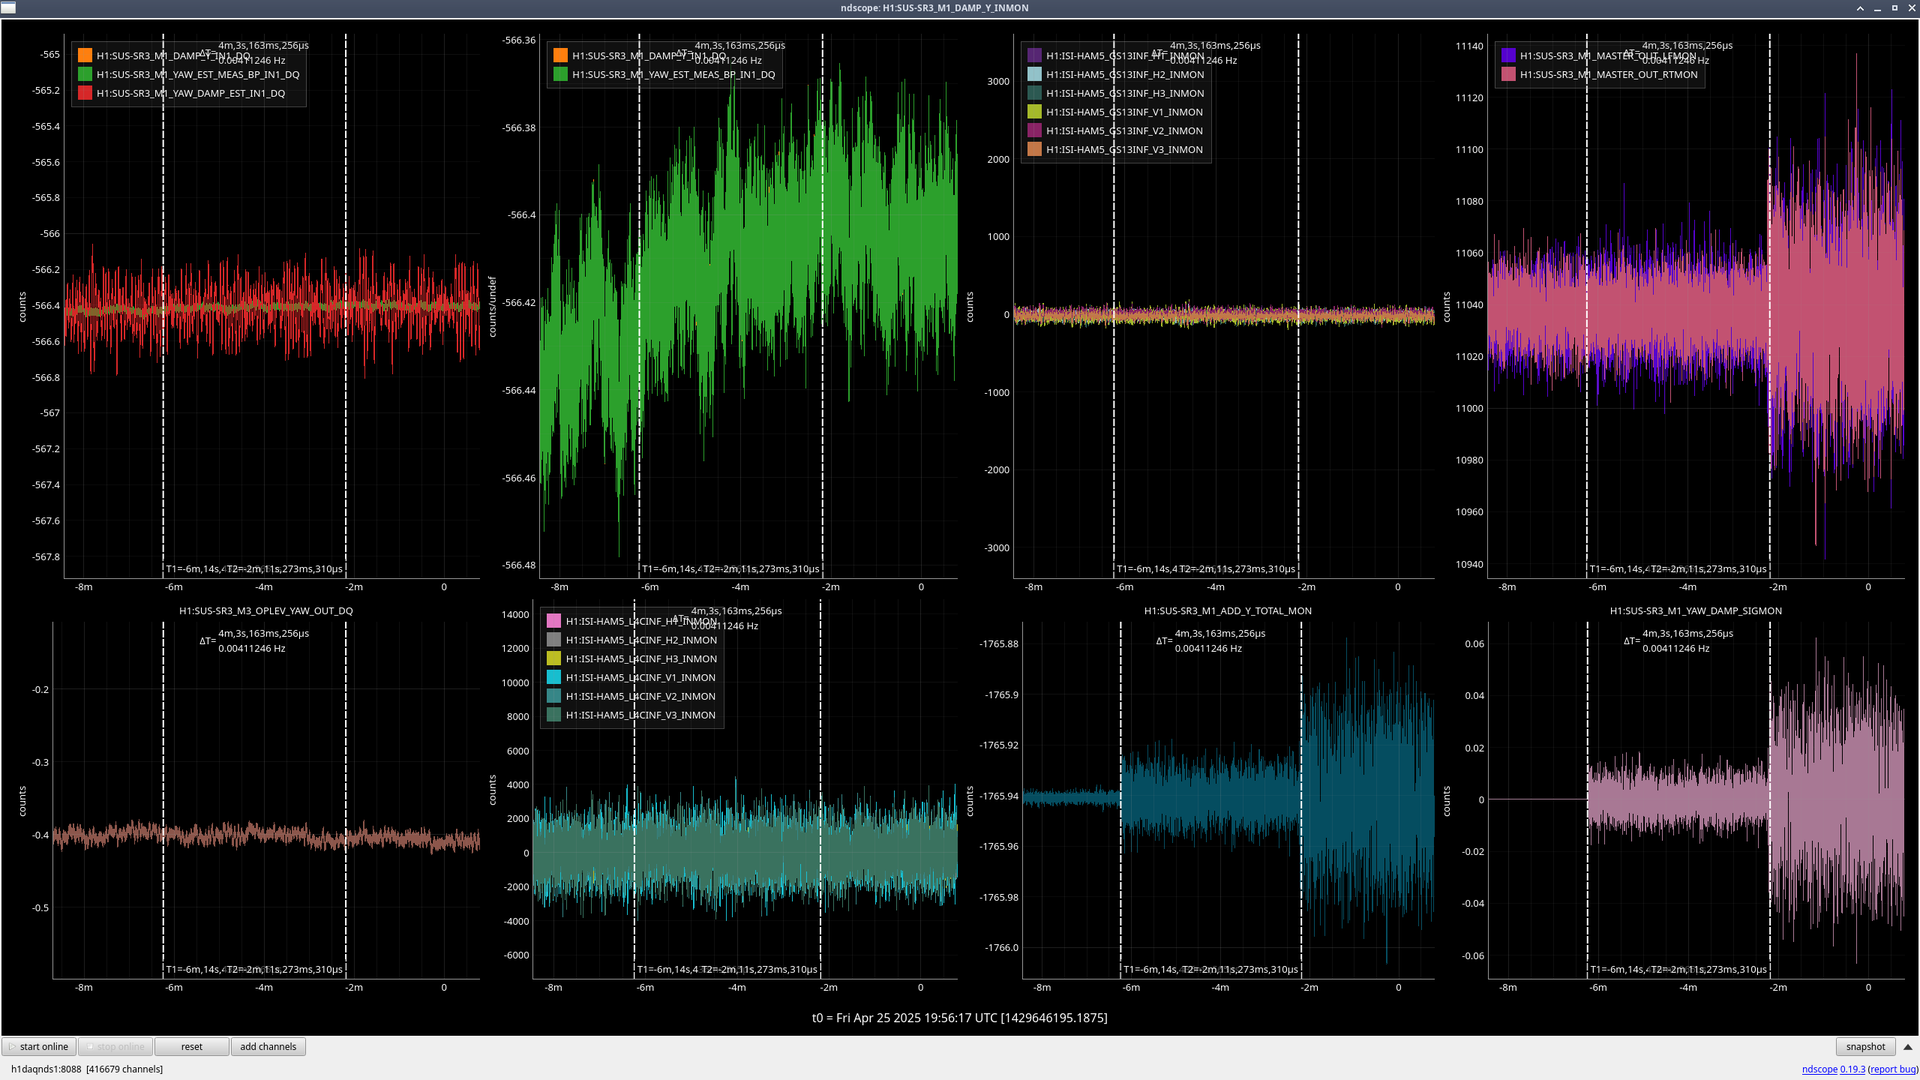
2) [See second attachment] There was a miscalibration of the fits I originally imported to the front-end. This resulted in large drives when using the estimator path. In the second figure, there are three conditions for the yaw damping of SR3:
           ( t < -6 min )          OSEM damping with gain of -0.1.
    ( -6 min<  t  < -2 min)   OSEM damping with a gain of -0.5, split between the usual damping path and the estimator path.
     ( -2 min < t < 0 min)     OSEM + Estimator damping.

The top left corner plot shows the observed motion from every path. It can be seen that M1_YAW_DAMP_EST_IN1 (the input to the estimator damping filters) is orders of magnitude larger than M1_DAMP_IN1 (the imput to the regular OSEM damping filters).

The issue was that I fit and exported the transfer functions in SI units, [m/m] for the suspoint to M1, and [m/N] for M1 to M1. I didn't export the calibration factors to convert to [um/nm] and [um/drive_cts], respectively.

____

I fixed this issue on Friday. Updated the files in /sus/trunk/HLTS/Common/FilterDesign/Estimator/  to add a calibration filter module to the two estimator paths (a factor of 0.001 for suspoint to M1, and 1.5404 for M1 to M1). The changes are current as of revision 12288 of the sus svn.

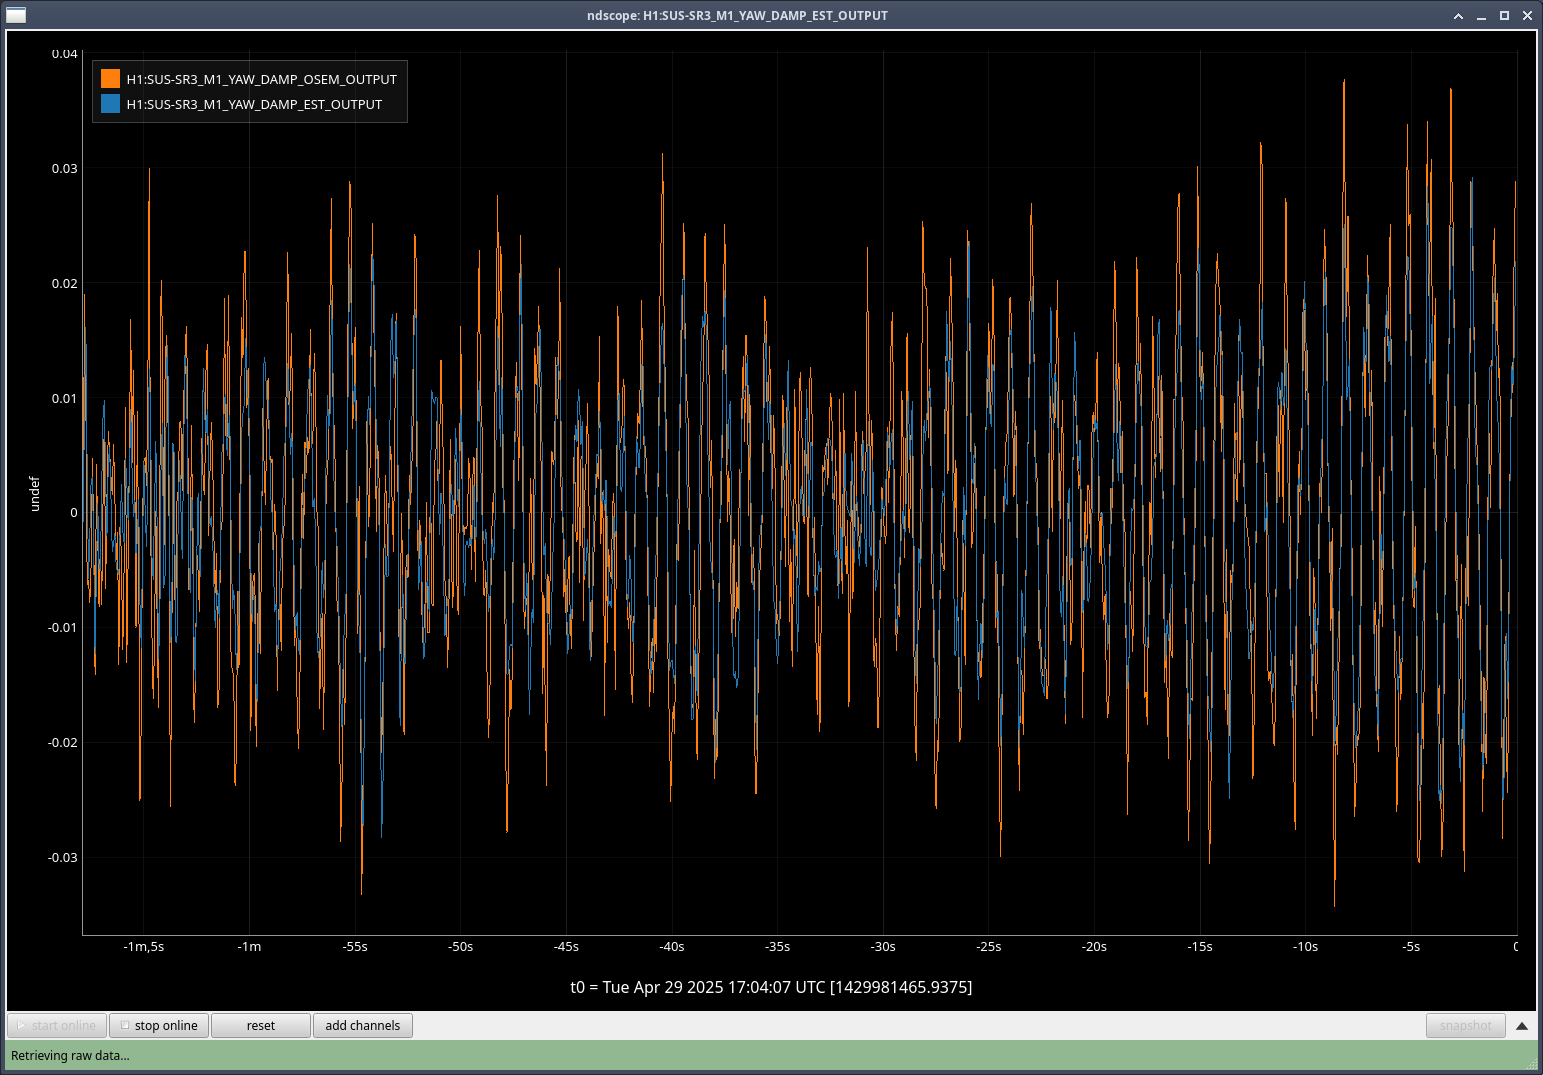
The third attachment shows the intended drives from the estimator and OSEM-only paths. They look similar enough that we believe the miscalibration issue has been resolved. For now we stand by until there is a chance to test the scheme again.

Images attached to this report
Comments related to this report
oli.patane@LIGO.ORG - 13:40, Tuesday 29 April 2025 (84179)

I've finished the set of test measurements for this latest set of filter files (where we now have the calibration filters in)
These tests were done with HAM5 in ISOLATED

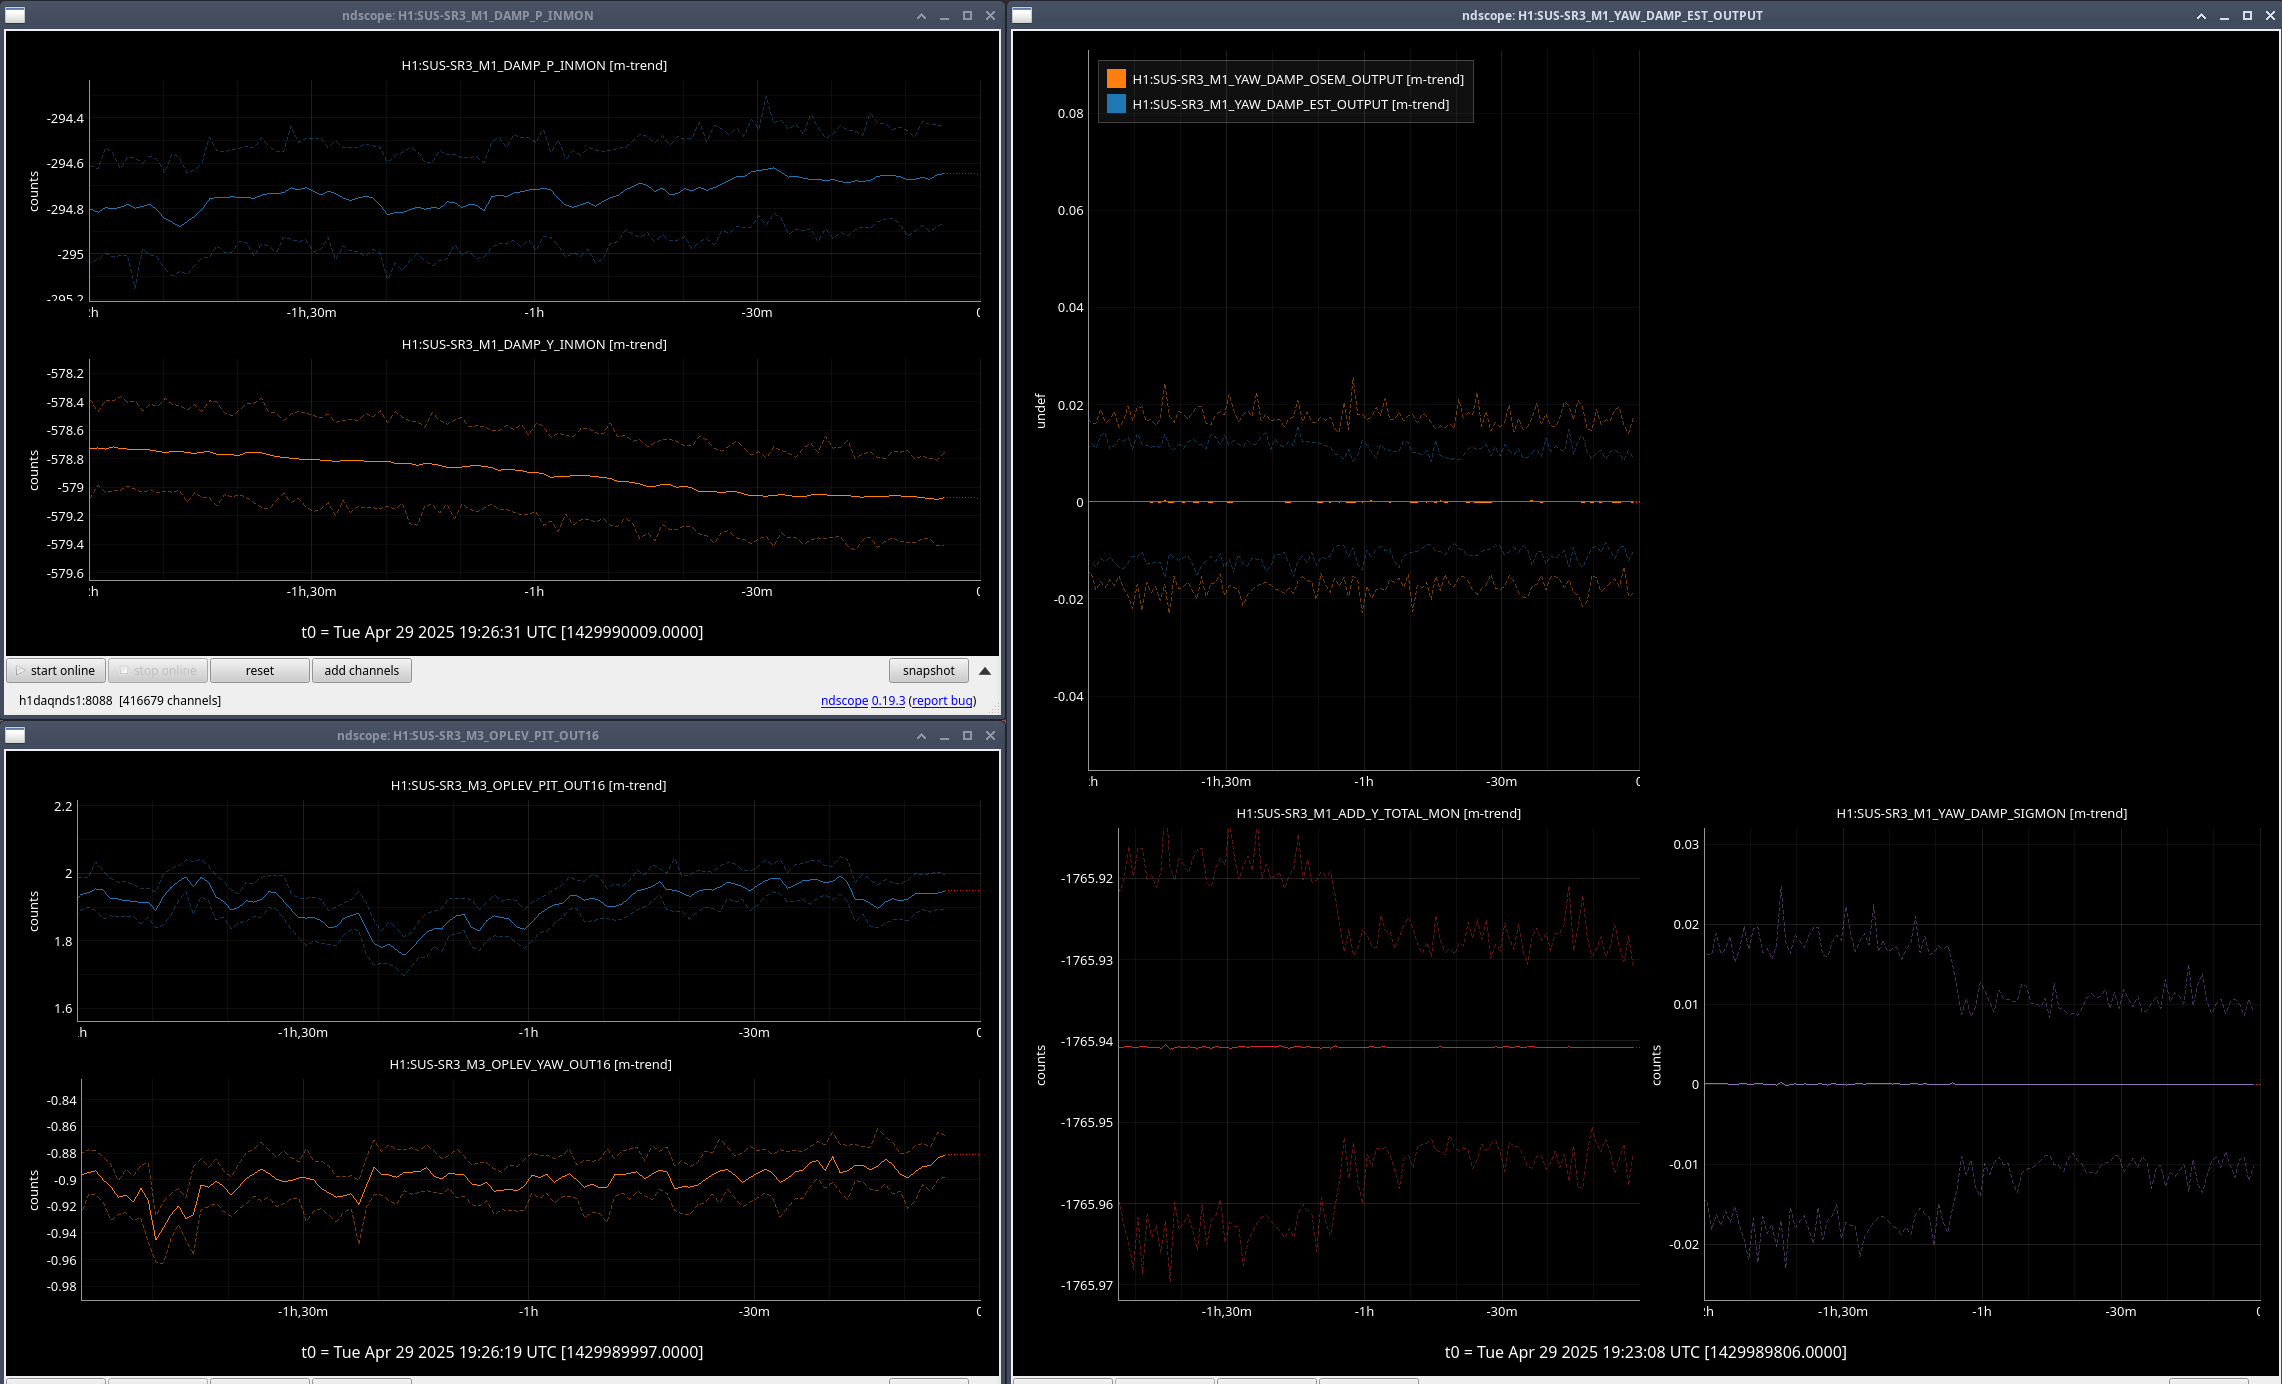
Test 1: Baseline; classic damping w/ gain of Y to -0.1(I took this measurement after the other two tests)
start: 04/29/2025 19:22:05 UTC
end: 04/29/2025 20:31:00 UTC

Test 2: Classic damping w/ gain of Y to -0.1, OSEM Damp Y -0.4
start: 04/29/2025 17:16:00 UTC
end: 04/29/2025 18:18:00 UTC

Test 3: Classic damping w/ gain of Y to -0.1, EST Damp Y -0.4
start: 04/29/2025 18:18:05 UTC
end: 04/29/2025 19:22:00 UTC

Now that we have the calibration in, it looks like there is a decrease in the noise seen between damping with the osems vs using the estimator.

In the plot I've attached, the first half shows Test 2 and the second half shows Test 3

Images attached to this comment
edgard.bonilla@LIGO.ORG - 16:21, Tuesday 29 April 2025 (84185)

I analyzed the output of the tests for us to compare.

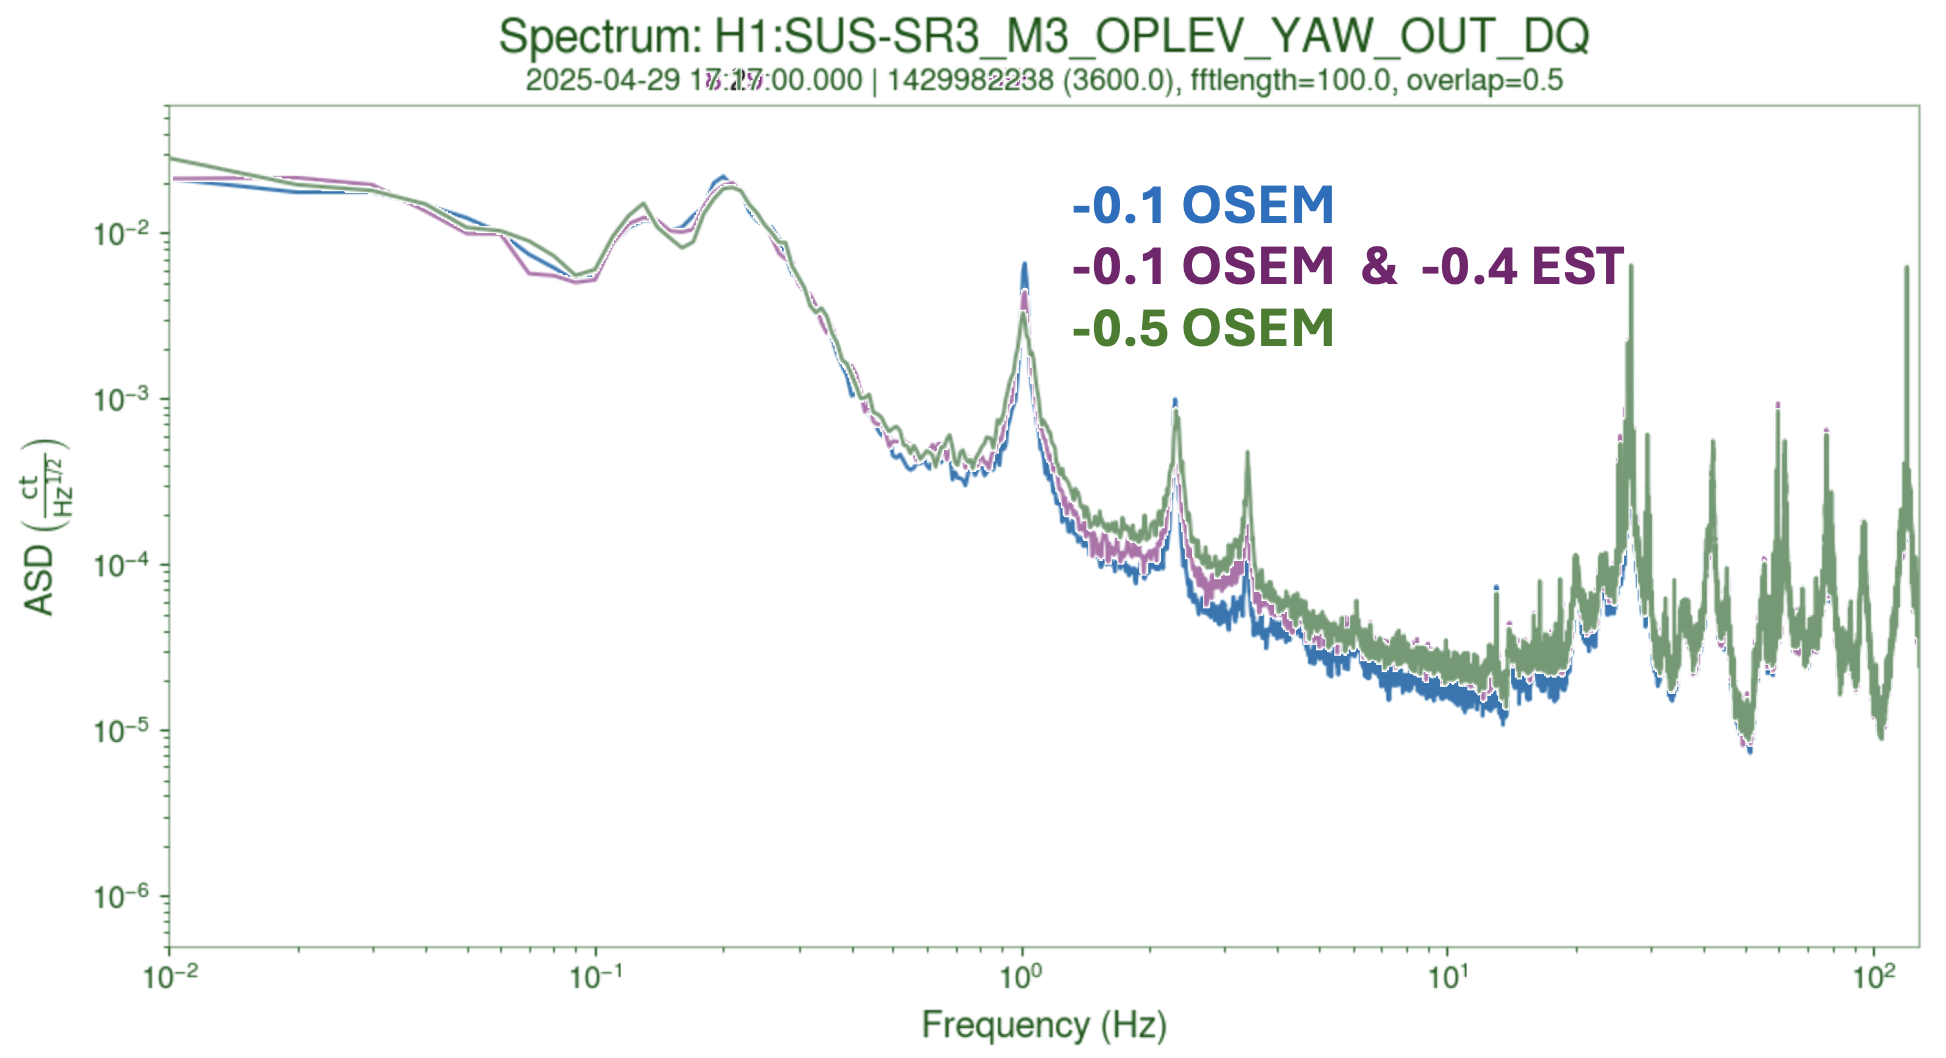
1) First attachment shows the damping of the Yaw modes as seen by the optical lever in SR3. We can see that the estimator is reducing the motion of the 2 Hz and 3 Hz frequency modes. This is most easily seen by flicking through pages 8-10 of the .pdf attached. The first mode's Q factor is higher than OSEM only damping at -0.5 gain, but it is lower than if we kept a -0.1 gain.

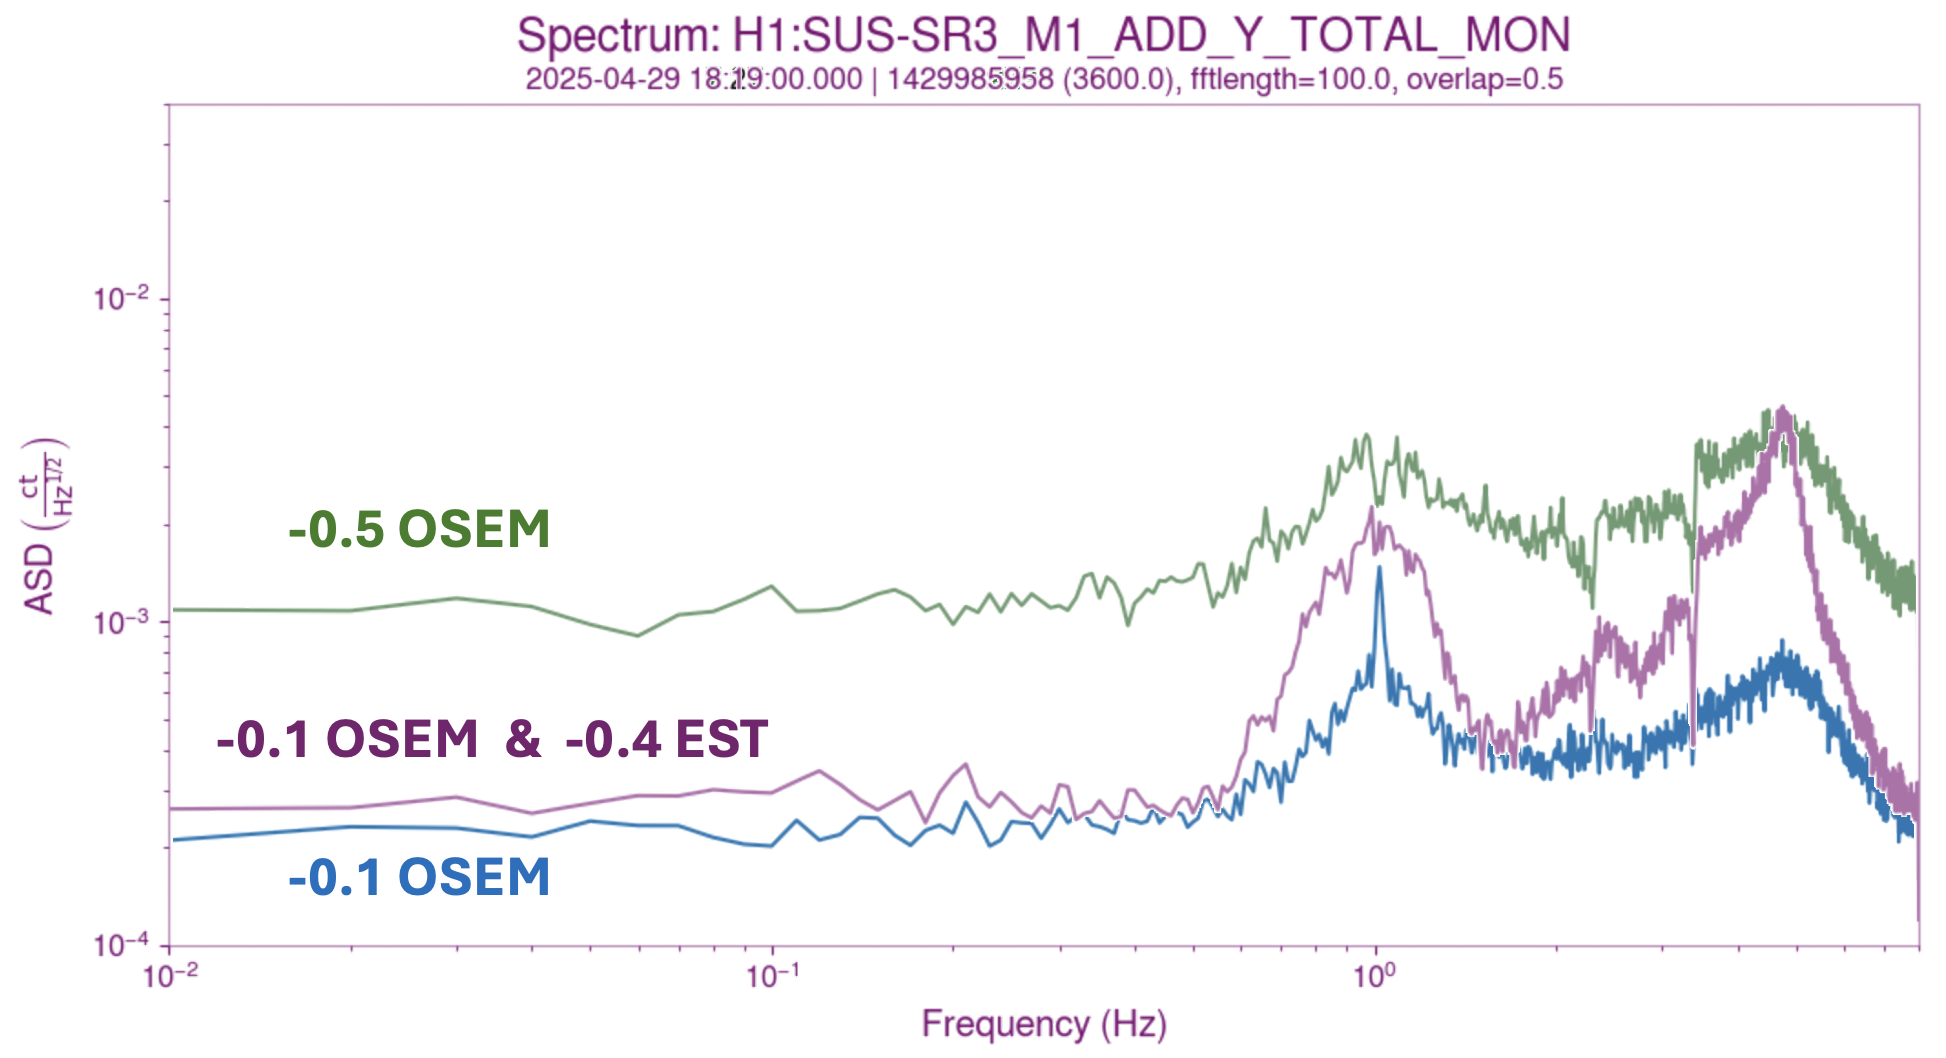
2) The second attachment shows that we get this by adding less noise at higher frequencies. From 5 Hz onwards, we have less drive going to the M1 Yaw actuators, which is a good sign. There is a weird bump around 5 Hz that I cannot explain. It could be an artifact of the complementary filters that I'm not understanding, or it could be an artifact of using a 16Hz channel to observe these transfer functions.

Considering that the fits were made on Friday while the chamber was being evacuated and that the suspension had not thermalized, I think this is a success. The Optical lever is seeing less motion in the 1-5 Hz band consistent with expectations (see, for example some of the error plots in 84004), with the exception of the 1Hz resonance. We expect this error to be mitigated by performing a fit with the suspension thermalized.

Some things of note:

- We could perform an "active" measurement of the estimator's performance by driving the ISI during the next round of measurements. We don't even have to use it in loop, just observe M1_YAW_EST_DAMP_IN1_DQ, and compare it with M1_DAMP_IN1_DQ.
The benefit would be to get a measurement of the 'goodness of fit' that we can use as part of a noise budget.


- We should investigate the 5 Hz 'bump' in the drive. While the total drive does not exceed the value for OSEM-only damping, I want to rule out the presence of any weird poles or zeros that could interact negatively with other loops.


Images attached to this comment
Non-image files attached to this comment
edgard.bonilla@LIGO.ORG - 09:42, Thursday 01 May 2025 (84219)SEI, SUS

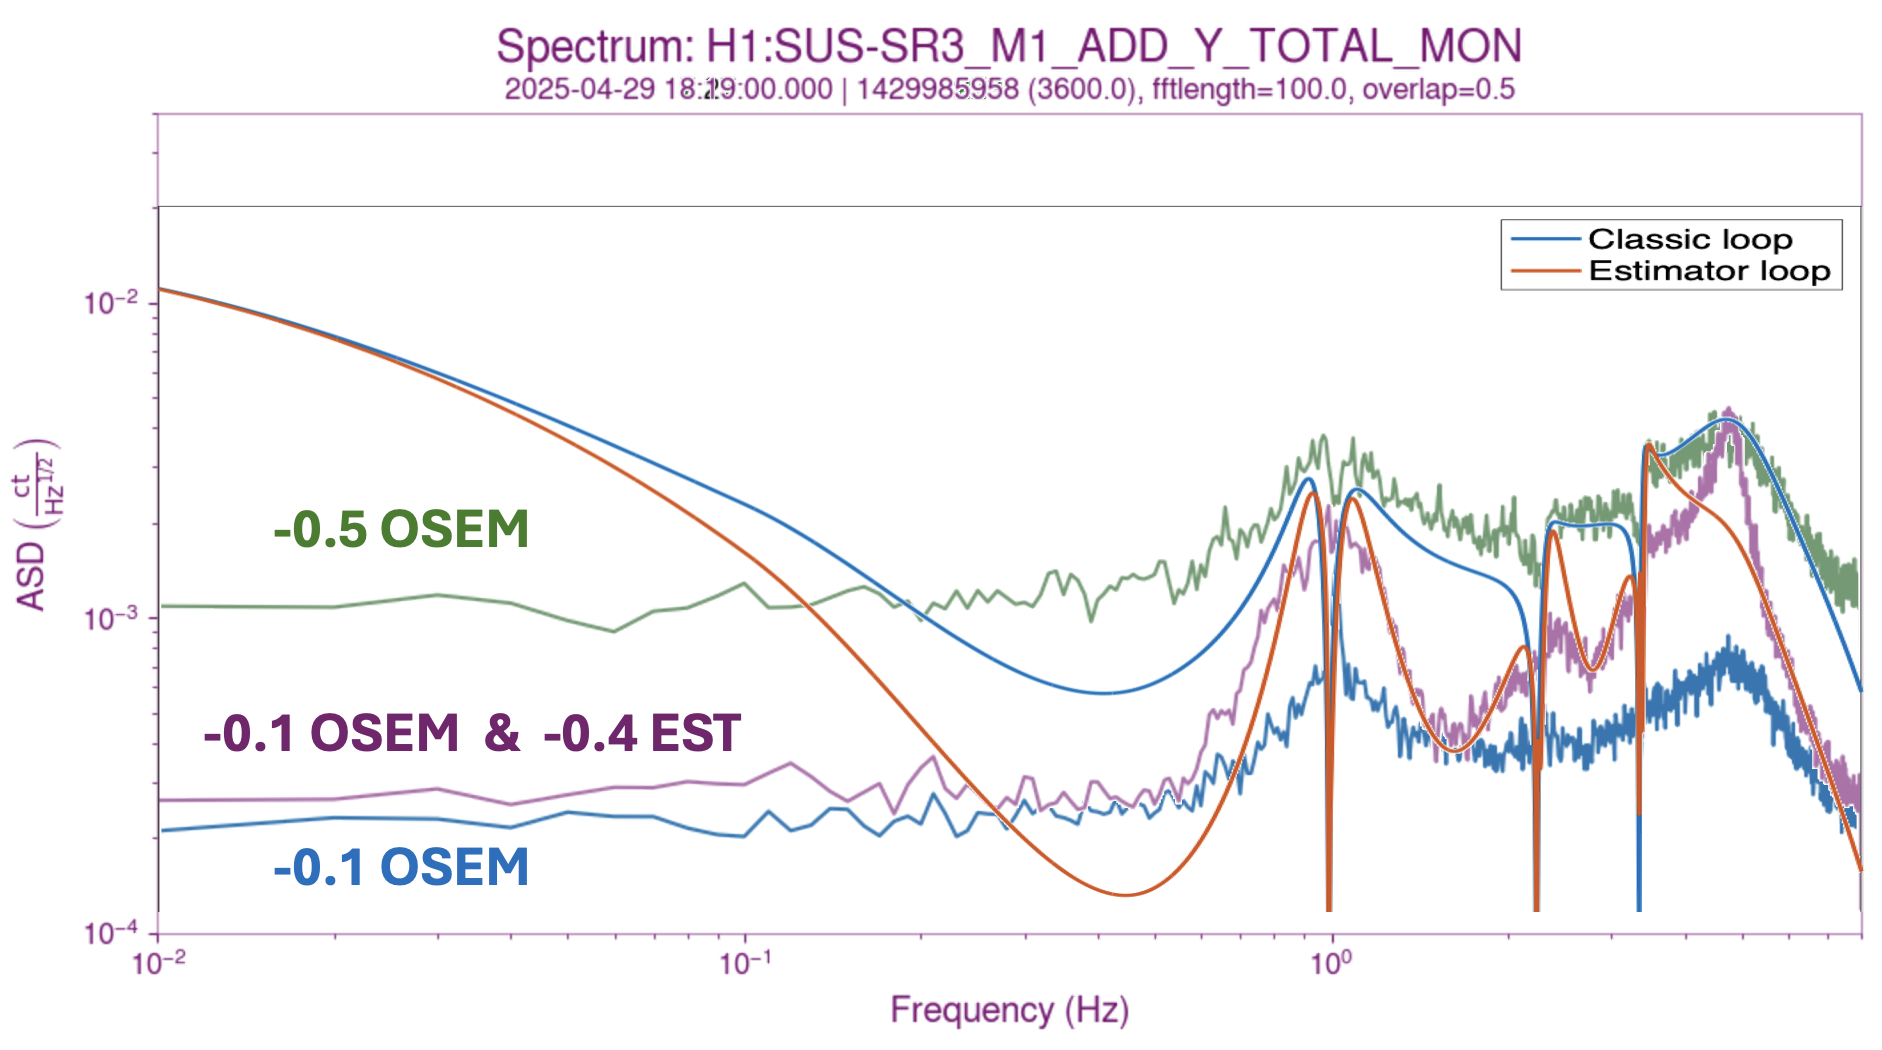
Attached you can see a comparison between predicted and measured drives for two of the conditions of this test. The theoretical predictions are entirely made using the MATLAB model for the suspension and assume that the OSEM noise is the main contributor to the drive spectrum. Therefore, they are hand-fit to the correct scale, and they might miss effects related to the gain miscalibration of the SR3 OSEMs shown in the fit in 84041 [note that the gain of the ISI to M1 transfer function asymptotes to 0.75 OSEM m/ GS13 m, as opposed to 1 m/m].

In the figure we can see that the theoretical prediction for the OSEM-only damping (with a gain of -0.5) is fairly accurate at predicting the observed drive for this condition. The observed feature at 5 Hz is related to the shape of the controller, which is well captured by our model for the normal M1 damping loops (classic loop).

In the same figure, we can see that the expected estimator drive is similarly well captured (at least in shape) by the theoretical prediction. Unfortunately, we predict the controller-related peaking to be at 4 Hz instead of the observed 5 Hz. Brian and I are wary that it could mean we are sensitive to small changes in the plant. The leading hypothesis right now is that it is related to the phase loss we have in the M1 to M1 transfer function that is not captured by the model.

The next step is to test this hypothesis by using a semi-empirical model instead of a fully theoretical one.

Images attached to this comment
edgard.bonilla@LIGO.ORG - 14:56, Monday 05 May 2025 (84260)SEI, SUS

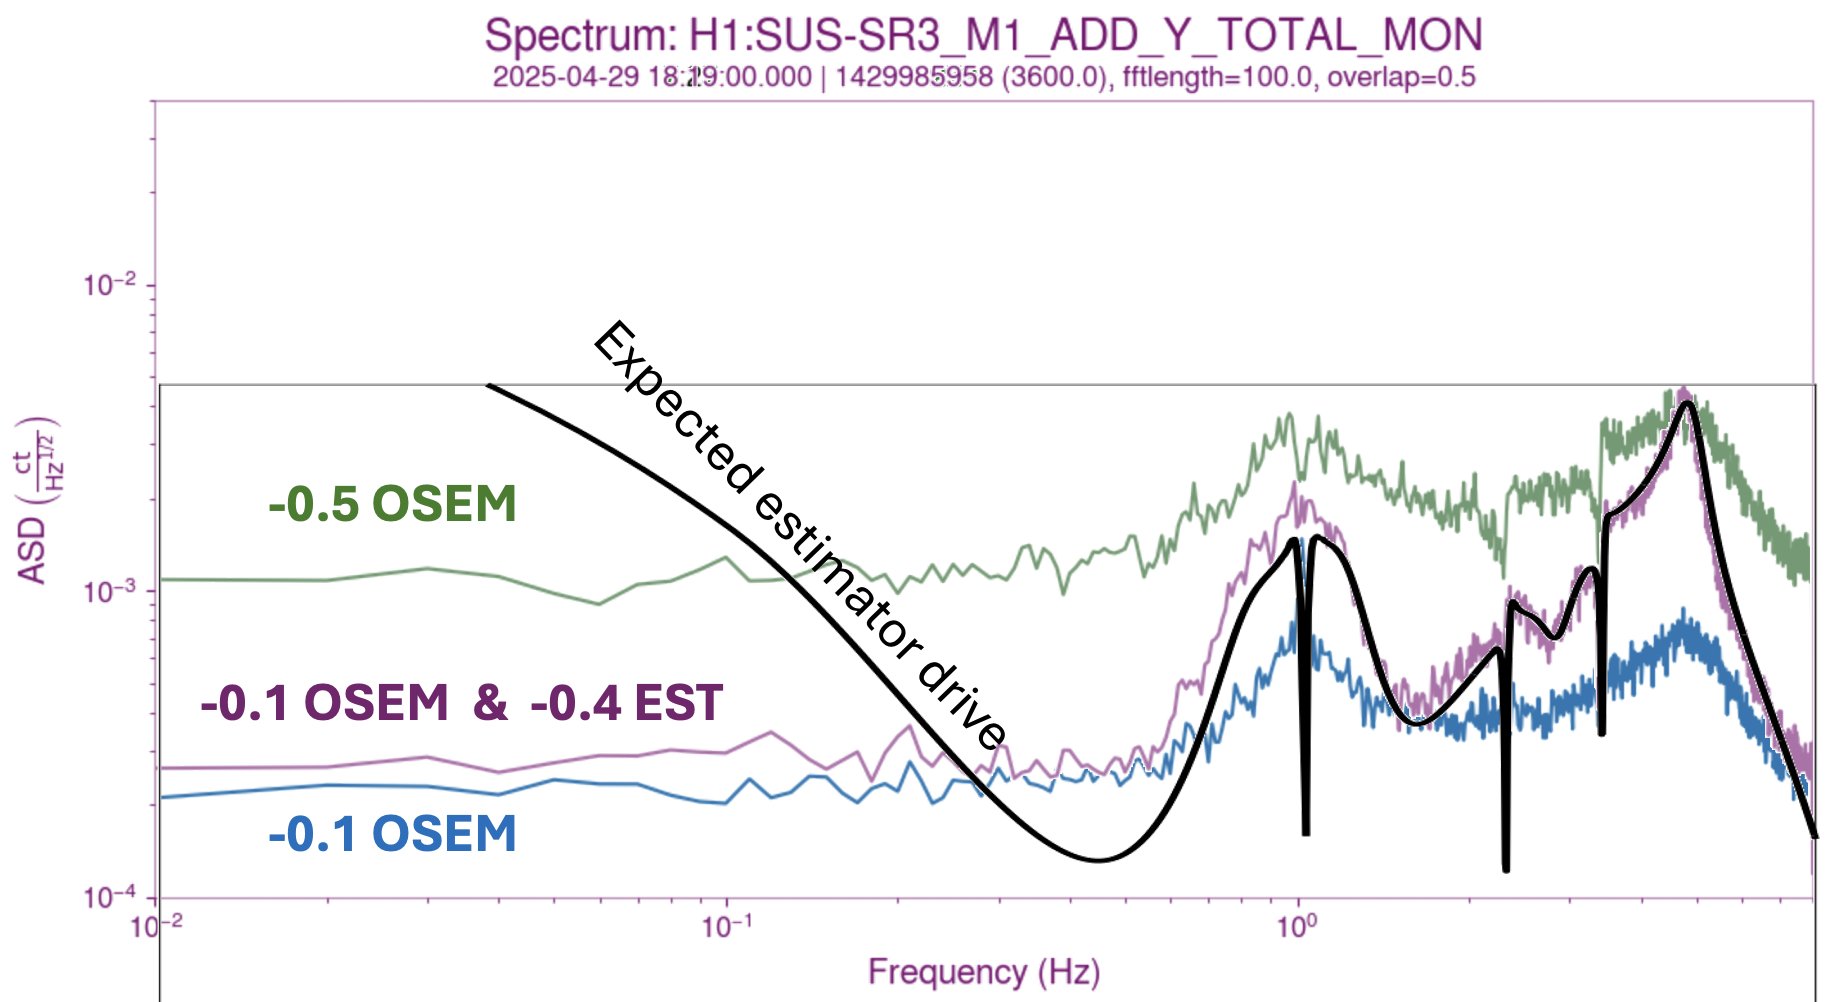
We were able to explain the drive observed in the tests after accounting for two differences not included in the modelling:

1) The gain of the damping loop loaded into Foton is different from the most recent ones documented in the sus SVN:
sus/trunk/HLTS/Common/FilterDesign/MatFiles/dampingfilters_HLTS_H1SR3_20bitDACs_H1HAM5ISI_nosqrtLever_2022-10-31.mat
They differ by a factor of 28 or so, which does not seem consistent with a calibration error of any sort. But since it is not documented into the .mat files makes it difficult to analyze without ourtright having the filters currently in foton.

2) There was spurious factor of 12.3 on the measured M1 to M1 transfer function due to gains in the SR3_M1_TEST filter bank ( documented in 84259 ). This factor means that our SR3 M1 to M1 fit was wrong by the same factor, the real transfer function is 12 times smaller than the measured one, and in turn, than our fit.

After we account for those two erroneous factors, our expected drive matches the observed drive [see attached figure]. The low frequency discrepancy is entirely because we overestimate the OSEM sensor noise at low frequencies [see G2002065 for an HSTS example of the same thing]. Therefore, we have succeeded at modelling the observed drives, and can move on to trying the estimator for real.

_____

Next steps:
- Recalibrate the SR3 OSEMs (remembering to compensate the gain of the M1_DAMP and the estimator damping loops)
- Remeasure the ISI and M1 Yaw to M1 Yaw transfer functions
- Fit and try the estimator for real

Images attached to this comment
Displaying reports 7221-7240 of 89060.Go to page Start 358 359 360 361 362 363 364 365 366 End