model restarts logged for Tue 11/Nov/2014
2014_11_11 01:42 h1fw0
2014_11_11 10:27 h1fw1
2014_11_11 12:23 h1broadcast0
2014_11_11 12:23 h1dc0
2014_11_11 12:23 h1fw0
2014_11_11 12:23 h1fw1
2014_11_11 12:23 h1nds0
2014_11_11 12:23 h1nds1
2014_11_11 20:50 h1pslpmc
2014_11_11 20:52 h1ioppsl0
2014_11_11 21:11 h1ioppsl0
2014_11_11 21:14 h1pslpmc
2014_11_11 21:17 h1ioppsl0
2014_11_11 21:17 h1psldbb
2014_11_11 21:17 h1pslfss
2014_11_11 21:17 h1psliss
2014_11_11 21:17 h1pslpmc
2014_11_11 21:49 h1ioppsl0
2014_11_11 21:49 h1psldbb
2014_11_11 21:49 h1pslfss
2014_11_11 21:49 h1psliss
2014_11_11 21:49 h1pslpmc
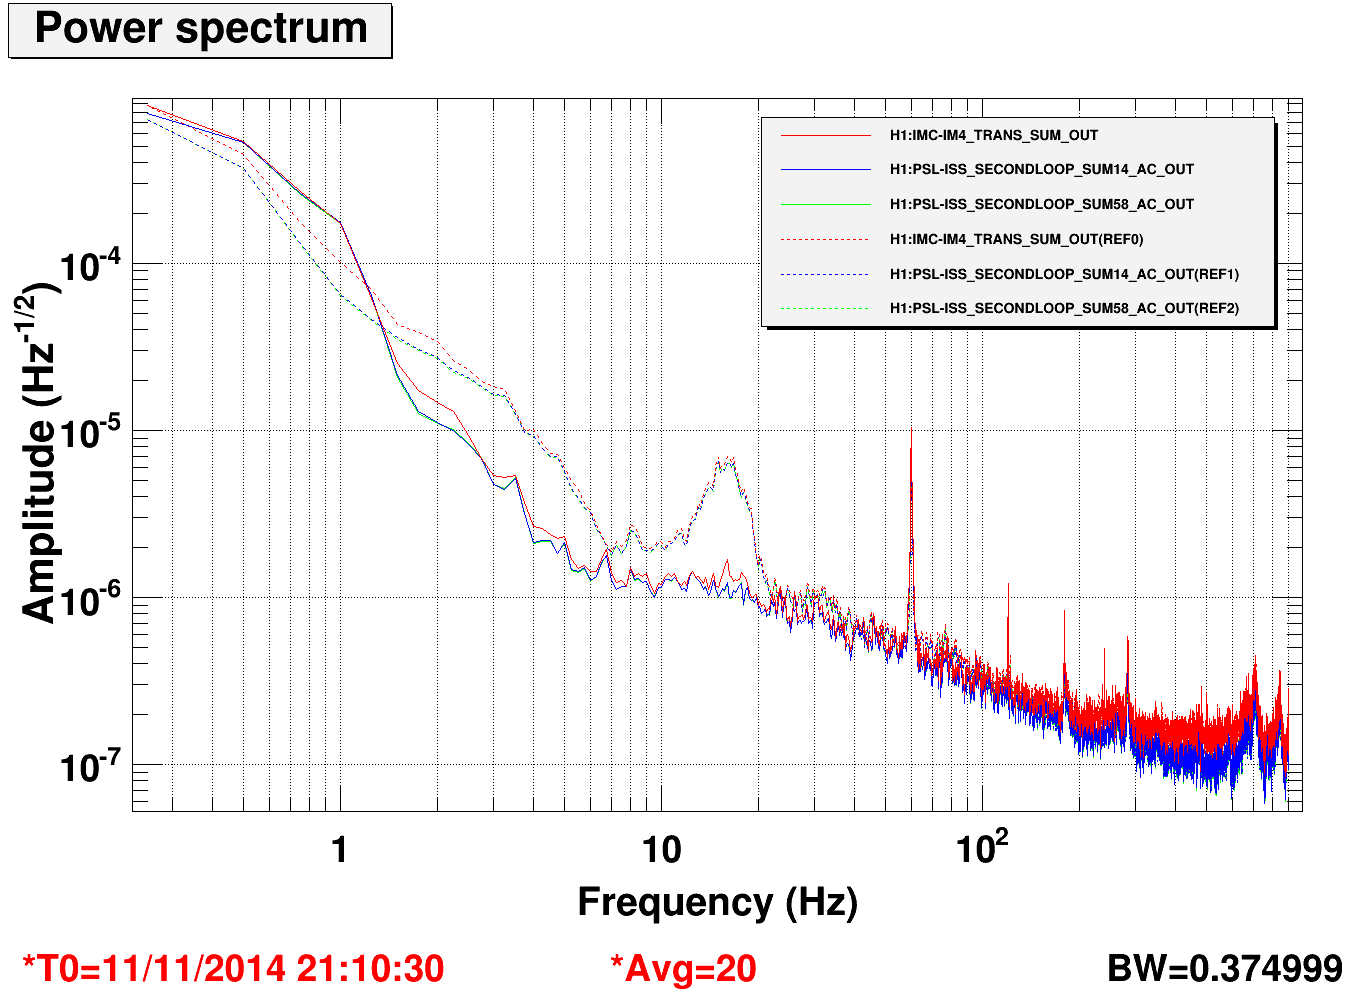
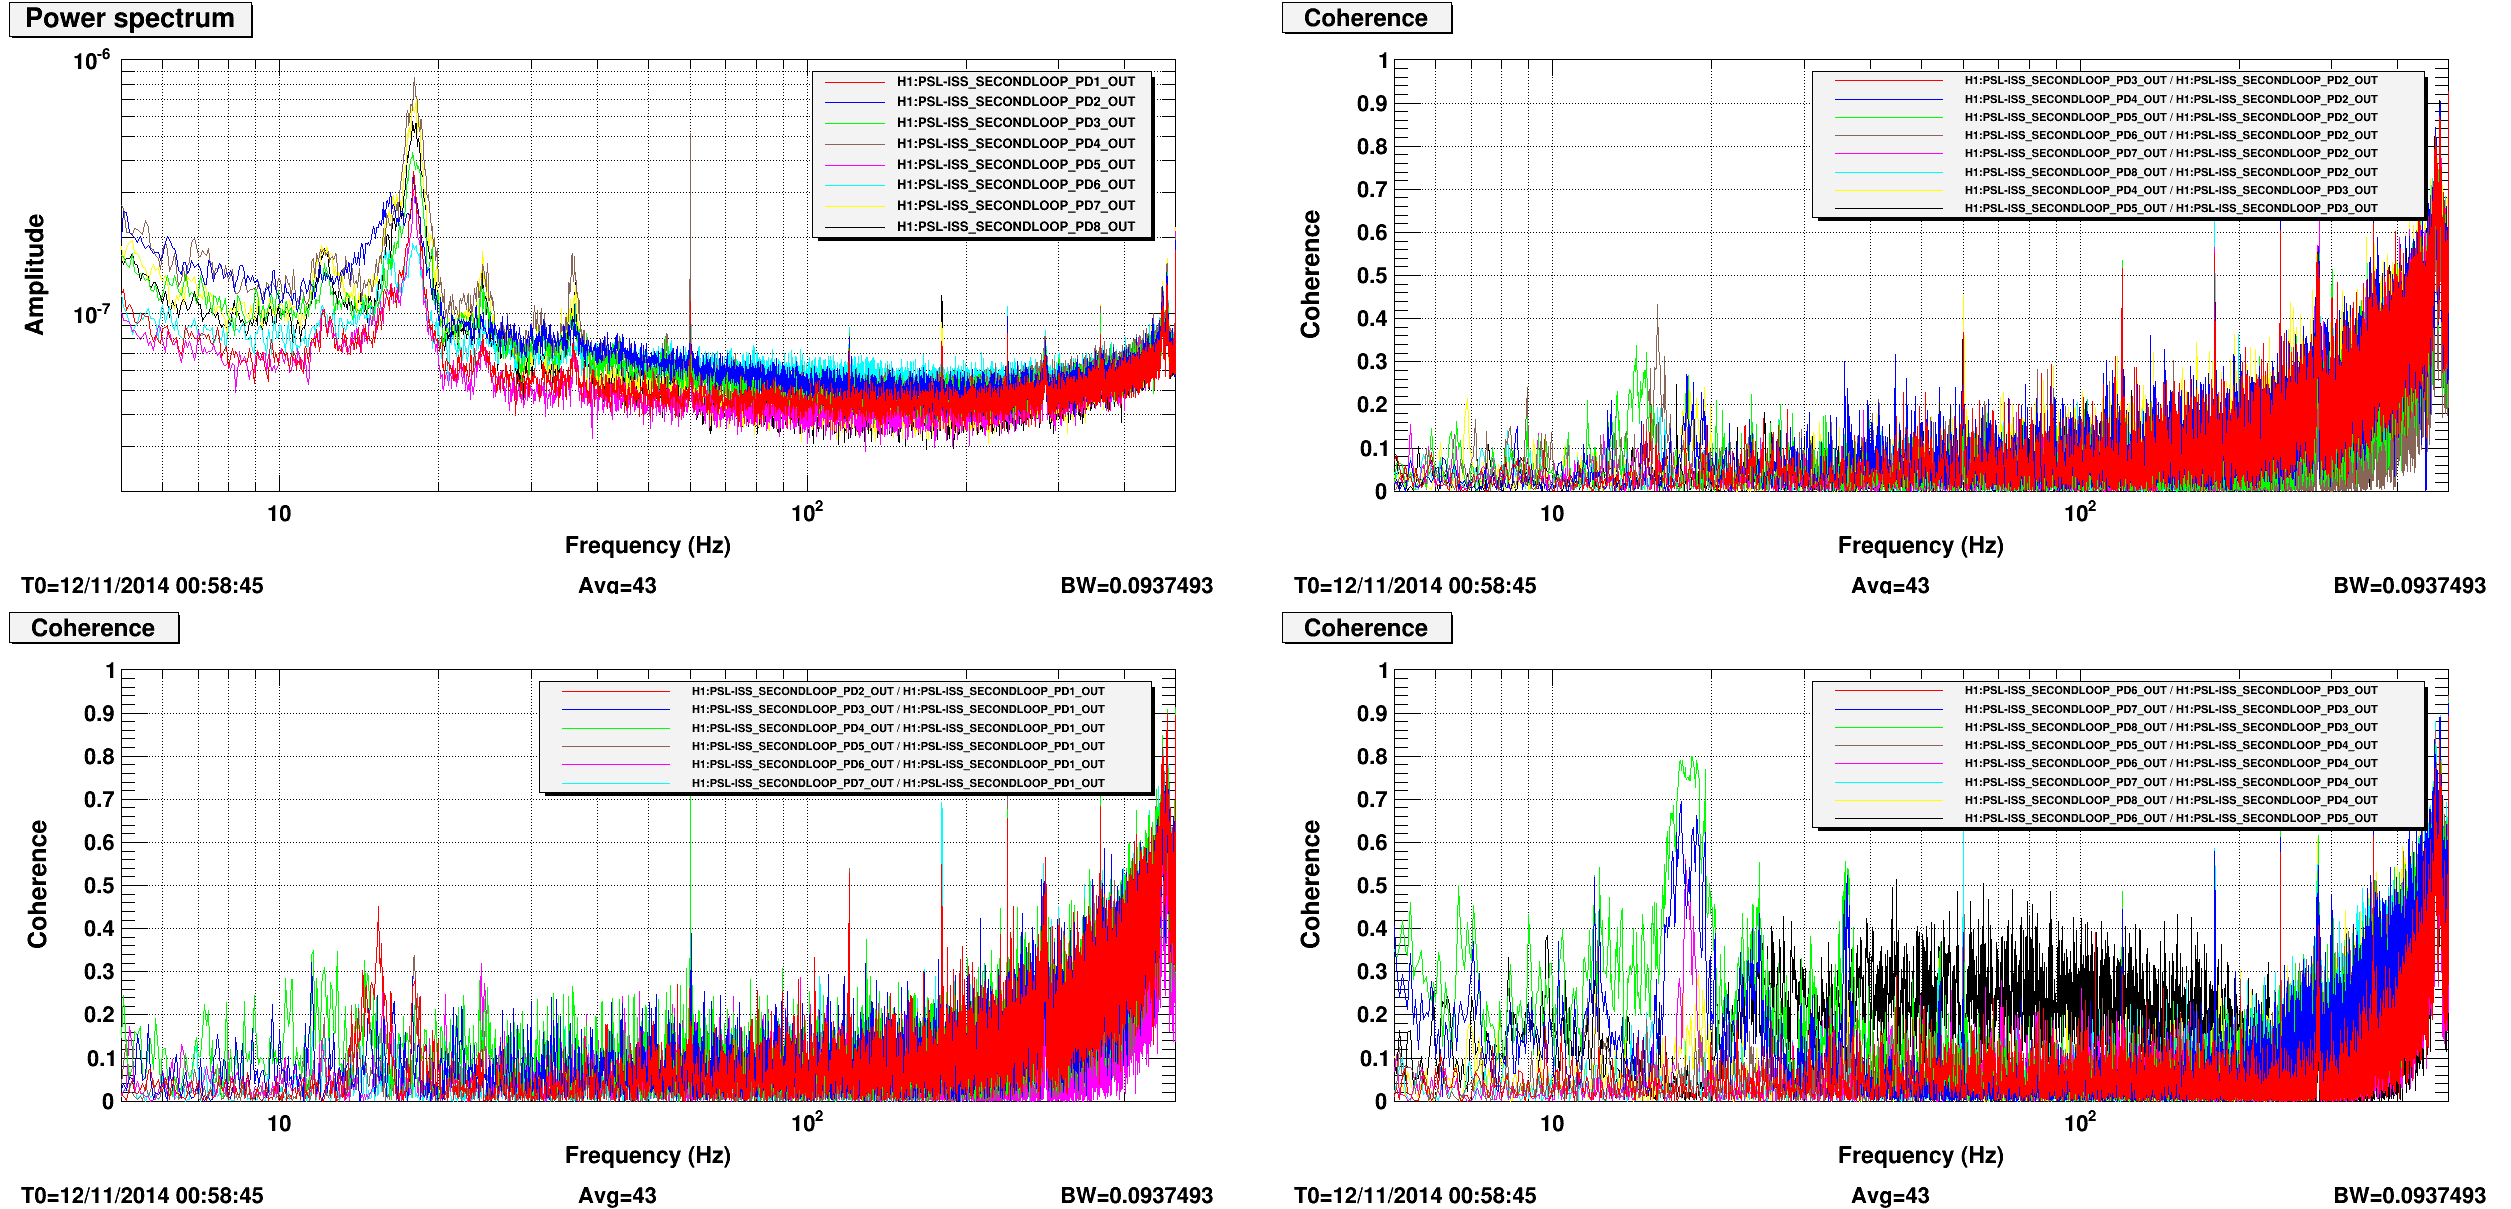
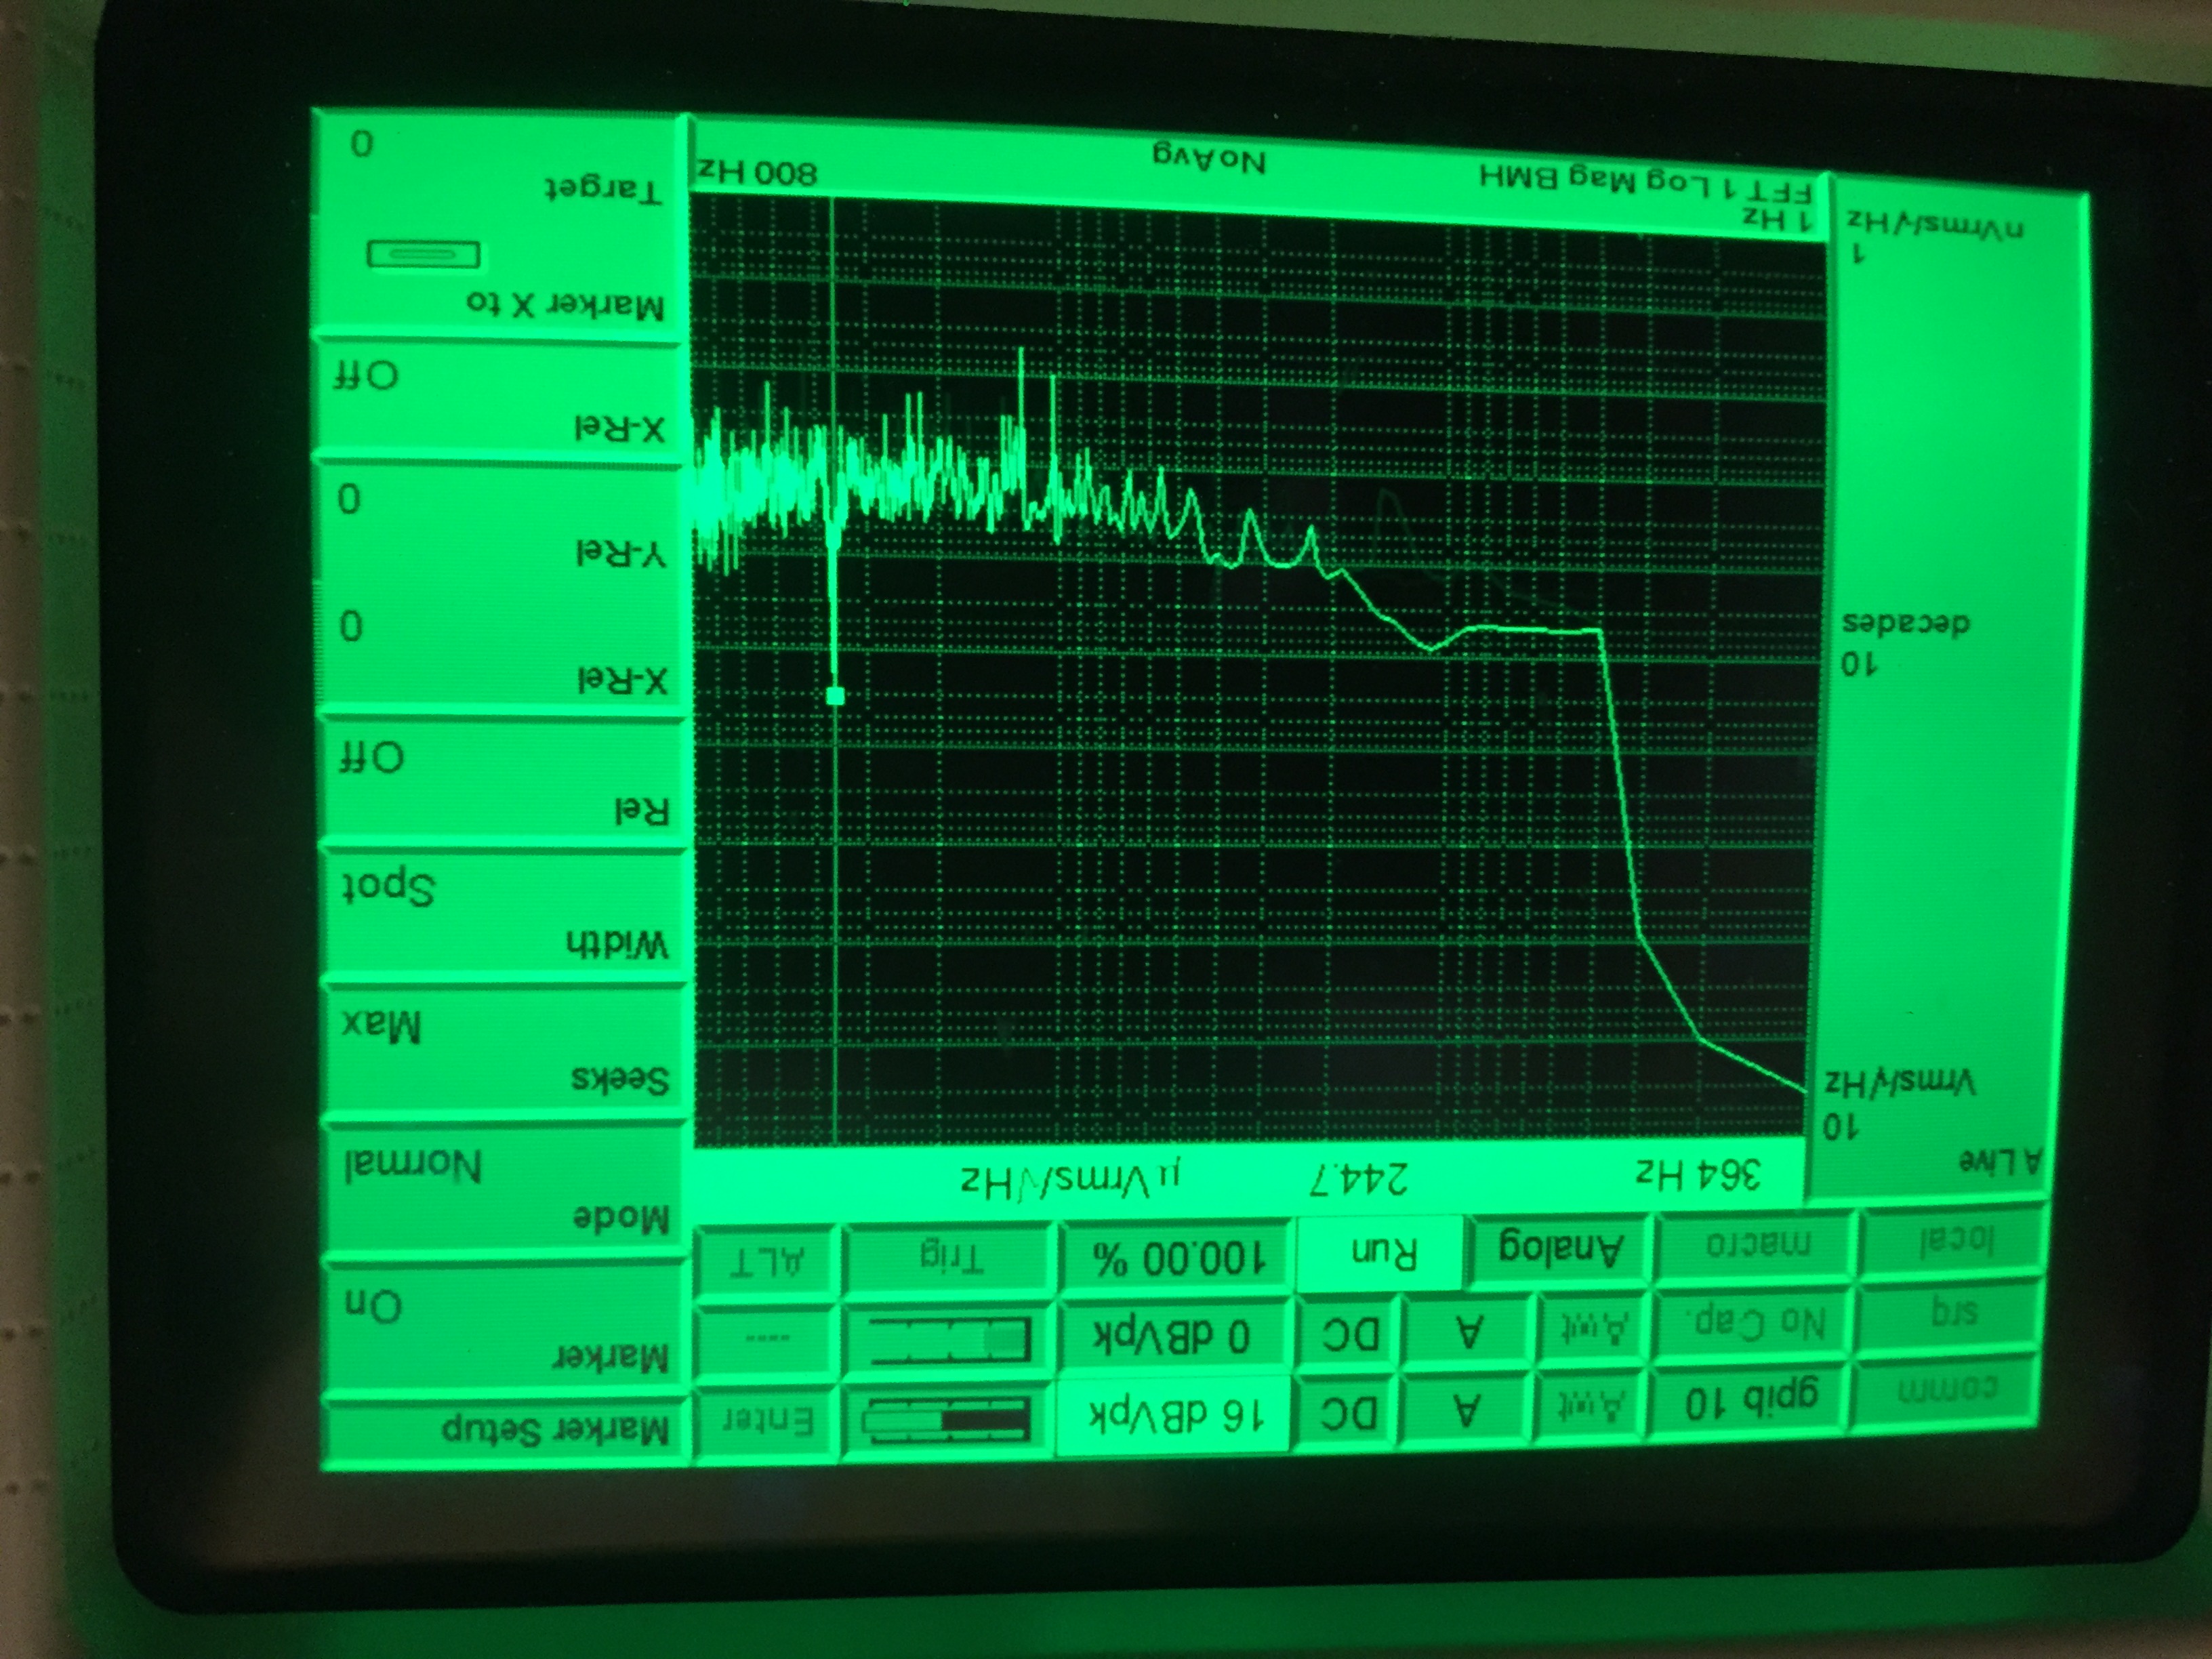
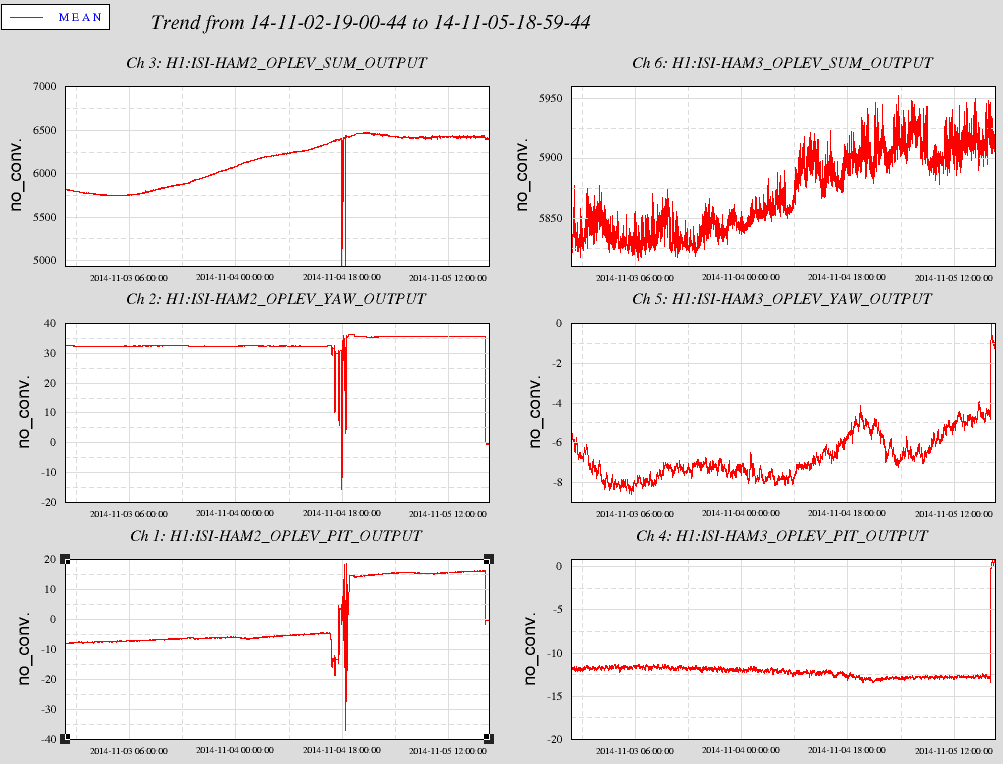
Two unexpected restarts. Tuesday maintenance. Multiple restarts of Beckhoff chassis (not shown) with associated DAQ restart. Restart of h1psl0 models as part of investigation into PSL issues in CER.