Alexa, Sheila
The x end ethercat was not running when we got here. It had the choose runtime system error. I created botprojects for each plc, as I was doing that the computer crashed. I restarted again using the restart script, the plcs were running when it came back up. I burted all three to friday at 11:00
A bunch of guardian upgrades were done over the weekend:
guardian core was upgraded. it's currently at r720, but it's still moving as bugs are identified and features added
cdsutils (ezca) was upgraded . currently r164, but again still working out some kinks.
The guardian supervision infrastructure was upgraded and moved to a new location on local disk on h1guardian0. I'll report on the new infrastructure in a followup post. This required killing the main process supervisor ("initctl stop guardian-runsvdir"), which shut down all the current guardian nodes.
The SUS base guardian code was upgraded. The base SUS.py was copied over from LLO. Some improvements have been made as well, which I'll report on later. Once this was in place I brought up the SUS_SRM node for testing. Was it seemed to be behaving well the SUS_MC{1,2,3} nodes were restarted. The rest of the SUS nodes were left off for the moment, but will be restarted tomorrow.
The IMC autolocker code was upgraded. The new code is based on the code that was developed at LLO. Again, to be expounded later. The IMC autolocker upgrad exposed some issues with the current guardian behavior that will need to be fixed tomorrow.
Last week with Andres's help I measured resonance frequencies on SR2 in the double and single hang cases (top locked on stops and middle locked on stops respectively). This log reports the results of fitting the hsts model to that data. The adjusted parameters are listed below with the estimated error bars. Typically I allow d1 (top mass spring tip height) to move. Interestingly, the model had better results when the height of the bottom mass prism was allowed to move instead. Floating d1 did allow the resonances to line up with similar precision, however d1 and I1y would drift very far from their nominal positions to do this, about 5 mm on d1 and 50% on I1y. The attachment H1SR2_ModelFit_17Feb2014.pdf shows the measured transfer functions against the nominal model and the model fit. The measured L-P/P-L and T-R/R-T TFs do not show good symmetry, so those comparisons should be taken with a grain of salt. Likely the OSEM balancing is poor as poor balancing will cause errors in the measured zero locations. Similarly, the 1.5 Hzish zero on the measured Roll to Roll TF is probably slightly off from reality. It does not correspond exactly to the measured double hang Roll resonance as it should, and it is also somewhat off from other HSTS suspensions. The attachment H1L1SR2comparison_17Feb2014.pdf shows the same results but against L1SR2. The new model also fits L1SR2 better, though there are some minor differences. The new parameter file is on the svn at ...sus/trunk/Common/MatlabTools/TripleModel_Production/hstsopt_H1SR2fit.m The model fitting code for H1SR2 is on the svn at ...sus/trunk/Common/MatlabTools/TripleModel_Fit/TripPend_GaussNewton_fit_v5_H1SR2.m Change in parameters from original model with the estimated minimum errors --------------------------------------- d4: -1.6798 +- 0.094782 mm I1x: -6.3844 +- 1.2588 % I2x: -5.2885 +- 11.4653 % I3x: -3.706 +- 12.1017 % I1y: 8.8773 +- 0.61371 % I2y: -5.583 +- 0.5374 % I3y: -4.6949 +- 0.36401 % I1z: -5.7573 +- 0.9752 % I2z: 1.2902 +- 1.0012 % I3z: -3.2293 +- 0.30808 % l1: 5.5655 +- 3.3226 mm l2: 4.2327 +- 0.52961 mm l3: 1.4169 +- 0.40356 mm kc1: -1.2835 +- 1.2589 % kc2: 2.4943 +- 0.4258 % ---------------------------------------
tmtsopt_firstarticle tmtsopt_firstarticle tmtsopt_production r4580 r6273 r6273 -------------------------------------------------------------------- modeY1 0.355864 modeY1 0.357487 modeY1 0.356438 modeT1 0.447407 modeT1 0.44897 modeT1 0.44903 modeL1 0.473763 modeL1 0.474697 modeL1 0.474545 modeR1 0.678918 modeR1 0.679192 modeR1 0.650001 modeP1 0.713869 modeV1 0.73404 modeP1 0.729786 modeV1 0.729389 modeP1 0.754609 modeV1 0.750216 modeT2 1.38385 modeT2 1.36581 modeT2 1.37346 modeL2 1.72689 modeL2 1.72179 modeL2 1.73388 modeV2 2.40587 modeV2 2.40182 modeV2 2.40454 modeP2 2.44574 modeP2 2.44429 modeP2 2.56147 modeY2 2.59116 modeY2 2.58853 modeY2 2.71571 modeR2 4.27789 modeR2 4.14866 modeR2 4.31193
All the SEIs are operating as left Friday evening except the BS.
The BS ISI is tripped with a GS13 trip at 1076474647 followed by an Actuator limit trip 44 seconds later. So this ISI only lasted for a few hours (til 2043 pst Friday evening.) The watchdog plotting tools are not functional at this time, and its a holiday.
Taking the ISI back up, I see the current location and target for Rx is a mear 900nrads but this is too much tilt to start with the Trilliums in the loop.
Can a ISC/PRMI Commissioner confirm that we must servo to this value? Certainly would make getting the IS back on easier if we could reset these targets.
So going up with the 250mHz blends ( with the T240 watchdog trigger level increased the second time.) Have moved the Stage1 to nominal blends (T250 everywhere with the T100.44NO for X & Y) Stage2 is also on with the 250mHz blends. I notice the signal for Z is large on stage2 so I've turned off the Z boost. It still has some pretty large swings though... Seems to be some large low frequency oscillation comes and goes. Will still likely trip I'm thinking. If it doesn't hold maybe the blend shold be moved back to 750s. I know Jim is still working on the loops here.
I was starting to see the Epics readouts for the output filters get into the 1000s for the horizontals (already doing the vertical s for a while,) so I switched Stage2 to the 750mHz blends. This certainly reduced these readback's magnitude right away. I've reenabled the Z boost now as a result.
I'll leave the ISI at this for the moment: Stage2 Lvl2 with 750mHz blend, Stage1 is Lvl2 with T100mHzNO.44 blends on X & Y and T250mHz elsewhere. Sadly, the BLRMS needs a lot more green.
Given that it's a holiday, there are no operators on site to silence the alarm chorus. There are some CDS alarms that I can't quite identify the source of, but the CDS system looks ok on the whole, so I'm just silencing them temporarily.
There does seem to be a persistent alarm from the EY dust monitor. I ACK'd it once when I came in, but it was back again a couple minutes later.
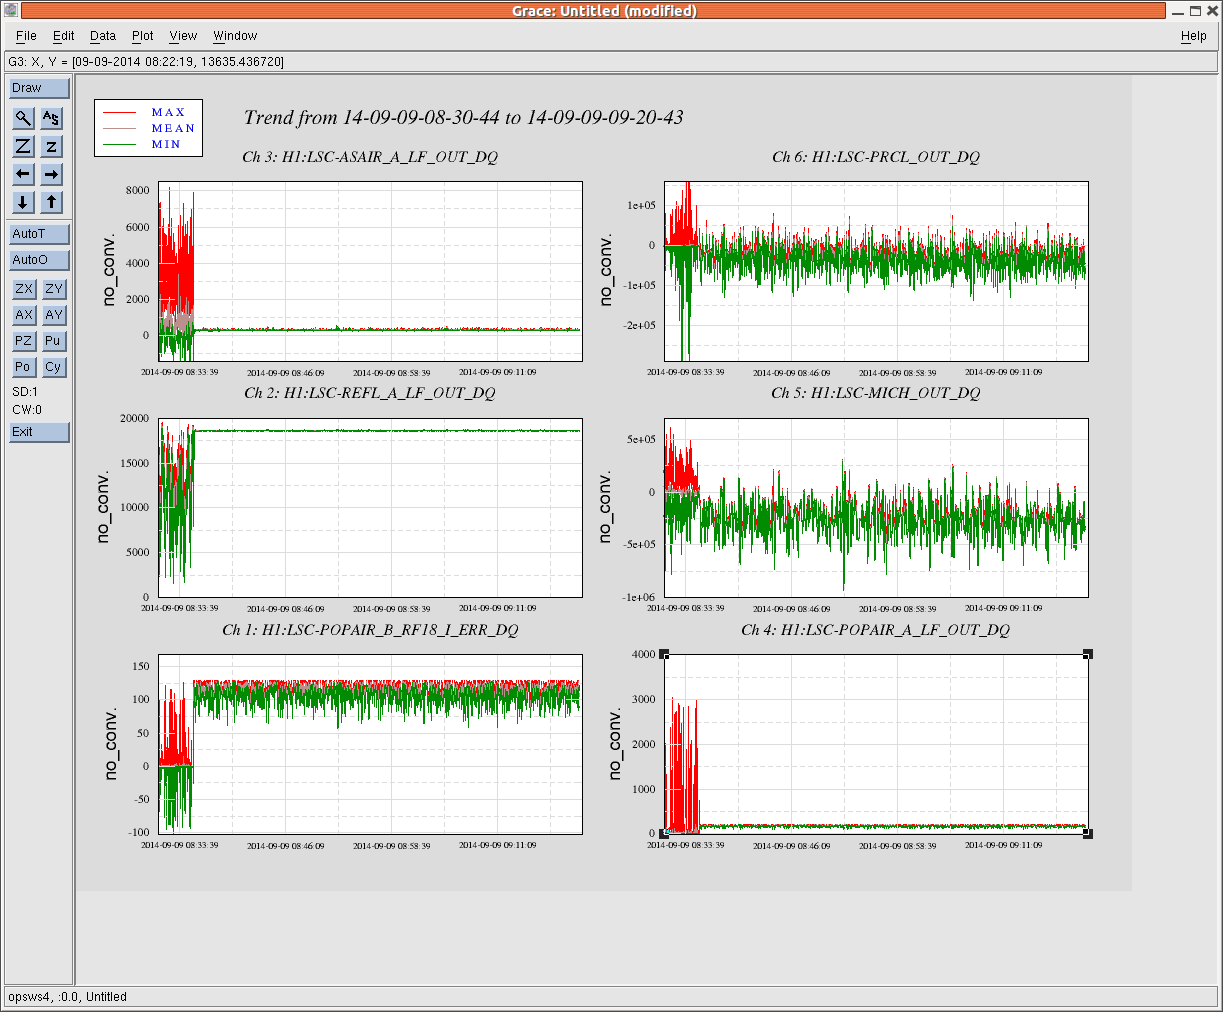
The ALS-X BBPD appears to have gone dark around 2:30 PST on Friday. The EX laser IR PD and fiber monitor PDs appear to have been disturbed around the same time, but they have recovered.
Possibly this is related to Friday's work on installing WFS on the ISCTEX table, or the related editing of the X-end simulink models.
The +-18V PD power supply cable for the table was unplugged at the power strip on the field rack. All DC diodes connected to the DC diode interface were down.
Should work now.
Don't know why it was unplugged, it's hard to accidentally plug it off.
Over the weekend both frame writers have restarted in the early hours. fw1 just after midnight Sat morning (00:01) and fw0 this morning at 01:00. They had both been very stable over the past week.
(Blue Team)
Short progress report:
More details to follow.
I set up the H1 ODC master channel: H1:ODC-MASTER_CHANNEL_OUT_DQ The "H1 Interferometer Summary" bit (bit0) now includes the following bits: Bit4: PSL Summary (EPICS timing only) Bit5: IMC Summary Bit 21:ADC overflow (for PSL, EPICS timing only) Bit 22:DAC overflow (for PSL, EPICS timing only) Bit 23:EXC on (for PSL, EPICS timing only) Bit 28:Guardian Observation Ready Bit 29:Operator Science Mode Button The guardian that will be serving bit 28 is not running yet.
I noticed from the ODC summary that the ISS was running out of range again. I changed the set point (ISS_REFSIGNAL) from -1.93 to -1.88. I also verified that this was not due to a noise eater oscillation (ODC didn't indicate it as such, and toggling it didn't change it.)
Foton files were cleaned up for every SEI platform (ISI + HEPI). Details about the cleanup process can be found in SEI aLog #370
Every SEI platform was turned off, had its filter coefficient reloaded, and turned back on exepted ETMX ISI and HEPI, which ISC commissioners needed. ETMX's platforms will get their filters reloaded at the next window of opportunity.
Work started at 4:50PM and just finished. It was performed under WP #4435 which is now closed.
SEI crew (Jim, Hugh, Hugo) left its platforms in the following state:
Hugh and I mostly finished cabling ETMY ISI today, but were held up by an issue with the CPS's and some broken test feed thru components. After we powered up the CPS's, we were systematically disconnecting sensors to verify routing and we noticed that the corners 2 and 3 were acting weird. After rounds of calling Richard, plugging and unplugging various cables, we figured out that the ribbon cable that carries the sync signal from the satellite rack chassis to it's power/distribution board was plugged in backwards. The other racks have keyed cables to prevent this, but this rack had an unkeyed cable. After fixing this we found that we also have a dead sensor, further debugging has that narrowed down to a broken probe. We don't have time today to finish balancing, so we'll continue on Tuesday.
Late entry, DAQ restart performed at 15:59PST.
Restarted the DAQ for three reasons:
The frame broadcaster had the following channels added
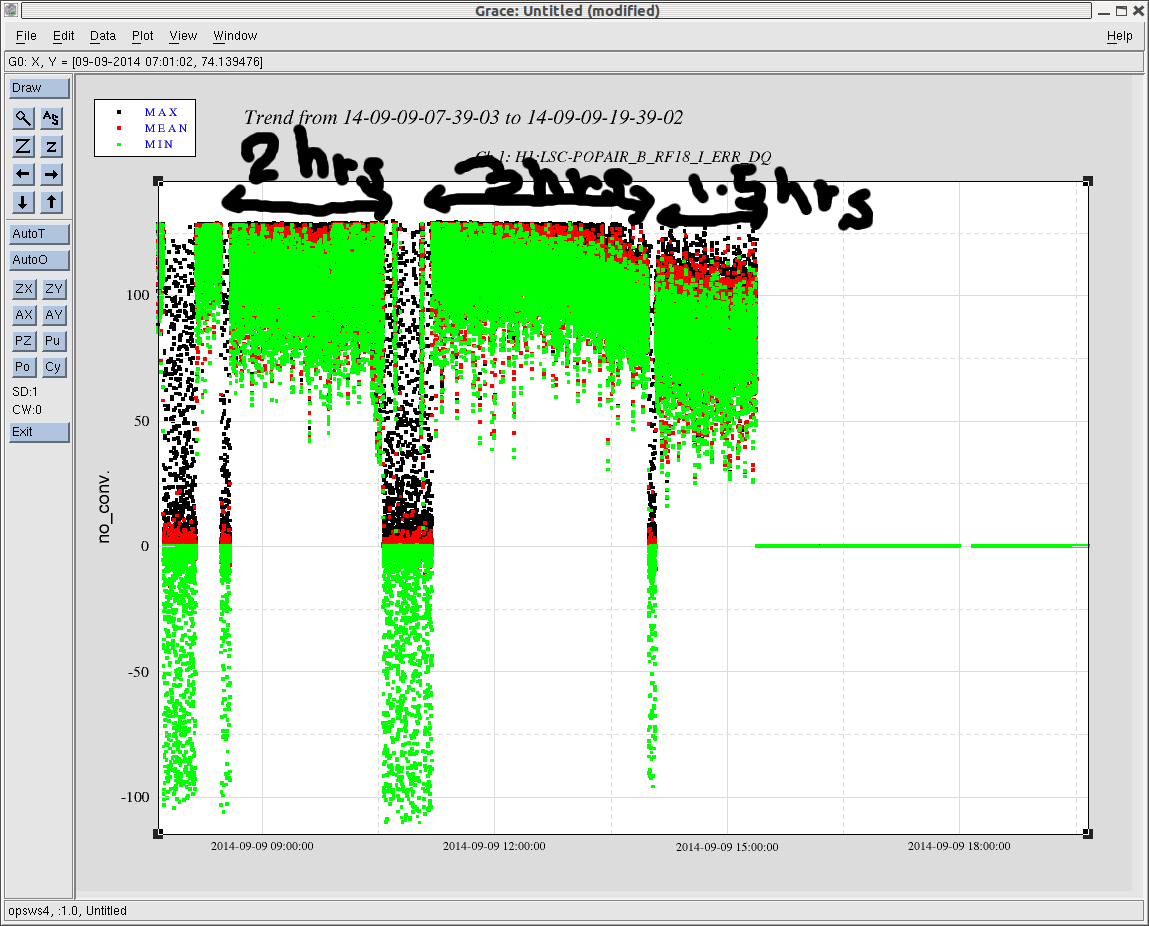
8:50 PSL Check ok. NOTE: ISS Diffracted Power is low (1.4%) and unstable with peaks over 20%. It should be 5-15%) 9:00-12:00 Going to End X to do cabling – Luis/Filiberto 10:00-12:00 Baffle work (disassembling contaminated scrapple baffle, searching for parts for arm cavity installation, and general cleanup) in LVEA West bay – Mitchell 11:01-11:03 DAQ restart – Dave 11:10-11:45 heading into the LVEA to get parts – Gerardo 12:12-12:15 Change h1iopsusey model to remove the DC OSEM component from the software watchdog – Dave 14:15-15:51 PCAL assembly on H2 PSL – Joe 14:22- Taking some parts to End Y – Corey 15:02-15:50 Back into the LVEA West bay (Searching and organizing Baffle parts – Mitchell 15:59 DAQ restart - Dave NOTE: I noticed that the ISS Diffracted Power has been unstable today. It was about 1.4% in the morning with high peaks over 20% during the day (is this normal?). Based on one of the PSL trainings it should be 5-15%. I have added some pics from today and one from the last 5 days.
We could not close the ISO loops on HAM4-ISI yesterday, even thought those are Level 1 generic loops. We ran transfer functions overnight, which allowed me to tweak the symmetrization filters. I also corrected a few minor typos in the unit-specific scripts.
ISO Lv1 loops are now stable with any of the 4x blend filters installed:
I duplicated ISO Lv1 into the filter modules reserved to Lv2 and Lv3. Those use more that one filter bank. I filled the extra filter banks with gains of one. Same goes for the Boost filters. Those only use 1x filter module though.
Here is what is loaded in the ISO filter banks:
I tried turning on different combination of ISO and DAMP with the control scripts. They all worked. HAM4-ISI good to go as far as starting Guardian testing goes!
Results of my visit to LHO this week for system identification of the ETMY. MOTIVATION: Make better models for each particular suspension to aid control design and noise predictions. The measured frequencies of the resonances are the most reliable data we have because they are not subject to errors in the sensors or actuators. There are also numerous resonances available for measurement, which can be used to adjust the model. SETUP: Resonance measurements were collected on ETMY main chain while on the test stand in the follow configuration with the following methods: * full quad - top mass to top mass transfer functions using the OSEMs. This data was measured prior to my visit this week. * triple hang - with the main chain top mass, reaction chain UIM and PUM masses locked on stops, spectra of the lower three main chain stages were measured with the UIM and PUM OSEMs and an optical lever on the test mass. No excitation is needed since the wind from the fans is more than enough. The process of locking the masses also misaligns the UIM and PUM OSEMs sufficiently that they are sensitive to vertical, roll, and transverse displacements of the stages. This allows us to measure more resonances with these OSEMs then we otherwise would. The optical lever isn't sensitive to any resonances the OSEMs miss, but it does add redundancy to help identify a forest of high Q pendulum resonances from spectra that include a lot of similarly shaped artifacts. * double hang - with the main chain UIM and reaction chain PUM locked on stops, spectra of the main chain lower two stages were measured with the PUM OSEMs. In this case the optical lever would not stay in range, so the data is just the 4 PUM OSEMs. * single hang - with the PUM on the teflon line stops, the test mass modes were measured with optically. This data was measured prior to my visit. SUMMARY: The data encompasses 56 resonance frequencies: 22 free quad, 16 triple hang, 12 double hang, and 6 single hang. See the attached plots and the summary of parameter changes below. In the attachment the black curves are the measured data, the blue the original model, and the red the new model. Pages 1-6 of the attachement show the diagonal top mass to top mass transfer functions. Pages 7-8 show L-P coupling and 9-10 T-R coupling. 11-13 are the frequencies of the triple, double, and single hangs respectively. 14 plots the mode frequency percent errors before the fit and 15 shows the same after the fit. The final page shows the convergence of the total error, where the error is calculated as sum( [(measure mode - modeled mode)/(measured mode)]^2 ) The algorithm for fitting the data is Gauss-Newton, an approximation of Newton's method. The fitting code is on the svn at .../sus/trunk/QUAD/Common/MatlabTools/QuadModel_Fit/QuadPend_QuassNewton_fit_v2_H1ETMY.m. Change in parameters from original model with the estimated convergence errors: --------------------------------------- Inx (top mass roll inertia) : -1.0926 +- 2.6994 % Iny (top mass pitch inertia) : 3.1636 +- 3.4396 % Inz (top mass yaw inertia) : -0.86123 +- 0.65824 % I1x (UIM roll inertia) : 3.9571 +- 0.77982 % I1y (UIM pitch inertia) : 12.2729 +- 2.5078 % I1z (UIM yaw inertia) : -0.10972 +- 0.55984 % I2x (PUM roll inertia) : -2.9587 +- 0.85205 % I2y (PUM pitch inertia) : 8.4597 +- 0.6904 % I2z (PUM yaw inertia) : 0.011768 +- 0.3983 % I3x (test mass roll inertia) : 2.2009 +- 0.77109 % I3y (test mass pitch inertia) : -8.8738 +- 0.79819 % I3z (test mass yaw inertia) : 0.44122 +- 0.5629 % l2 (PUM wire loop length) : 8.6866 +- 1.1464 mm l3 (fiber length) : 22.1269 +- 2.6176 mm kcn (top stage spring stiffness) : 1.0719 +- 2.166 % kc1 (top mass spring stiffness) : 1.0935 +- 0.68178 % kc2 (UIM spring stiffness) : 2.2795 +- 0.39067 % kw3 (fiber bounce stiffness) : 9.4286 +- 0.4488 % dn (top mass blade tip height) : -0.20928 +- 0.303 mm d1 (UIM blade tip height) : 1.8131 +- 0.56431 mm d4 (effective fiber flexure at test mass): -4.8356 +- 0.23685 mm --------------------------------------- DISCUSSION: The fit of the original model was fairly descent already, except for pitch. The fit of the new model to this data is even better, especially for pitch. The worst mode frequency error decreases from 8.2% to 1.3%. Interestingly, even though only resonance frequencies were included in the fit, the shapes of the transfer functions (including zeros) all match well also. This goes for the cross coupling measurements as well. Note, the length to pitch measurement does not match the pitch to length. These should in theory be identical. Mismatches indicate measurement problems. Length to pitch has some low frequency notches that don't exist in pitch to length. Judging by the models (both before and after), I think it is likely that pitch to length is the more accurate measurement up to 4 Hz. I don't think we can believe either beyond 4 Hz. After the fit, the worst error in mode frequency corresponds to the first roll mode for both the free quad case and the triple hang case. The inclusion of the extra resonance frequencies made a huge difference in the ability of the model to converge. In this case, a total of 21 parameters were floated. Normally, only a few at a time can be floated using just top mass data. Many of the parameter changes produced by the fitting code seem quite reasonable. Some that are beyond what you would expect are the lengths of the fibers and the PUM wire loop. These changed by 22 mm and almost 9 mm respectively. Since the mass values are known, the only way to fit all 10 measured longitudinal modes is to adjust the wire lengths. This was achievable by floating both these wire/fiber lengths. I noticed that the default value in the original model for the PUM wire loop has the following comment: "% wire hang value - Mark Barton, 11/22/2011". I wonder if the entered value is no longer correct since the quad is not in the 'wire hang' configuration anymore. Regarding the fibers, the effective flexure length is rather complicated due to the geometry of the fibers. Perhaps some other error, like in fiber radius can mimic this. Note, the bounce mode stiffness moved by 9%. The d4 change is also large. It is very likely this value is not physical because this parameter has significant degeneracy with both d3 and d2. Thus, the decrease of 5 mm could be spread out between all 3. d2 also has twice the sensitivity, so a small shift there can take up a fair bit of this 5 mm on its own. These degeneracies prevent the fitting code from floating these parameters simultaneously, so you simple have to pick one. d2 is sort of awkward because it is degenerate enough that it is difficult to float with either d3 or d4, but different enough that floating it instead of d3 or d4 yields different results. DISCLAIMER: As usual, the choice of parameters to float was made by experience and intuition. These parameter changes are not necessarily representative of reality. Though, with a fit that matches all 56 measurements to the 1% level, you might start to think that this thing is converging within some distance of reality. COMPARISON WITH FUTURE MEASUREMENTS: We should see how this new model holds up against L-P measurements at other stages and between stages. NOTES: The high frequency vertical and bounce modes were visible on the single hang and double hang measurements, but not the triple and free quad. If they were visible in all there would be 60 measured resonances. However, these modes are virtually the same from double hang to triple hang to free quad because they involve primarily displacement between the bottom two masses. Thus, the loss of information is negligible. In fact, we might be better off not including these extra bounce modes in case they emphasize bottom mass parameters over the upper masses since the same information would essentially be repeated 3 times.
I found a typo in the model fitting code that explains the change in the fiber length. In the code the nominal d3 and d4 values, each 10 mm, were subtracted from the fiber length. The fitting code, doing what it is supposed to do, detected that the fiber length was incorrect and added 22 mm to compensate. The 2 mm difference is in the noise since the fiber length has a weak influence on the dynamics at the mm level. Note that the code did output a +-2.6 mm error bar for this fiber length change. I'll take this as good news that the fitting code works. The model fitting code has been updated on the svn with the bug fix. The new parameter file is on the svn at: /ligo/svncommon/SusSVN/sus/trunk/QUAD/Common/MatlabTools/QuadModel_Production/quadopt_fiber_H1ETMY.m
The following attachment shows that the new model is also a good match for L1ETMY.
A new alog entry at https://alog.ligo-wa.caltech.edu/aLOG/index.php?callRep=10476 discusses the calculation of the UIM-PUM wire length required from the model based on the wire jig document and PUM drawings. These documents bring the wire length much closer to what the model fitting code found.