Alexa, Sheila, Keita
We had a look at the ETMY length 2 angle coupling this morning.
L1 Stage:
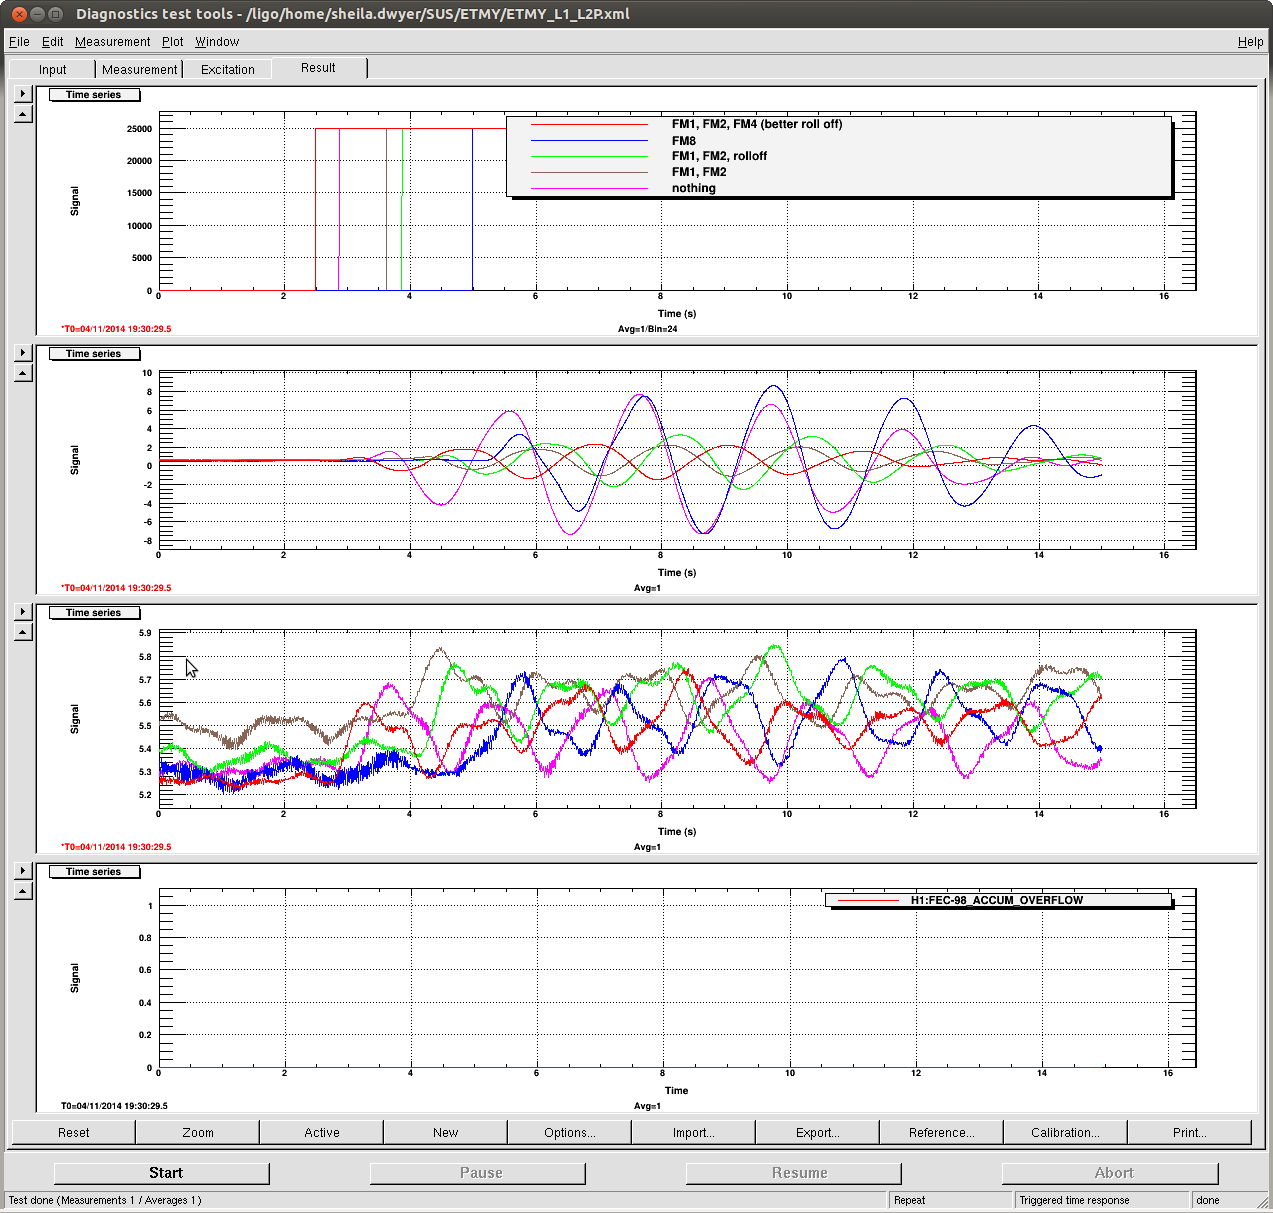
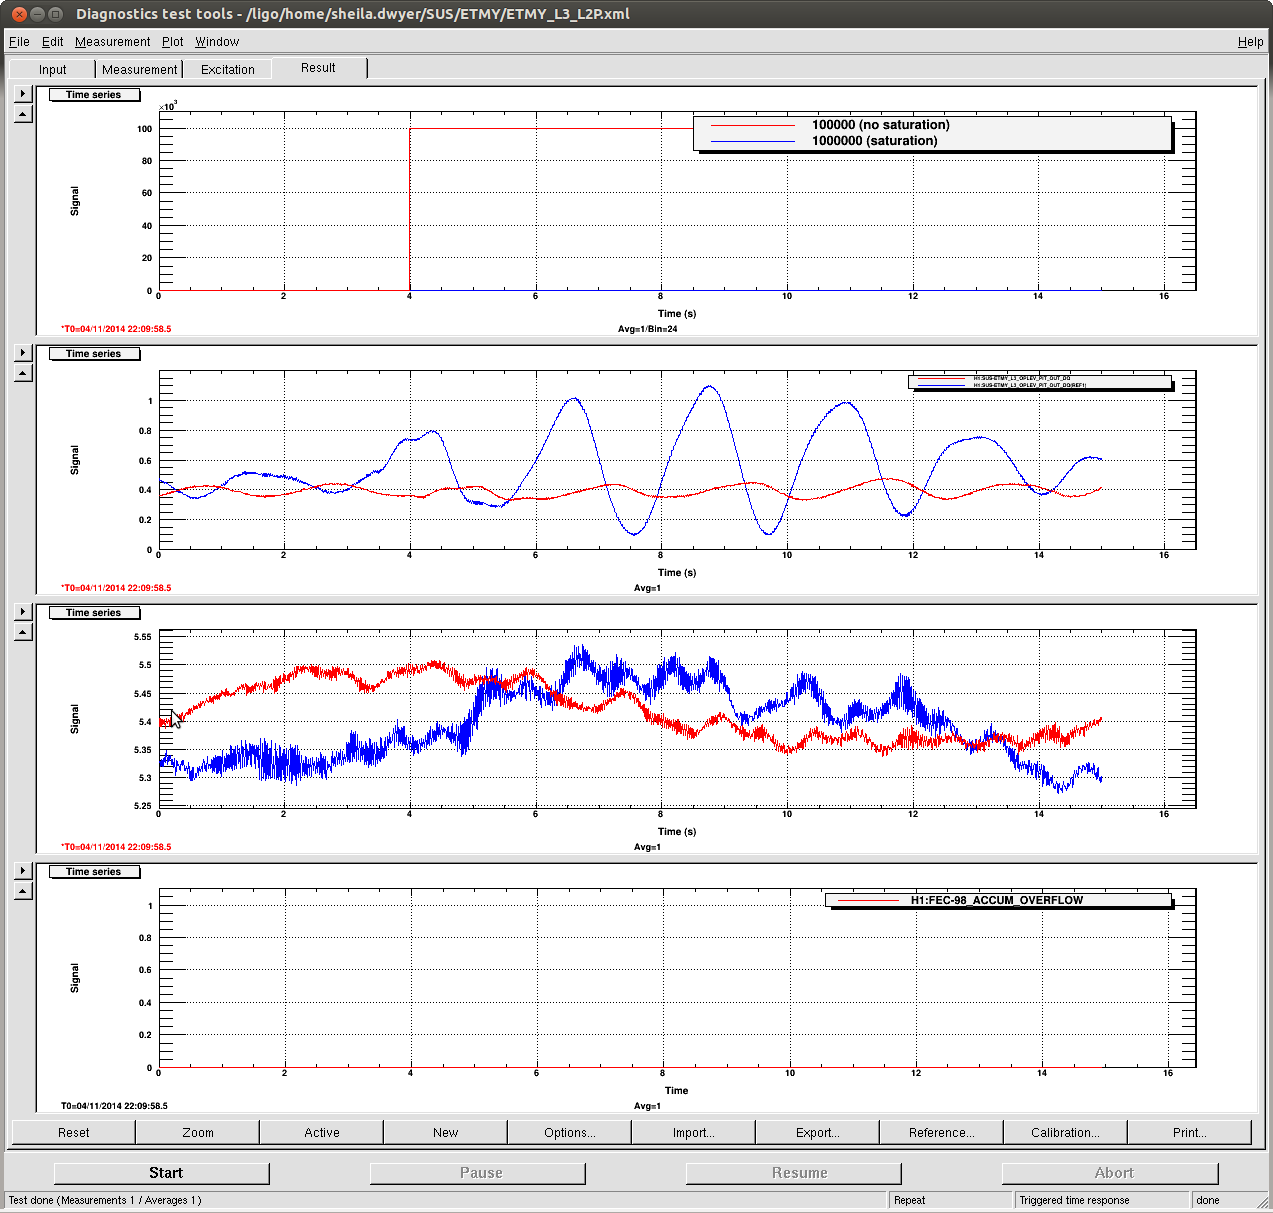
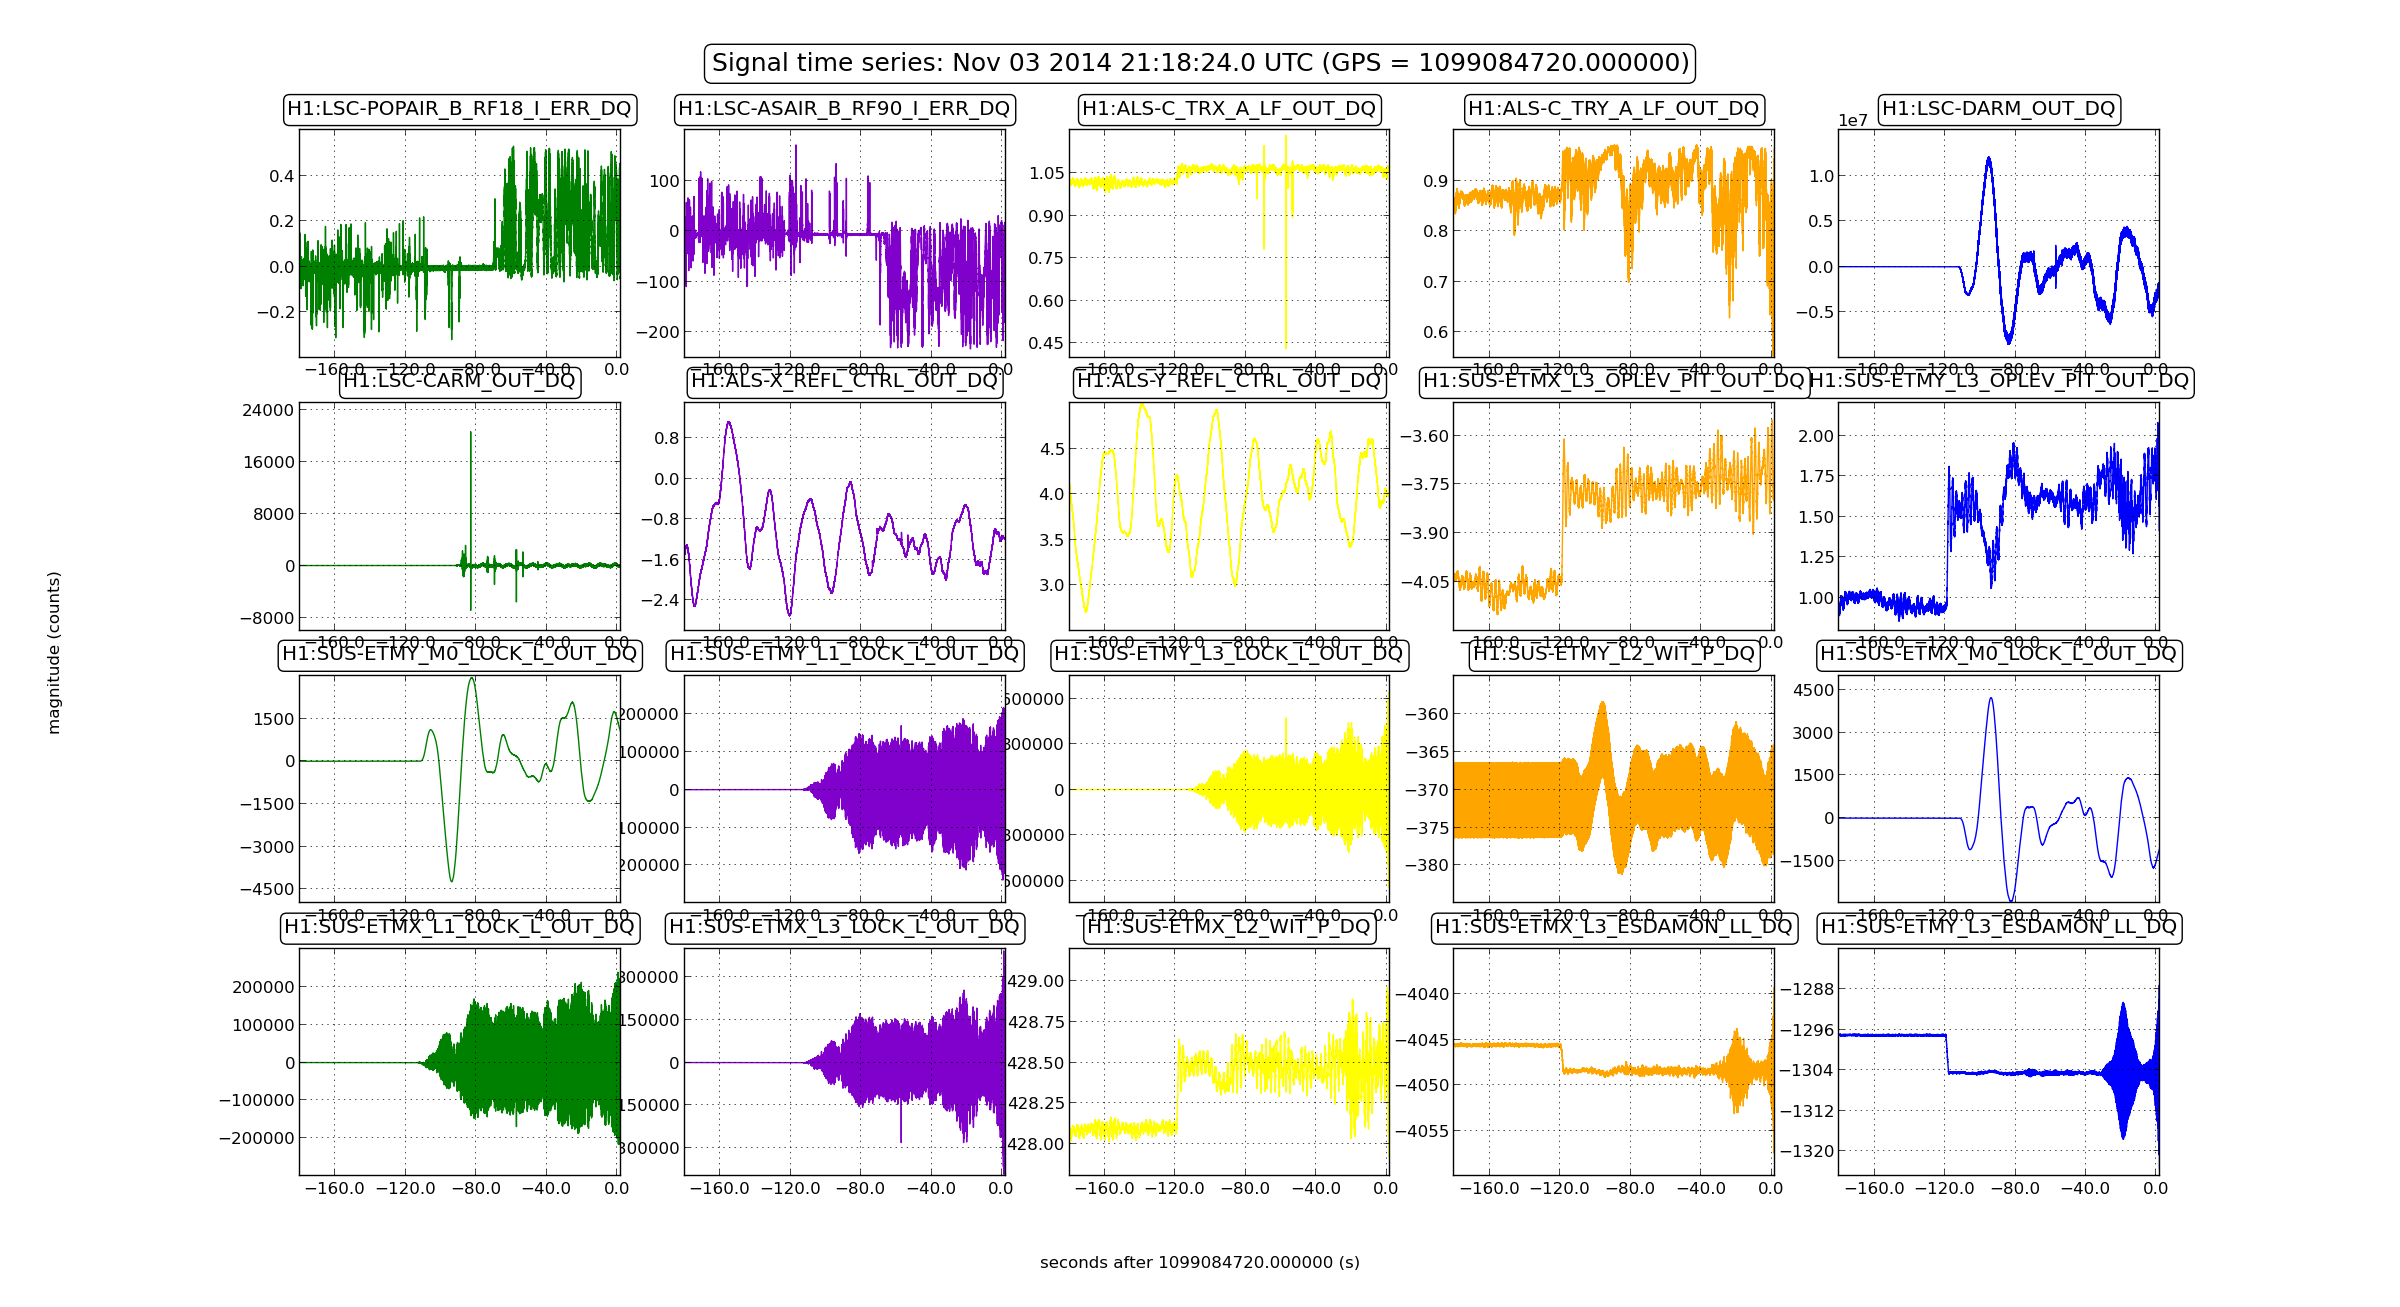
We started with L1, Alexa first measured the response of the oplevs to a length drive at a single low frqeuency (0.1 Hz, 500000 amp) and high frequency (5.47Hz, 2000 amp). She drove at L1_LOCK_L with the nominal filters engaged. Meanwhile in the drive align matrix the P2P filters were left on, but the L2P filters were turned off. She found that the gains of the existing filters at low and high frequencies seemed OK. Then we had a look at the impulse response, which is the first screen shot attached. For the impulse response we turned off all the LOCK_L filters.
The pink trace is with no L2P at all, while the blue trace is FM8 that we installed (alog 14323), which was clearly not very good. The FM1, FM2 filters are much better, which is something Arnuad had configured in alog 11832. The roll off FM3 was added to reduce DAC saturation. Keita also created a better roll off (FM4), which rolls of closer to 40Hz instead of ~1Hz, and falls off more steeply. For reference the new FM4 filter is ellip("LowPass", 5, 0.2, 40, 30). The difference is sort of minimal, but we will leave that as our new configuration. The gain of this new configuration at 0.01Hz and 4.57Hz is still ok based on Alexa's measurement.
M0 Stage:
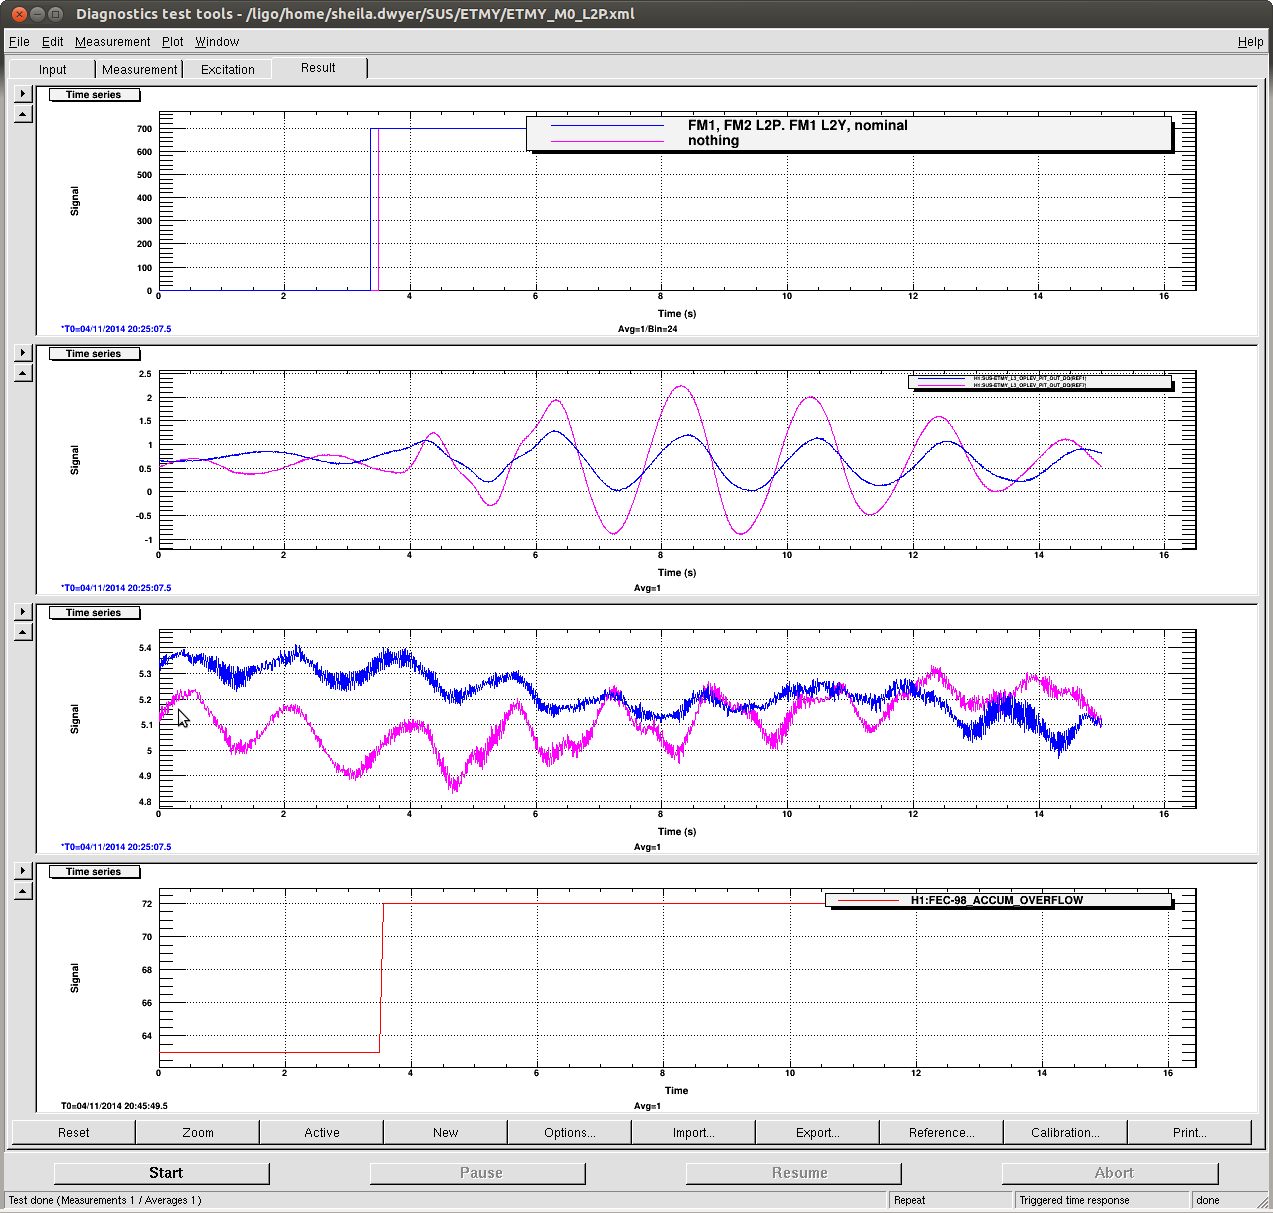
We then looked at M0 stage. Alexa drove M0_LOCK_L at 0.01Hz, 50,000 amp with the nominal filters on. The drive align matrix had P2P left on, but the L2P filters turned off. A better gain would be 0.05, the gain for the filters enaged was closer to 0 for this. There was no coherence at high frequency. We then looked at the impulse reponse again, with the LOCK_L filters off. The second attachment shows the results.
Second attachement: The pink trace shows our nominal configuration (FM1, FM2 on for L2P and FM1 on for L2Y with a gain of -1). This was clearly better than with nothing on. We also tried various other configurations and the legacy filters, but these were significantly worse (and not worth plotting).
L3 Stage:
Finally, we took an impulse response of L3 stage. No filters have been comissioned for this stage, and the L 2 angle coupling probably changes with the ESD charge; however, we wanted to confirm there was no crazy impulse. Third attachement: The red trace has no DAC saturations and shows that the impulse response is rather small, which is good.
Conclusion:
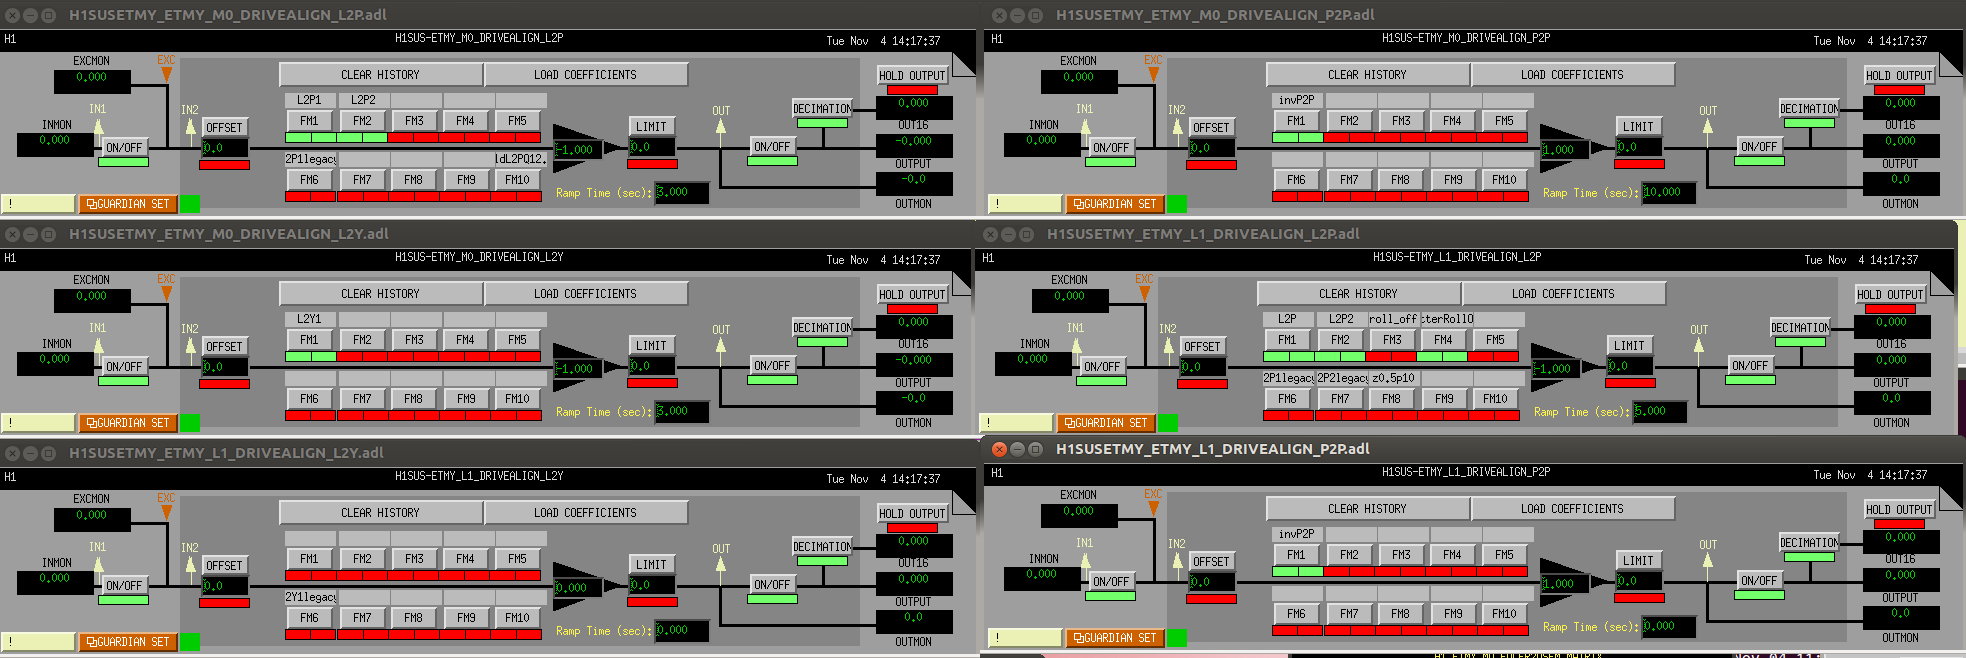
M0, L3 drive align matrices are left as they are. We changed L2 L2P filters: FM1, FM2, FM4 ON and FM8 OFF, gain -1. See the fourth attachement for the final configuration.