We just turned off the CO2 laser. We had seen our contrast improve from 99.1% to 99.8% (after about 7 hours at 192 mW CO2 power), and finally after about 19 hours we measured the contrast at 99.6%. Dan has also measured the OMC mode matching, which seems to have gotten worse for ITMX (measured around 17 hours). In the few minutes since we turned it off, the contrast has improved again.
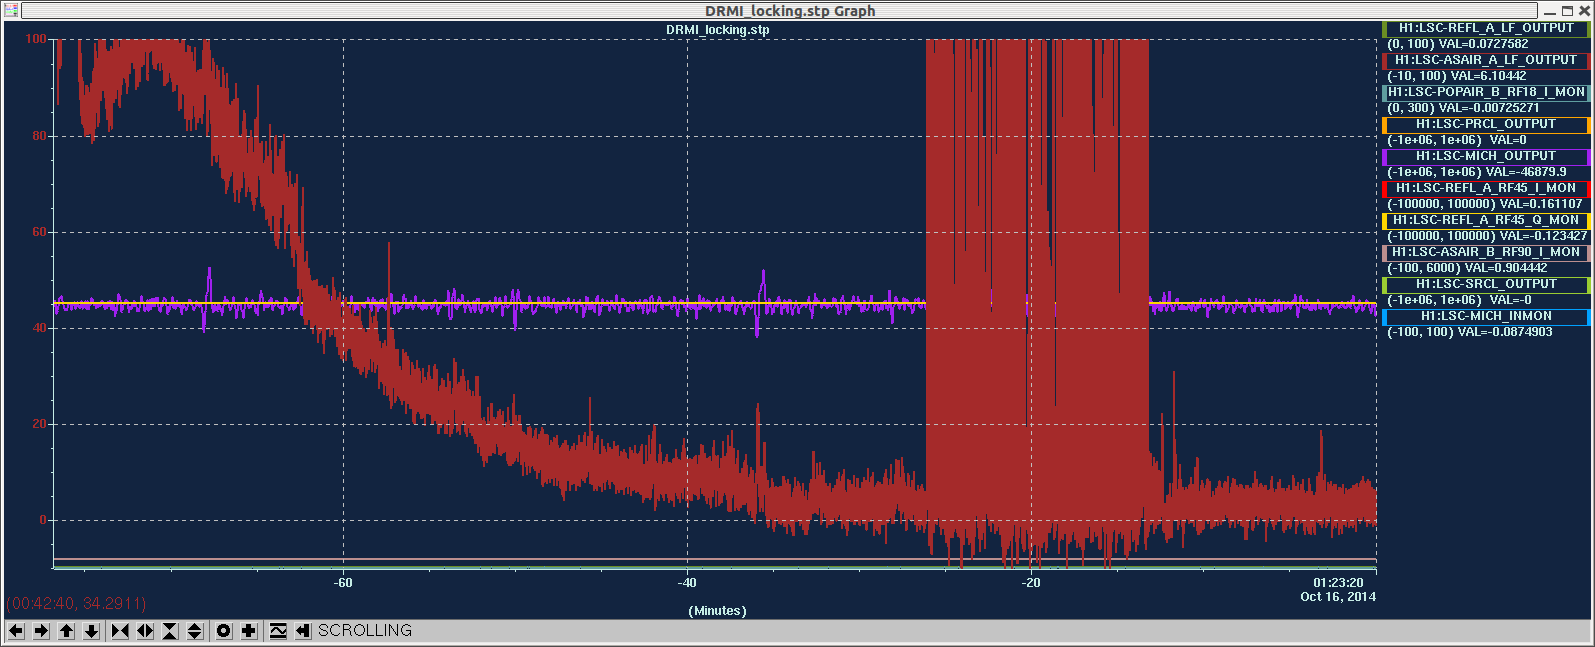
Today we have had considerable difficulty locking DRMI, beause of the mode hopping problems. There are many examples of short locks where the mode hopping seems to have killed the lock, some times are (all UTC, october 16th) 23:50, 23:23:50, 22:48, 22:26:27, 22:10, 20:44:20, 20:41:30, 20:36:04 and 20:34.....
Our difficulty today may or may not have been related to the TCS, it may just have been that our alingment was bad. We did have 2 longer locks, each about 20 minutes.
We decided to try locking PRMI, to see if we could get a better handle on alignment. I edited the PRMI guardian (in LSC configs) so now it is using the refl air PDs, and the gains are correct now that we are using the power scaling. (110 for MICH, 22 for PRCL) The distressing news is that now PRMI has a similar mode hopping behavoir to what we see in DRMI.
The first attached screen shot shows the way that our as camera has looked when mich was on a dark fringe most of the day today. The second one shows it about 7 minutes after we turned the laser off.


To sumarize the TCS story,
we turned on the CO2 laser for about 40 minutes at 1 Watt, realized we had overshot with the power, turned it off for about a half hour, durring which time our contrast improved. We then turned the laser on with about 0.15 Watt (according to Greg's rotation stage calibration) or 0.19 Watt (according to Alistair's power meter calibration). This should have been approximately right, and indeed after about 7 hours of this it seemed like our contrast had improved (from 99.1% with no TCS) to 99.8%. After about 19 hours of TCS we measured the contrast again, and it was about 99.6%. Dan also measured the mode matching from ITMX to the OMC. (since ITMY has better mode matching than ITMX with no TCS, we expected that the mode matching would improve if the contrast was improved.) Dan measurent indicated that the mode matching had gotten worse. We turned off the TCS after about 20 hours. This morning (about 10 hours after turning it off) Keita and I measured the contrast again; we got 99.6%. It seems like there is a lot of variablility in our measurements of the contrast.
The attached screen shot is an image of the as port with mich locked on the dark fringe, after TCS had been off 10 hours or so. This is what it normally looks like, for comparison to the pictures above.
The conculsion is that we don't really understand what happened when we turned on the TCS, and we are going to wait until we have hartmann sensors and a calibration to try it again.


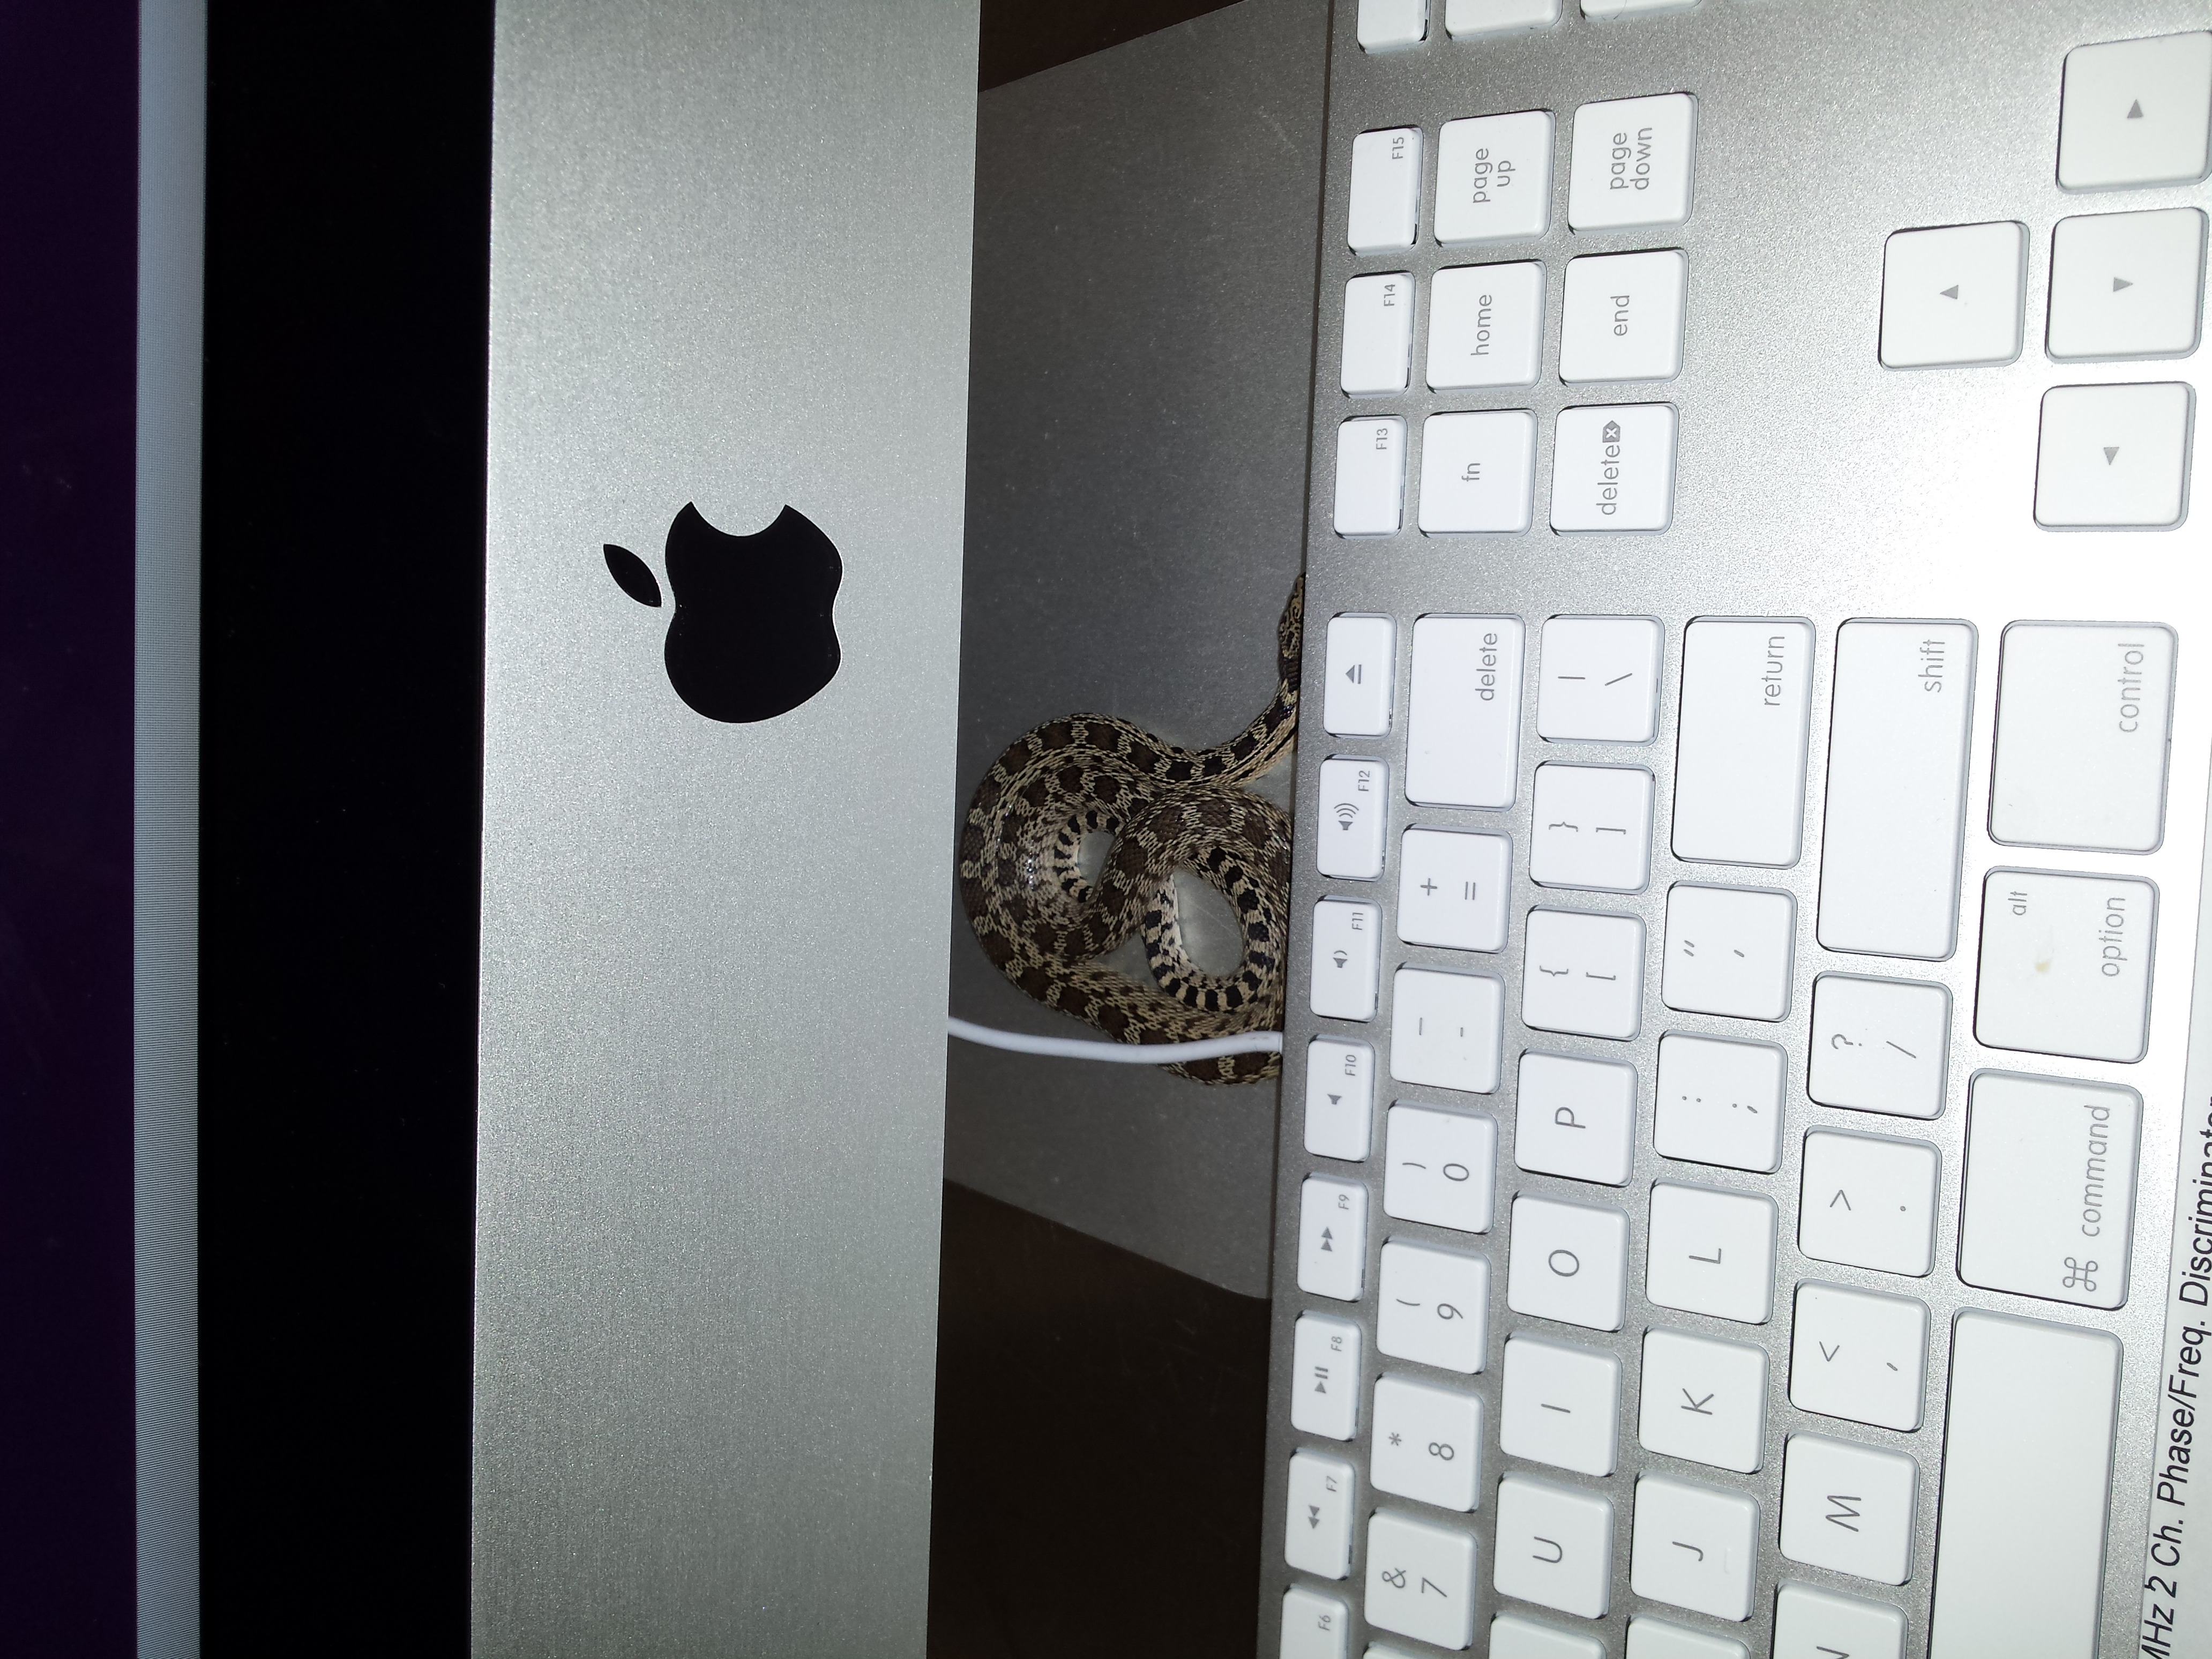
 I did not notice the snake!