Aleaxa, Kiwamu, Jenne, Sheila
- We turned on the ITMX oplev servo because we saw an oscialltion at 0.55 Hz by 2 urad pp (with sensor correction off)
- We need to install the 45 MHz amplifier to get reasonable signals for 3F.
We worked on DRMI tonight, it is locking at 1Watt within a few minutes. We are using gains of 22 for PRCL, 40 for MICH, and -400 for SRCL. We are using the PSL-POWER_SCALE_OFFSET, so the gain settings and trigger settings in the gaurdian are now set for 1 Watt input power, but we could scale them to 10 Watts. We have been locking sometimes without the 27 Hz notches in M2 of PRM and SRM, and munually turning them on after it locks (this is needed to prevent the suspensions from ringing up). We are using the guardian for everything else, including the offloading to M2.
We started to measure the relative gains between 1F and 3F ( we think we need a gain of 3.2 in the input matrix to swtich PRCL to REFL 27 I) but quickly realized that we don' t have enough signal in REFL 135. It seems like we need our 45 MHz amplifier installed before we can move on to 3 F.
Times that DRMI was locked:
3:25 UTC october 1st - 4:21 UTC
5:10 UTC (maybe a few minutes earlier). This is still locked, Kiwamu is now scanning the OMC.
To do list:
- slow offloading to etms to help diff locking
- 3 f with amplifier
- as wfs
When the DRMI was locked, I scanned the OMC in order to doublecheck that we were on the right operating point by looking at the upper and lower 45 MHz sidebands.
It looks we are on the right operating points -- both upper and lower 45 MHz are equally prominent while the carrier and 9 MHz sidebands are suppressed at the dark port. Good.
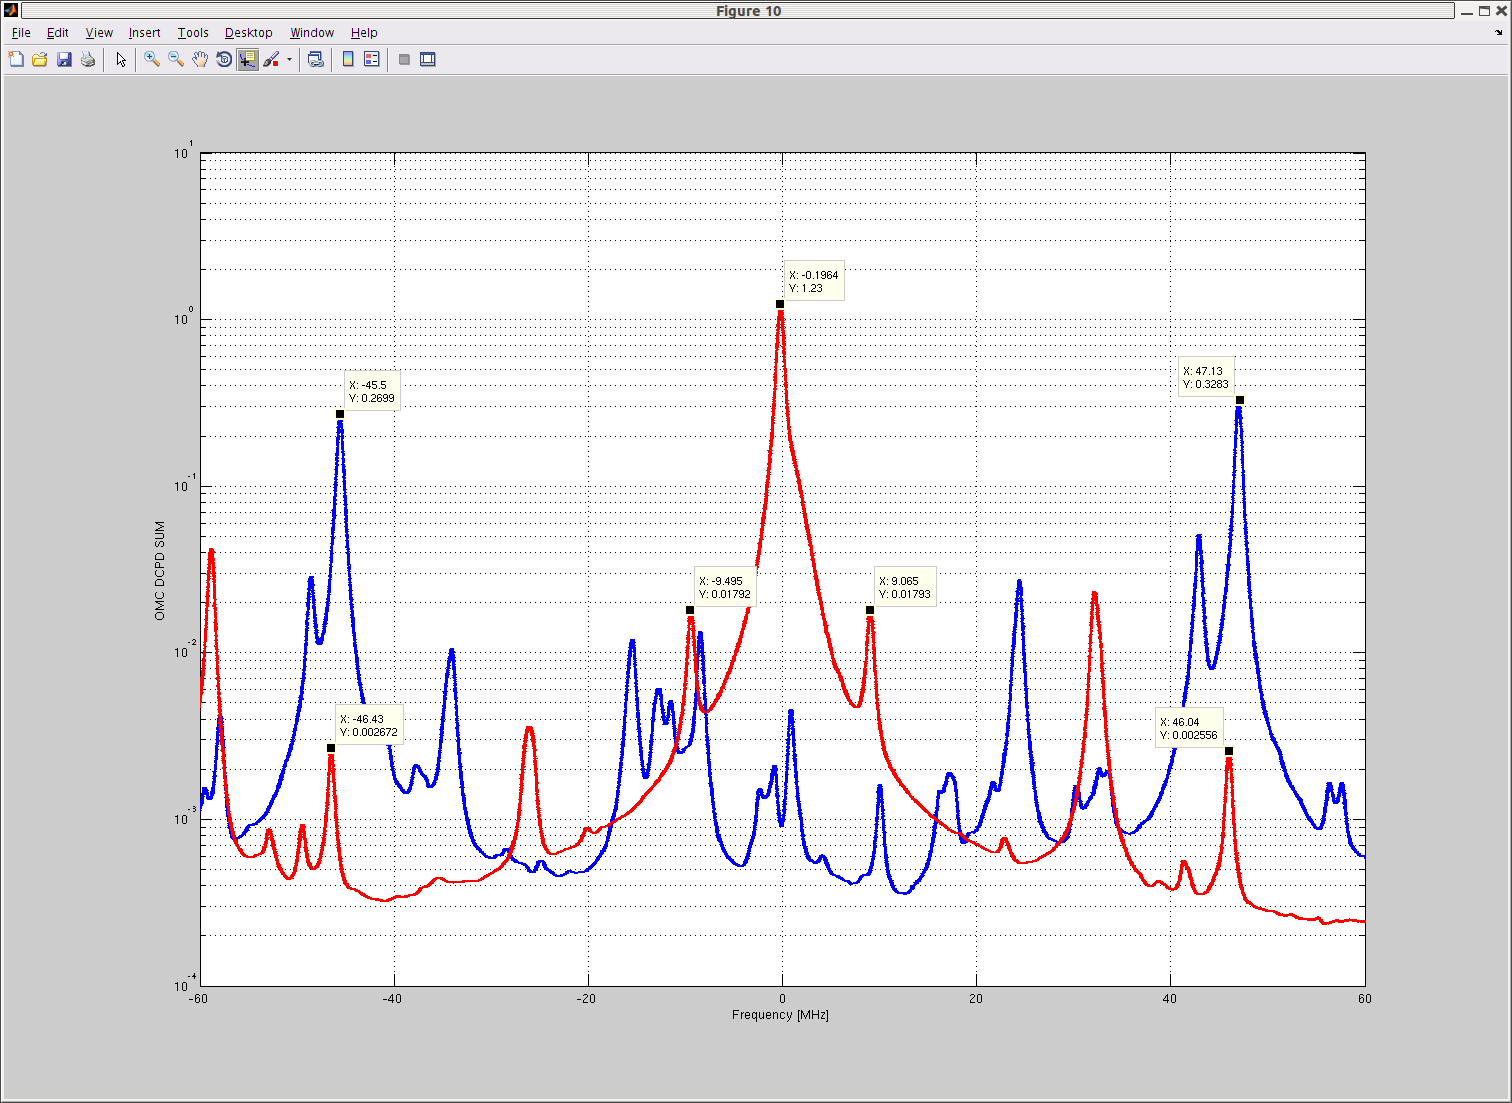
The attached is a plot of the OMC scan. The x axis is converted into MHz of the laser frequency by using carrier's and 9MHz sideband's peak locations. This coarse calibration is done by using another set of data taken at the time when I had a single bounce beam. (Note that I did the single bounce measurement right after I measured the DRMI scan by intentionally unlocking the DRMI for this purpose). The red curve represents that with the single bounce beam and the blue is the one with the DRMI locked. In adittion to the calibration of the x-axis, I was watching the OMC trans camera and I knew that the highest peaks in the blue curve are all 00-modes.
As shown in the plot, both upper and lower 45 MHz sidebands are prominent when the DRMI is locked and there is no significant imbalance in their amplitudes. So we locked the DRMI on a right operating point.
Also, as shown in the red curve, the modulation depth at 45 MHz is low and consistent with that measured by Dan a couple of days ago (alog 14196).
Also we noticed that SRCL was still hopping. Tonight it was pretty clear that the hopping was induced by angular fluctuations in MICH. By using the ITMX oplev loop in pitch, we could reduce the number of hoppings.
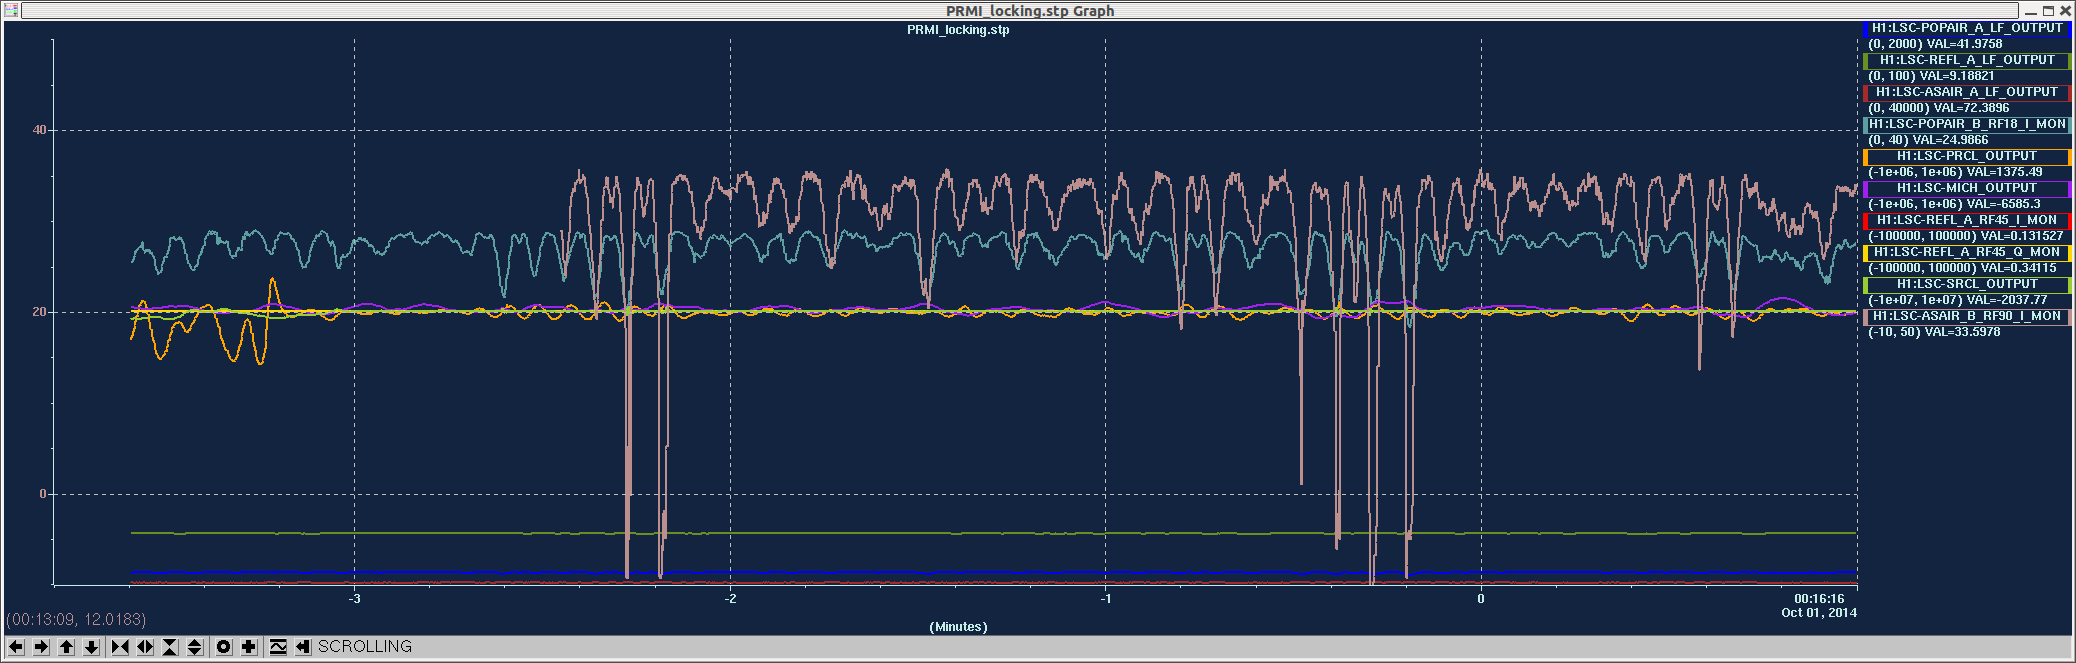
Currently it seems to be dominated by horizontal motion of some optics which we could not identify by looking at the oplev signals. The attached is time series of PRC and SRC buildup, observed by POPAIR_RF18 and ASAIR_RF90. When ASAIR_RF90 goes down, SRC tends to hop to the other mode (or perhaps it is just a short glitch and there is no stable mode). Also, it is visible in the screenshot that the PRC and SRC build up fluctuate in a coherent way.