aidan.brooks@LIGO.ORG - posted 11:58, Friday 26 September 2014 (14172)
H1 HWSX measured RH thermal lens
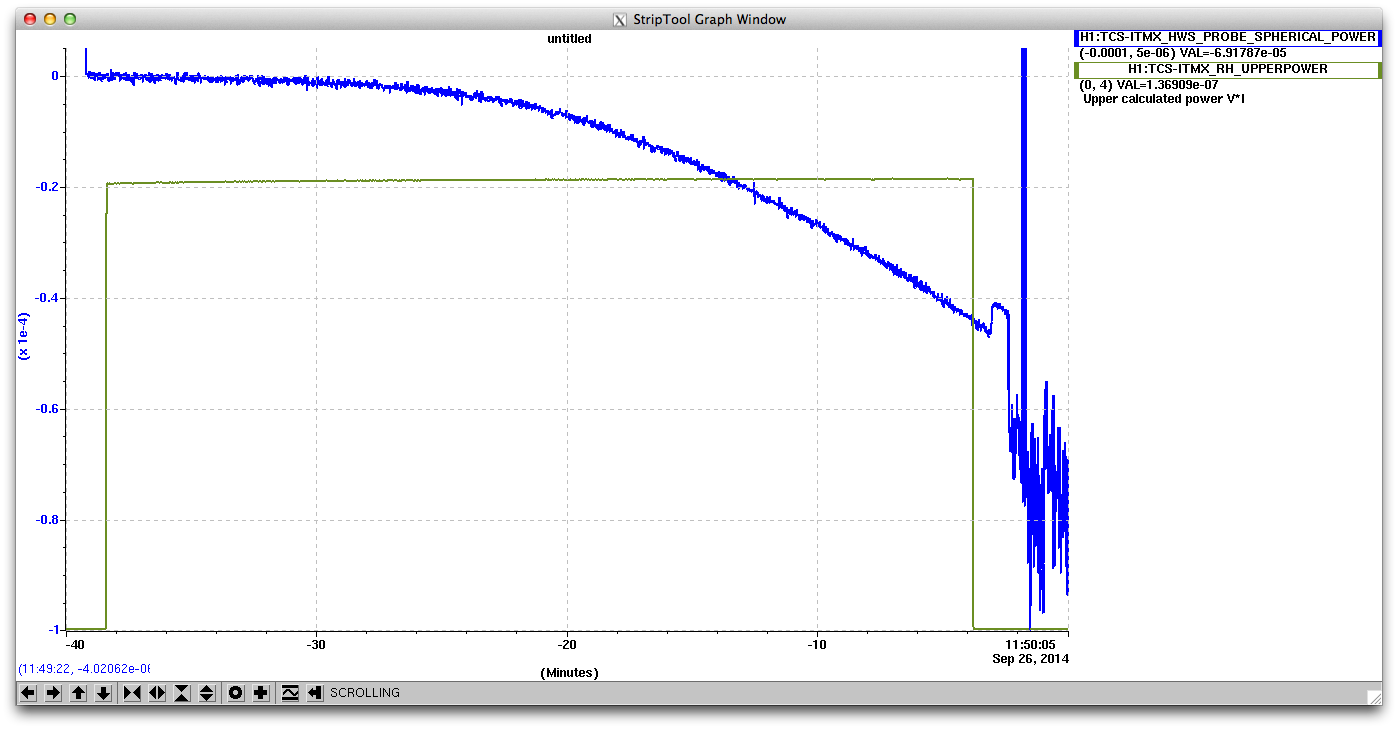
The Hartmann sensor on ITMX measured the RH thermal lens in ITMX when 6W was applied to the RH. I'm satisified that it is installed correctly.
We need to install a beam tube between the viewport and the HWS table so, currently, the LEXAN cover is installed over the viewport (it was removed for the RH test).
The attached plot shows the measured HWS spherical power when 6W of RH power is applied. A negative lens starts to form about 10 minutes after the heater is first turned on - as expected. I turned the heater off after 35 minutes or so as this was all that was necessary to confirm that the sensor is working. Just after I turned off the RH, I replaced the LEXAN cover on the viewport (this is why the signal goes haywire).
Images attached to this report