J. Kissel
Executive Summary:
(1) I believe we DO NOT need to manually alleviate the alignment on the IMs, but it's close.
(2) Assuming a worst-case scenario, IM2 would use up ~80% of it range to maintain alignment.
(3) The alignment slider calibration I recommend we use is:
P: 0.21 +/- 0.015 [urad/ct]
Y: 0.39 +/- 0.009 [urad/ct]
(4) Calculating the calibration from from a model of the signal chain fails; there's still unknowns in the signal chain that add up to discrepancies of 2 and 4 for P & Y.
(5) Given the EUL2OSEM gain, and the usage of the same actuators for P & Y, the actuators can drive 2.96 [mrad] in P and 1.62 [mrad] in Y if alignment offset is needed in both DOFs.
(6) We would need to relieve 1 [mrad] of pitch, which is about at the limit of the mechanical alignment precision.
I have *not* installed the calibration gain. I'll do it tomorrow.
----------
During the last integrated testing stint, good alignment of IM2 and IM4 was believed to be at the limit of the DAC range of their OSEMs, given their actuation strength has now been decreased by ~10 (see LHO aLOGs 8767, 8759).
However, due the confusion of uncalibrated alignment sliders, artificial limitation of the slider range on the MEDM screen, 16-bit vs 18-bit DAC range, coil driver strength changes, computer reboots, electronics being swapped in and out, and a few vent cycles ... I think the saturation had been misreported.
Currently, the worst offending with the largest alignment bias request is IM2 with + ~81000 [ct] out of +/- 2^17 = 131072 [ct], or 61% of its range. I've confirmed with the OSEMs that the range of drive is still roughly +/- 6 [mrad] in P and Y, and the calibration of the slider counts into [urad] is
P: 0.21 +/- 0.015
Y: 0.39 +/- 0.009
where the uncertainty is the standard deviation across the four IMs. Unfortunately (and the reason why I just measured it), a component by component model of the calibration doesn't make any sense, even after using measured compliance values. More on that later.
So the questions are:
- Is +/- 6 [mrad] enough to cover the alignment change from in-air to in-vacuum? Yes. Data from prior to the vent and before installation attacked shows that the optics move by at *most* 1 [mrad], where the majority moved of order 100 [urad]. So, assuming IM2 moves the worst amount of distance (which this past vent shows it moved 148 and 174 [urad] in P & Y respectively) that's only an additional ~17% on top of 61%, or 78% (and the damping control signal variation on this is a negligible ~0.1%).
- Is it worth trying to mechanically alleviate the alignment for 78% and 2 [mrad]? We have no experience HAUX aligners on site for this remaining week in which we indeed to keep HAM2 open. The precision to which one can mechanically align the SUS is roughly 1 [mrad] (see section 2.1.1 of T1200469). Given Murphy's law, the lack of alignment references, the amount of stuff we've already changed in HAM2 with the IMC bypass, and the uncertainty which still swirls around the exact numbers and direction, I say it's a gamble not worth taking.
Below is a collection of information needed to assess how much the optics need moving.
I've surveyed the (1) alignment sliders, (2) OSEM sensor values, and (3) DAC output values over the past 30 days, to get a feel for how much we need to move. However, three events have occured that complicate the story:
(a) On 2014-June-04 16:21 UTC to 2014-June-04 23:13 UTC, Filiberto and Aaron swapped out / investigated AA and AI chassis of H1sush2b, so OSEM sensor signals went dead (no aLOGs, but Fil confirms that's when his work-permit for this swap was open via email).
(b) On 2014-Jun-12 17:21 UTC, a power glitch necessitated a restart of the h1sush2b computer (among many others). This reboot reloaded a save.snap value that must have been out of date, because IM4 P & Y alignment value changed by a few hundred counts (see below).
(c) On 2014-Jun-24 ~23:00 UTC (+/- 15 [minutes]), the alignment was modified in order to accommodate the IMC bypass.
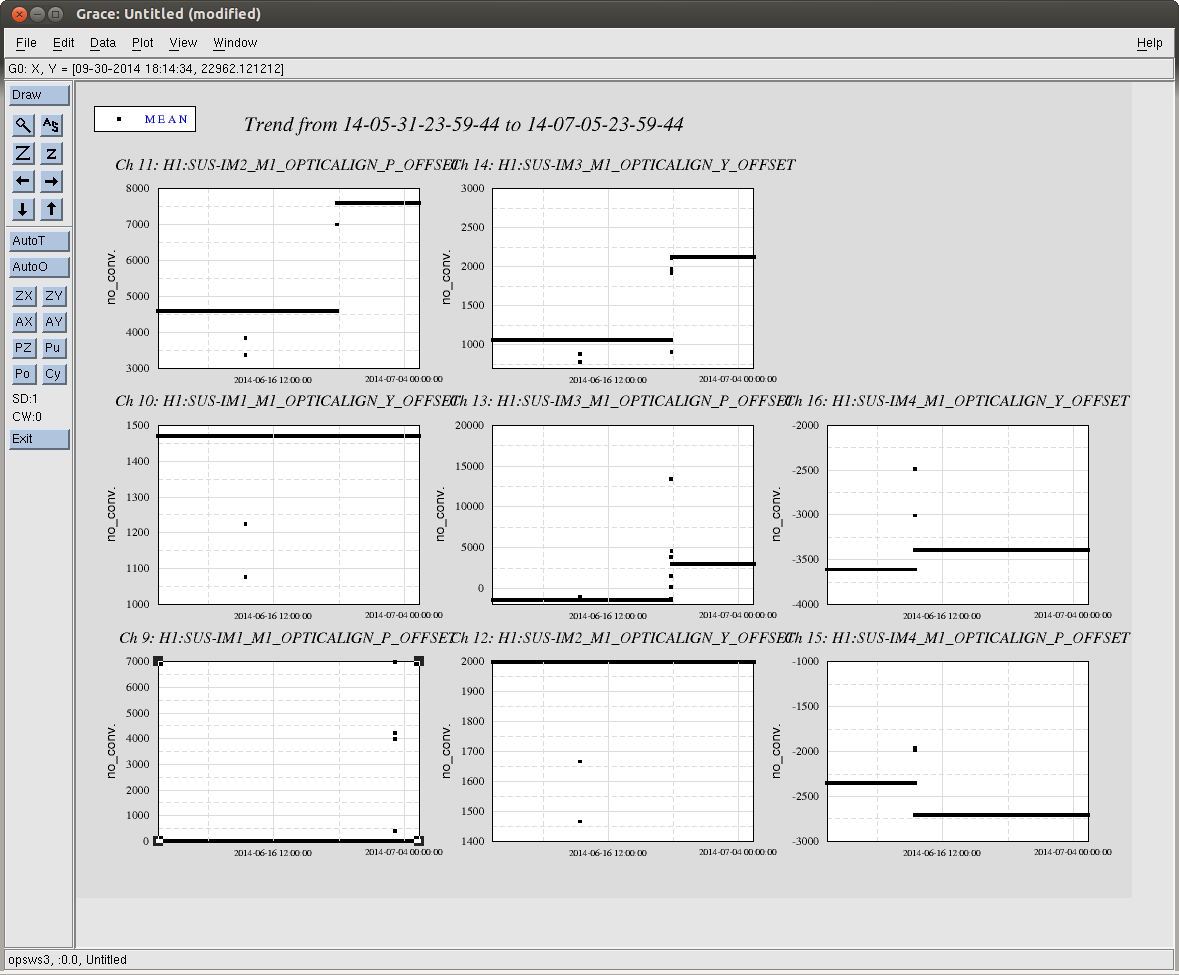
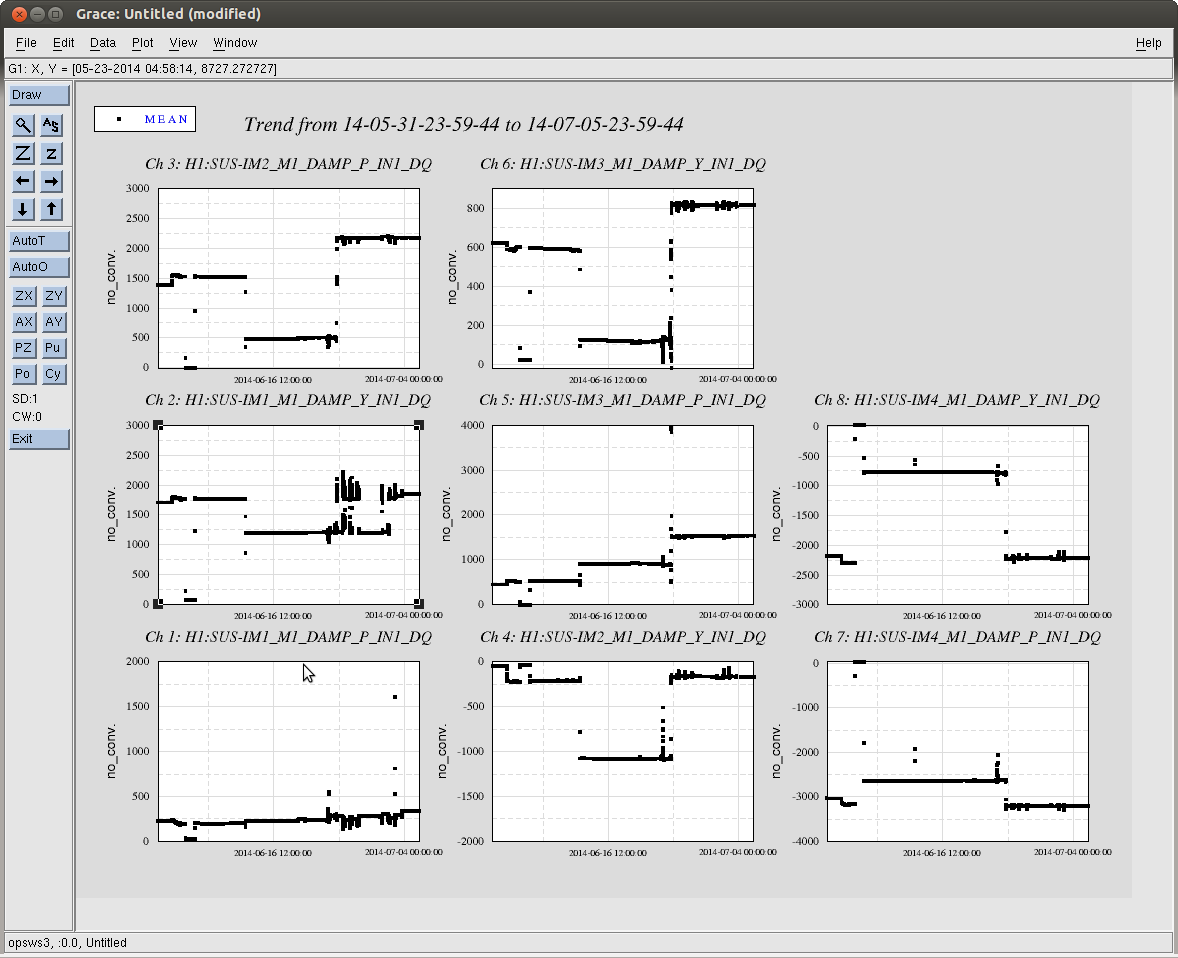
"IM2_P_35DayTimeline.pdf" shows this timeline on IM2 P only for clarity, but "OSEMPosition_2014-06-01_to_2014-07-04.png" shows that all 8 DOFs show similar features over the 35 day period.
(1) OSEM sensor values, before the vent (Jun 1), after the vent, once the alignment had asymptotically stabilized just before the (a) AA/AI chassis shutdown on the Jun 4, and after the alignment had been left alone from the IMC bypass during the 4th of July weekend:
% Pre-vent P Y
osems(1).disp = [ 225.0 1709.5;... % [urad] IM1
1380.6 -45.5;... % [urad] IM2
447.6 620.0;... % [urad] IM3
-3034.0 -2174.8]; % [urad] IM4
% Post-vent P Y
osems(2).disp = [ 195.7 1772.9;... % [urad] IM1
1528.8 -220.2;... % [urad] IM2
511.8 599.3;... % [urad] IM3
-3167.0 -2302.0]; % [urad] IM4
% Post-IMC Bypass P Y
osems(3).disp = [ 335.0 1851.0;... % IM1
2179.0 165.0;... % IM2
1522.0 816.0;... % IM3
-3201.0 -2212.0]; % IM4
% P Y
diff = -29.3 63.4 % [urad] IM1
148.2 -174.7 % [urad] IM2
64.2 -20.7 % [urad] IM3
-133 -127.2 % [urad] IM4
(2) Alignment slider values, before vent and after their change from (c) above. These slider values *have* not been calibrated into physical units, as the alignment bias gain is 1. The only P&Y gain between the sliders and the DAC are the EUL2OSEM matrices compensating for the lever arm, which have a gain of +/- 8.594.
Optic DOF Pre-vent After Glitch After Realignment Diff [ct]
IM1 P 0.0 (same) (same) n/a
Y 1469.0 (same) (same) n/a
IM2 P 4600.0 (same) 7600.0 +3000
Y 2000.0 (same) (same) n/a
IM3 P -1397.9 (same) 2980.0 +4377
Y 1060.8 (same) 2120.0 +1060
IM4 P -2350.0 -2707.0 (same) -357
Y -3607.0 -3390.0 (same) 217
(3) DAC Output values, before the vent
Optic DOFs DAC Output
IM1 UL / UR -12631 / -12631
LL / LR +12631 / +12631
IM2 UL / UR +22344 / -56720
LL / LR +56720 / -22344
IM3 UL / UR -21130 / +2897
LL / LR -2897 / -21130
IM4 UL / UR +10802 / +51194
LL / LR -51194 / -10802
------
What I think the alignment slider gain should be:
If I use the same method as used in other susTypes (see e.g. LHO aLOG 4730), where the EUL2OSEM matrix properly compensates for the lever arm an number of OSEMs,
OPTICALIGN GAIN [cts/urad] = ( DAC [V/ct] * Coil Driver [A/V] * Coil/Magnet [N/A] * HAUX M1 to M1 [rad/N.m] * 1e6 [urad/rad] )^-1
= ( (20/2^18) * 0.988e-3 * 0.0158 * 74.23 (for Pitch) * 1e6 )^-1
= 11.311 [ct/urad] (for Pitch)
or 0.08841 [urad/ct]
OPTICALIGN GAIN [cts/urad] = ( DAC [V/ct] * Coil Driver [A/V] * Coil/Magnet [N/A] * HSTS M1 to M1 [rad/N.m] * 1e6 [urad/rad] )^-1
= ( (20/2^18) * 0.988e-3 * 0.0158 * 73.87 (for Yaw) * 1e6 )^-1
= 11.367 [ct/urad] (for Yaw)
or 0.087974 [urad/ct]
-- a factor of 2 and 4 off the measured values -- where the DAC gain is taken from T1200311, the coil driver transconductance from T1200264, and coil magnet strength from T1000164, and the compliance from the collection of H1 HAUX measurements in LHO aLOG 8344, since the transfer function model still does not well-match the transfer function data.
--------
The final attachment "2014-07-08_H1HAUX_AlignmentOffset_Calibration.pdf" shows the measurement results of simply taking the alignment sliders at several data points along its range, and pulling the OSEM value off of a data viewer trace. Because I left the opposing DOFs offsets ON during the range walk through, some of the SUS which already had appreciable offsets reached saturation more quickly (i.e. IM4P, IM2Y, and IM2Y). For those data sets, I removed the end points from the fitting routine (which was just a first order polyfit, nothing fancy).
Data was reduced and plots were created by
${SusSVN}/sus/trunk/HAUX/H1/Common/alignmentrelief_Summer2014.m