stuart.aston@LIGO.ORG - posted 18:00, Monday 28 July 2014 (13033)
HAM2 - PR3 (HLTS) all stage Phase 3a Power Spectra are clear
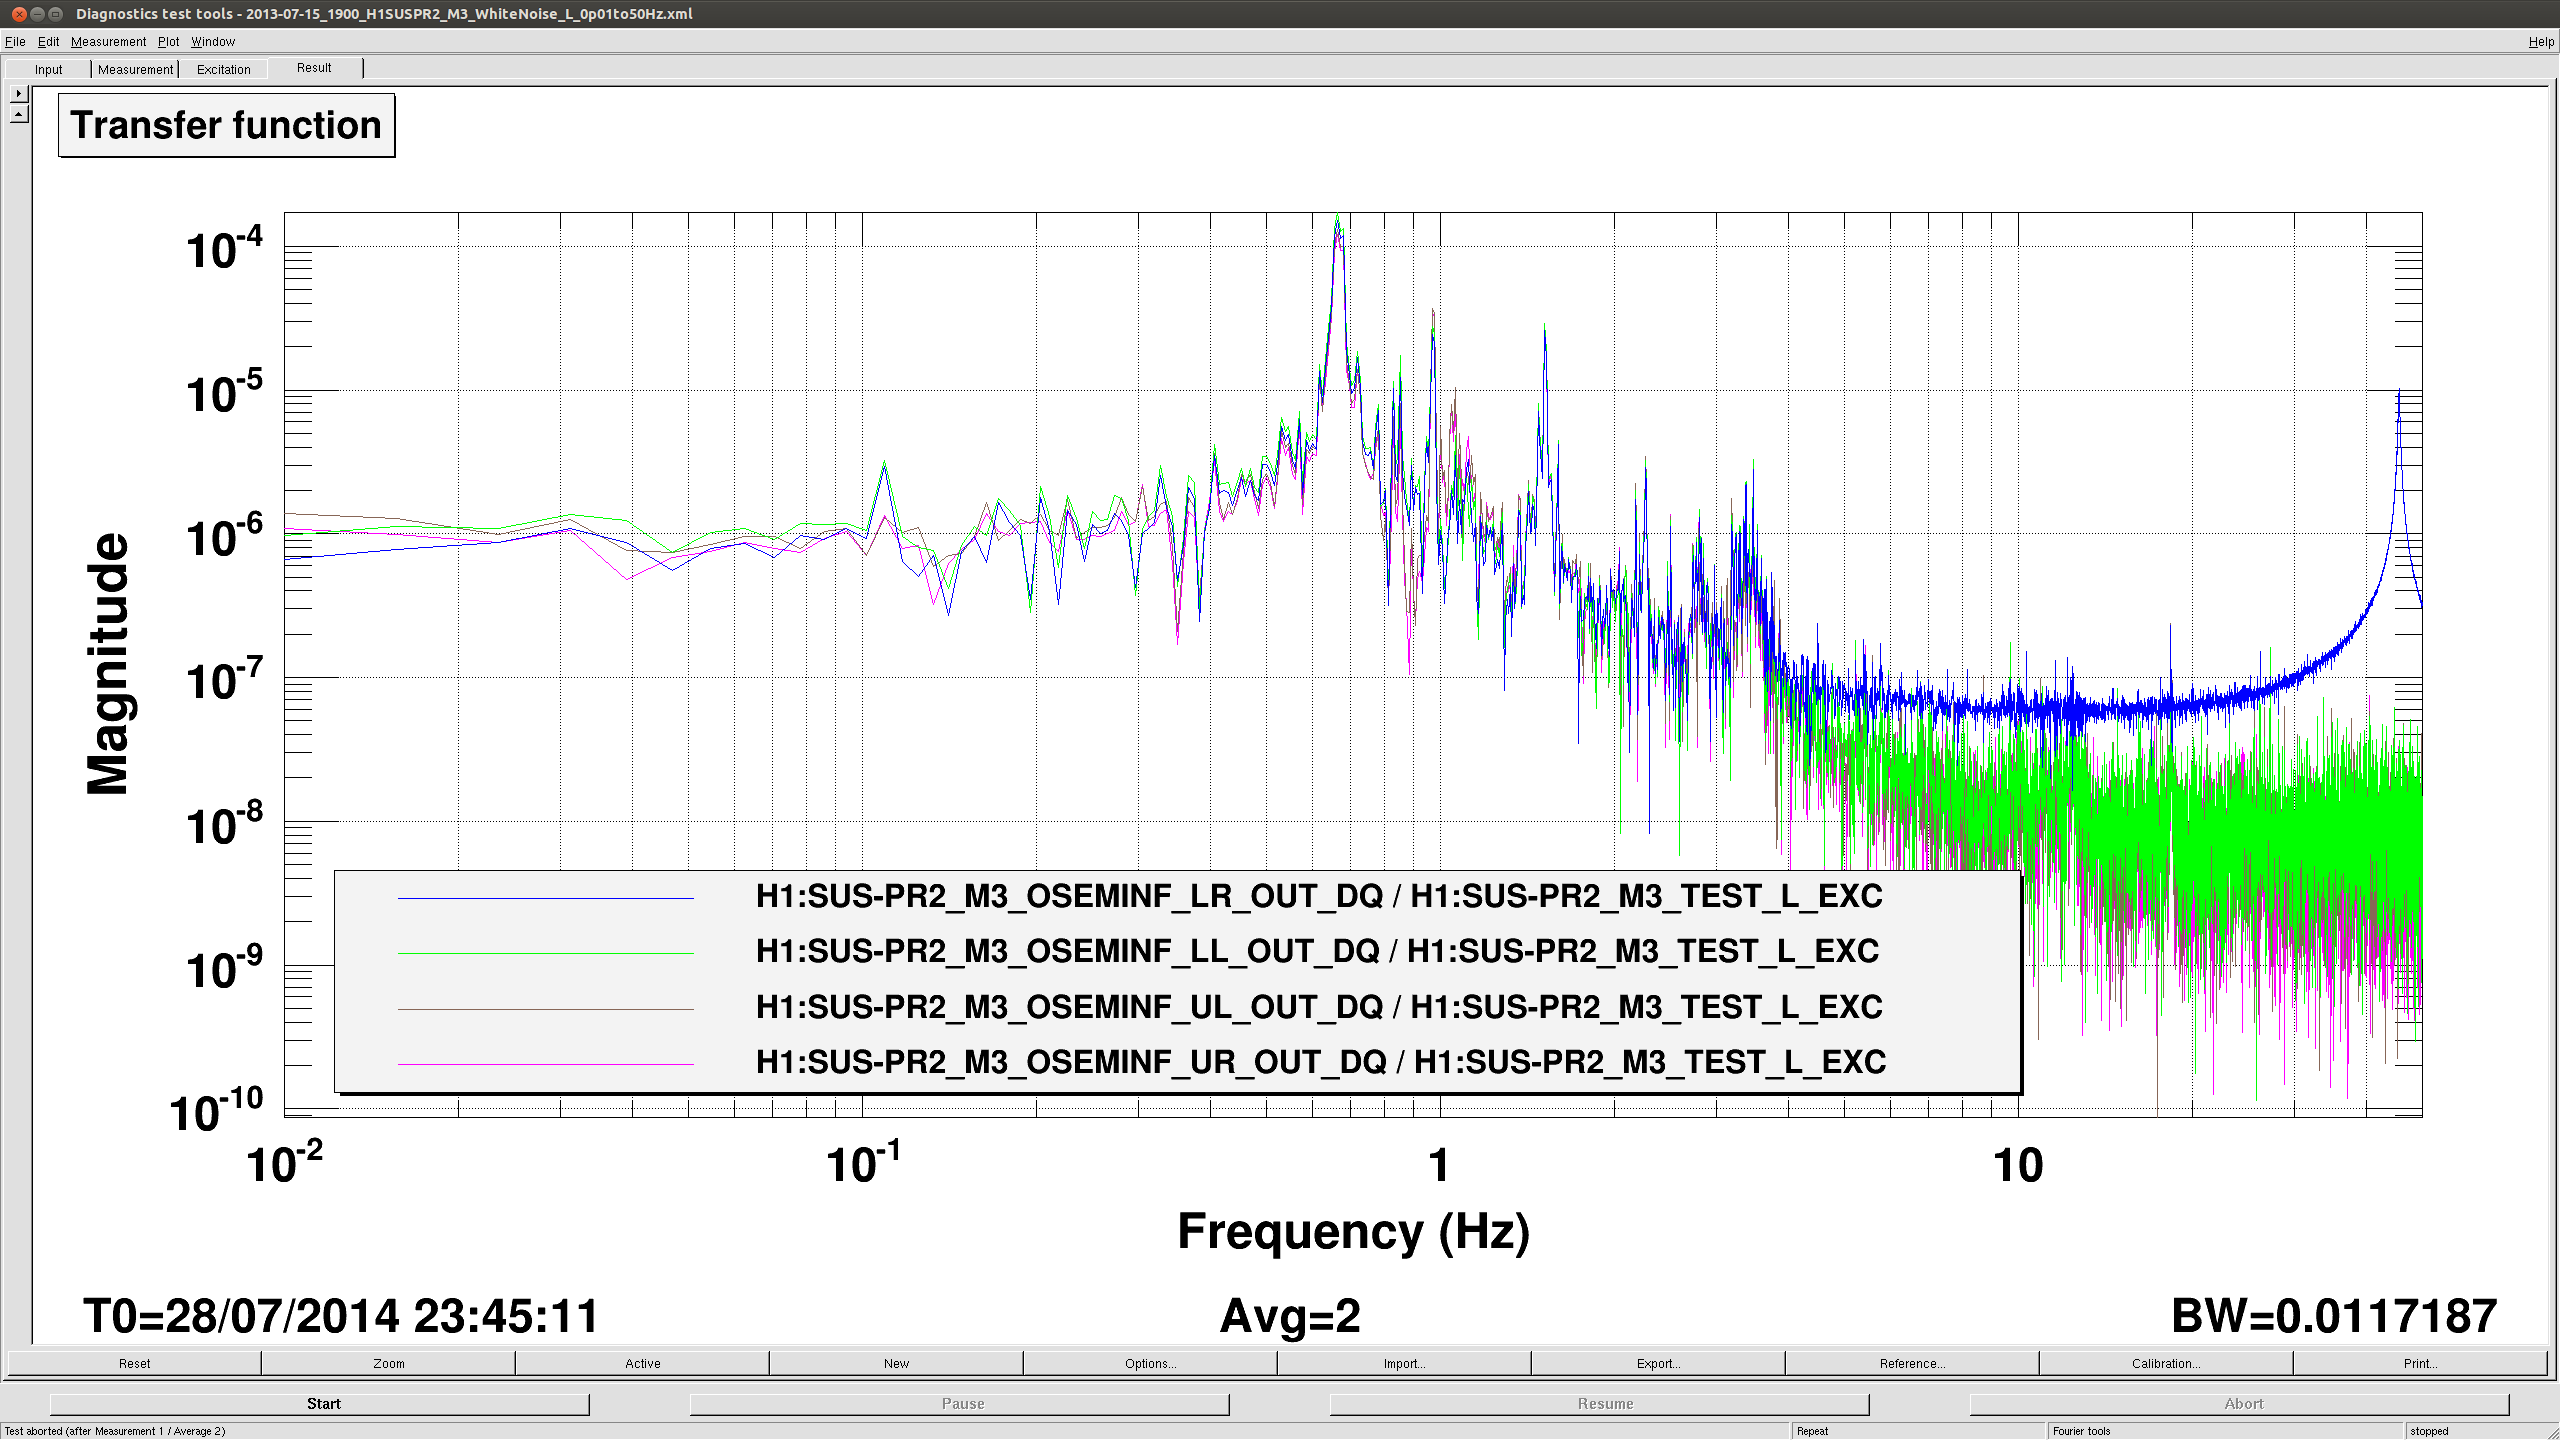
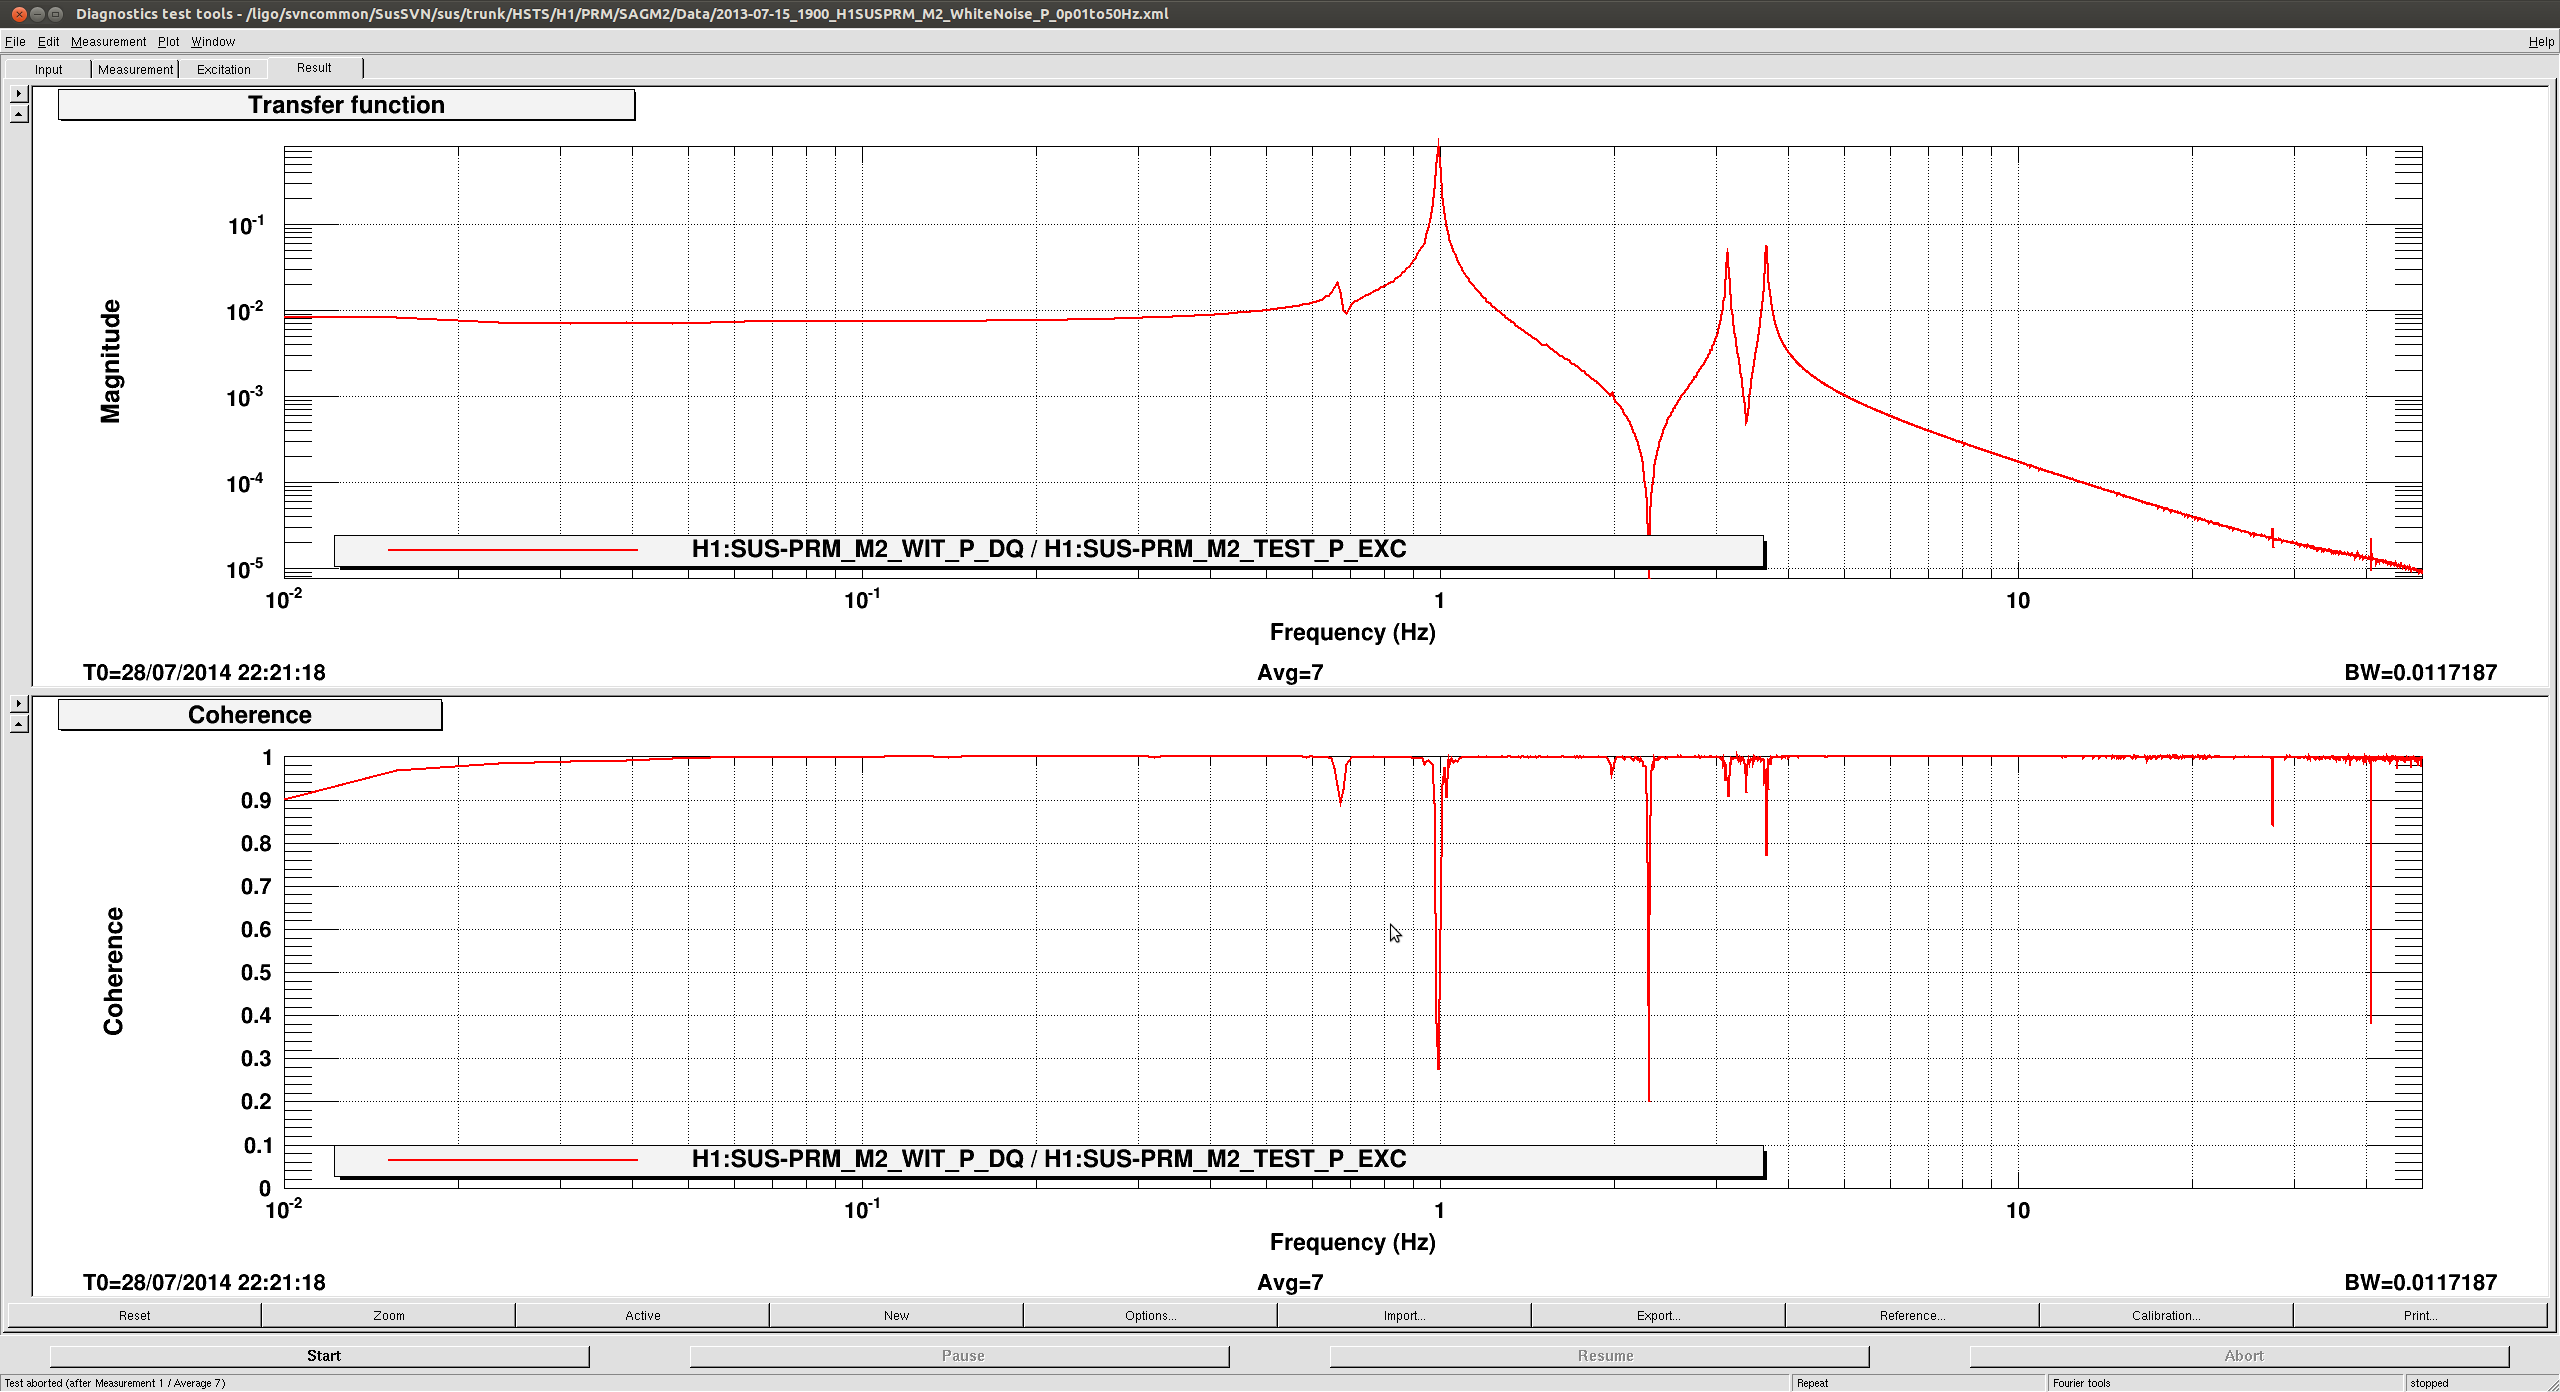
A clean set of TFs were previously taken for all stages (M1, M2 & M3) of PR3 (HLTS) suspensions (see LHO aLOG entries 13017 & 13021), to complete Phase 3a power spectra have been taken with damping loops both ON and OFF for all stages. These power spectra measurements have been compared (allhltss_2014-07-28_Phase3a_H1HLTSs_ALL_Spectra_D*.pdf). The plot key is as follows:-

Black Dashed Line = Expected Sensor Noise
Blue Solid Line = H1SUSSR3 2014−07−24_1030
Green Solid Line = H1SUSPR3 2013−10−07_0800

Summary:

Noise floors for PR3 M1 & M2 stages are consistent with expectations. However, it should be noted that M3 channels exhibit some small excess noise features above 10 Hz, which is most likely due to purge air flow.

All data, scripts and plots have been committed to the sus svn as of this entry.
Non-image files attached to this report