1. Ground loop check
Sheila and Arnaud checked the ground loop from outside and one of the TMSX BOSEM cables was bad. Nothing was done to fix it yet.
2. Putting Pico collars and kapton washers
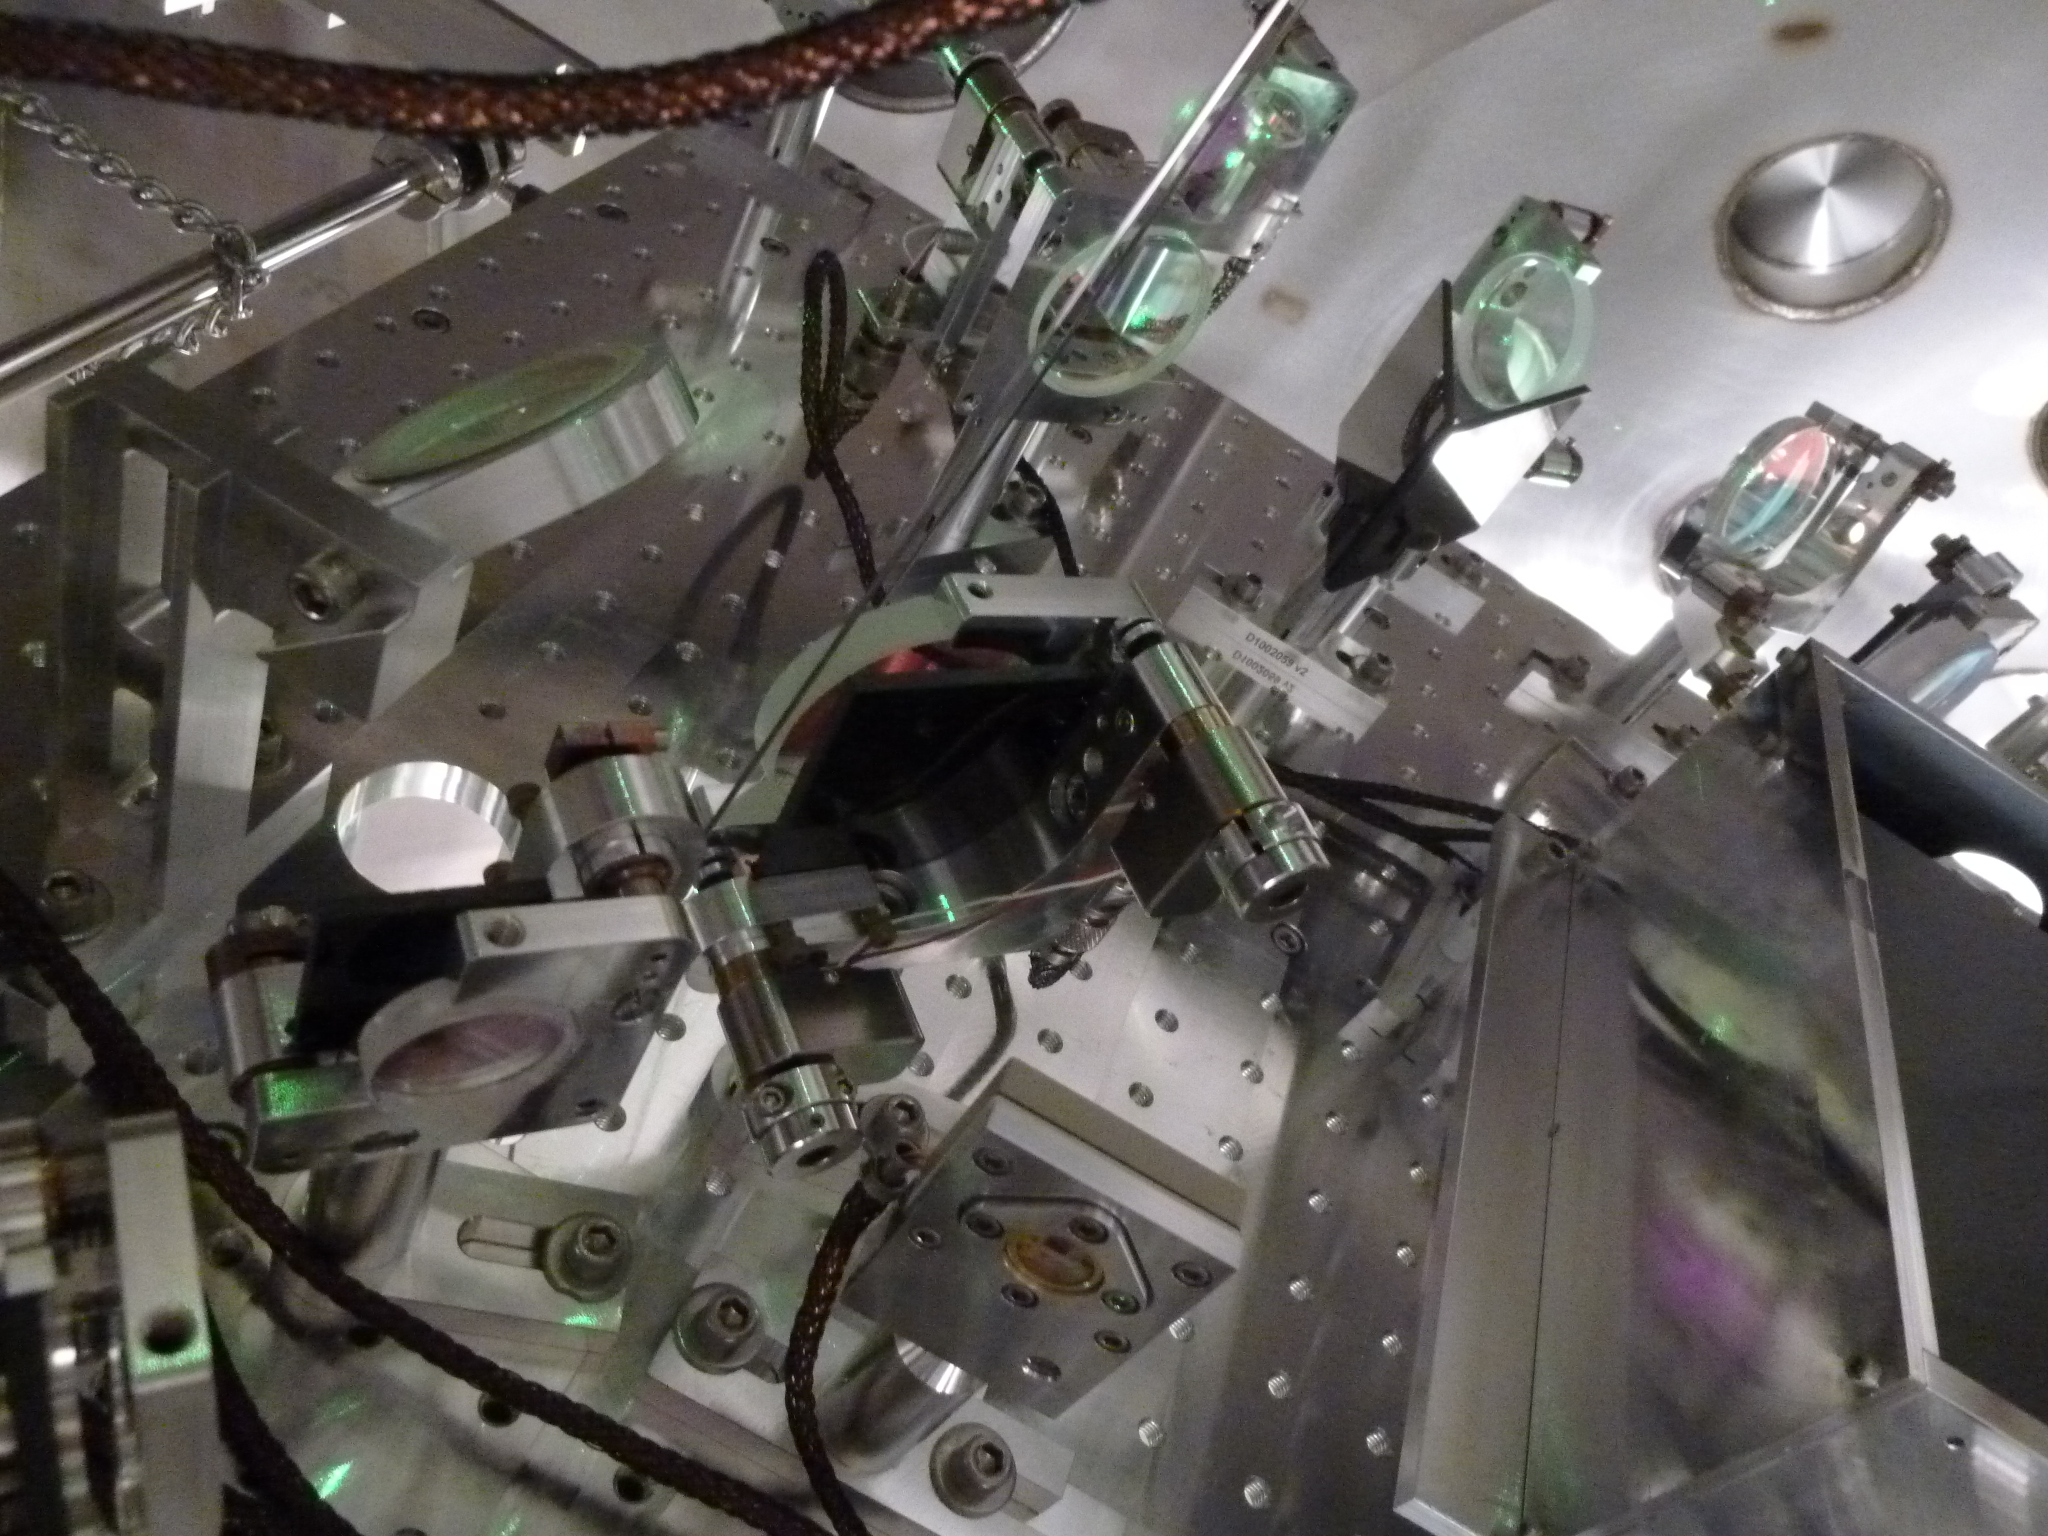
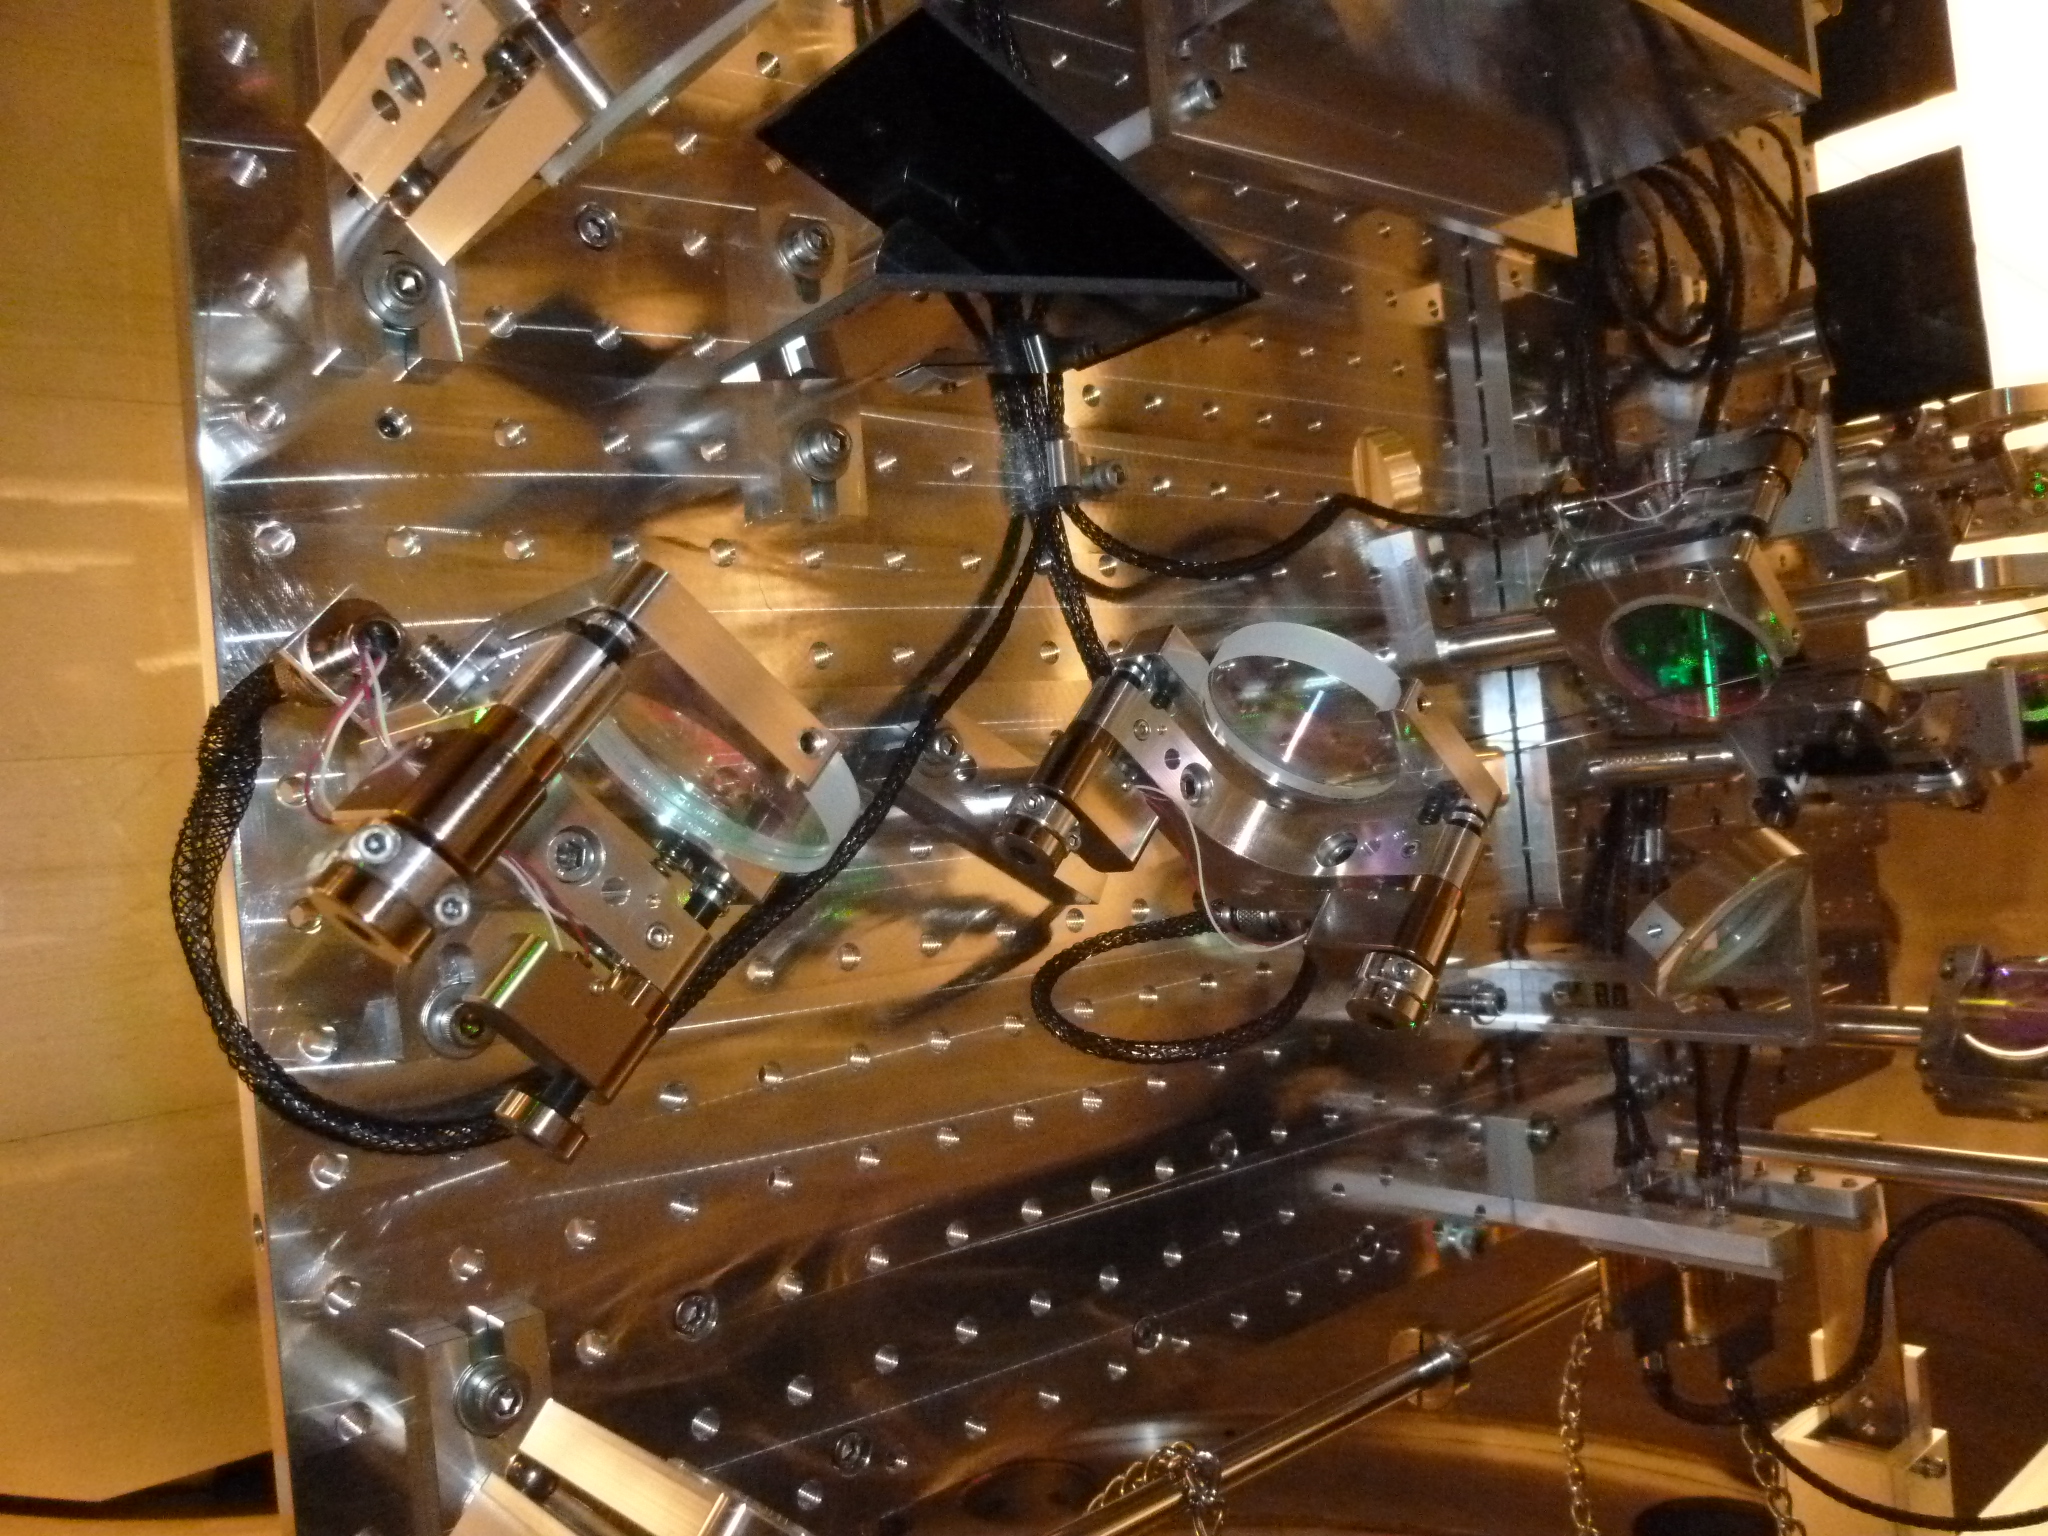
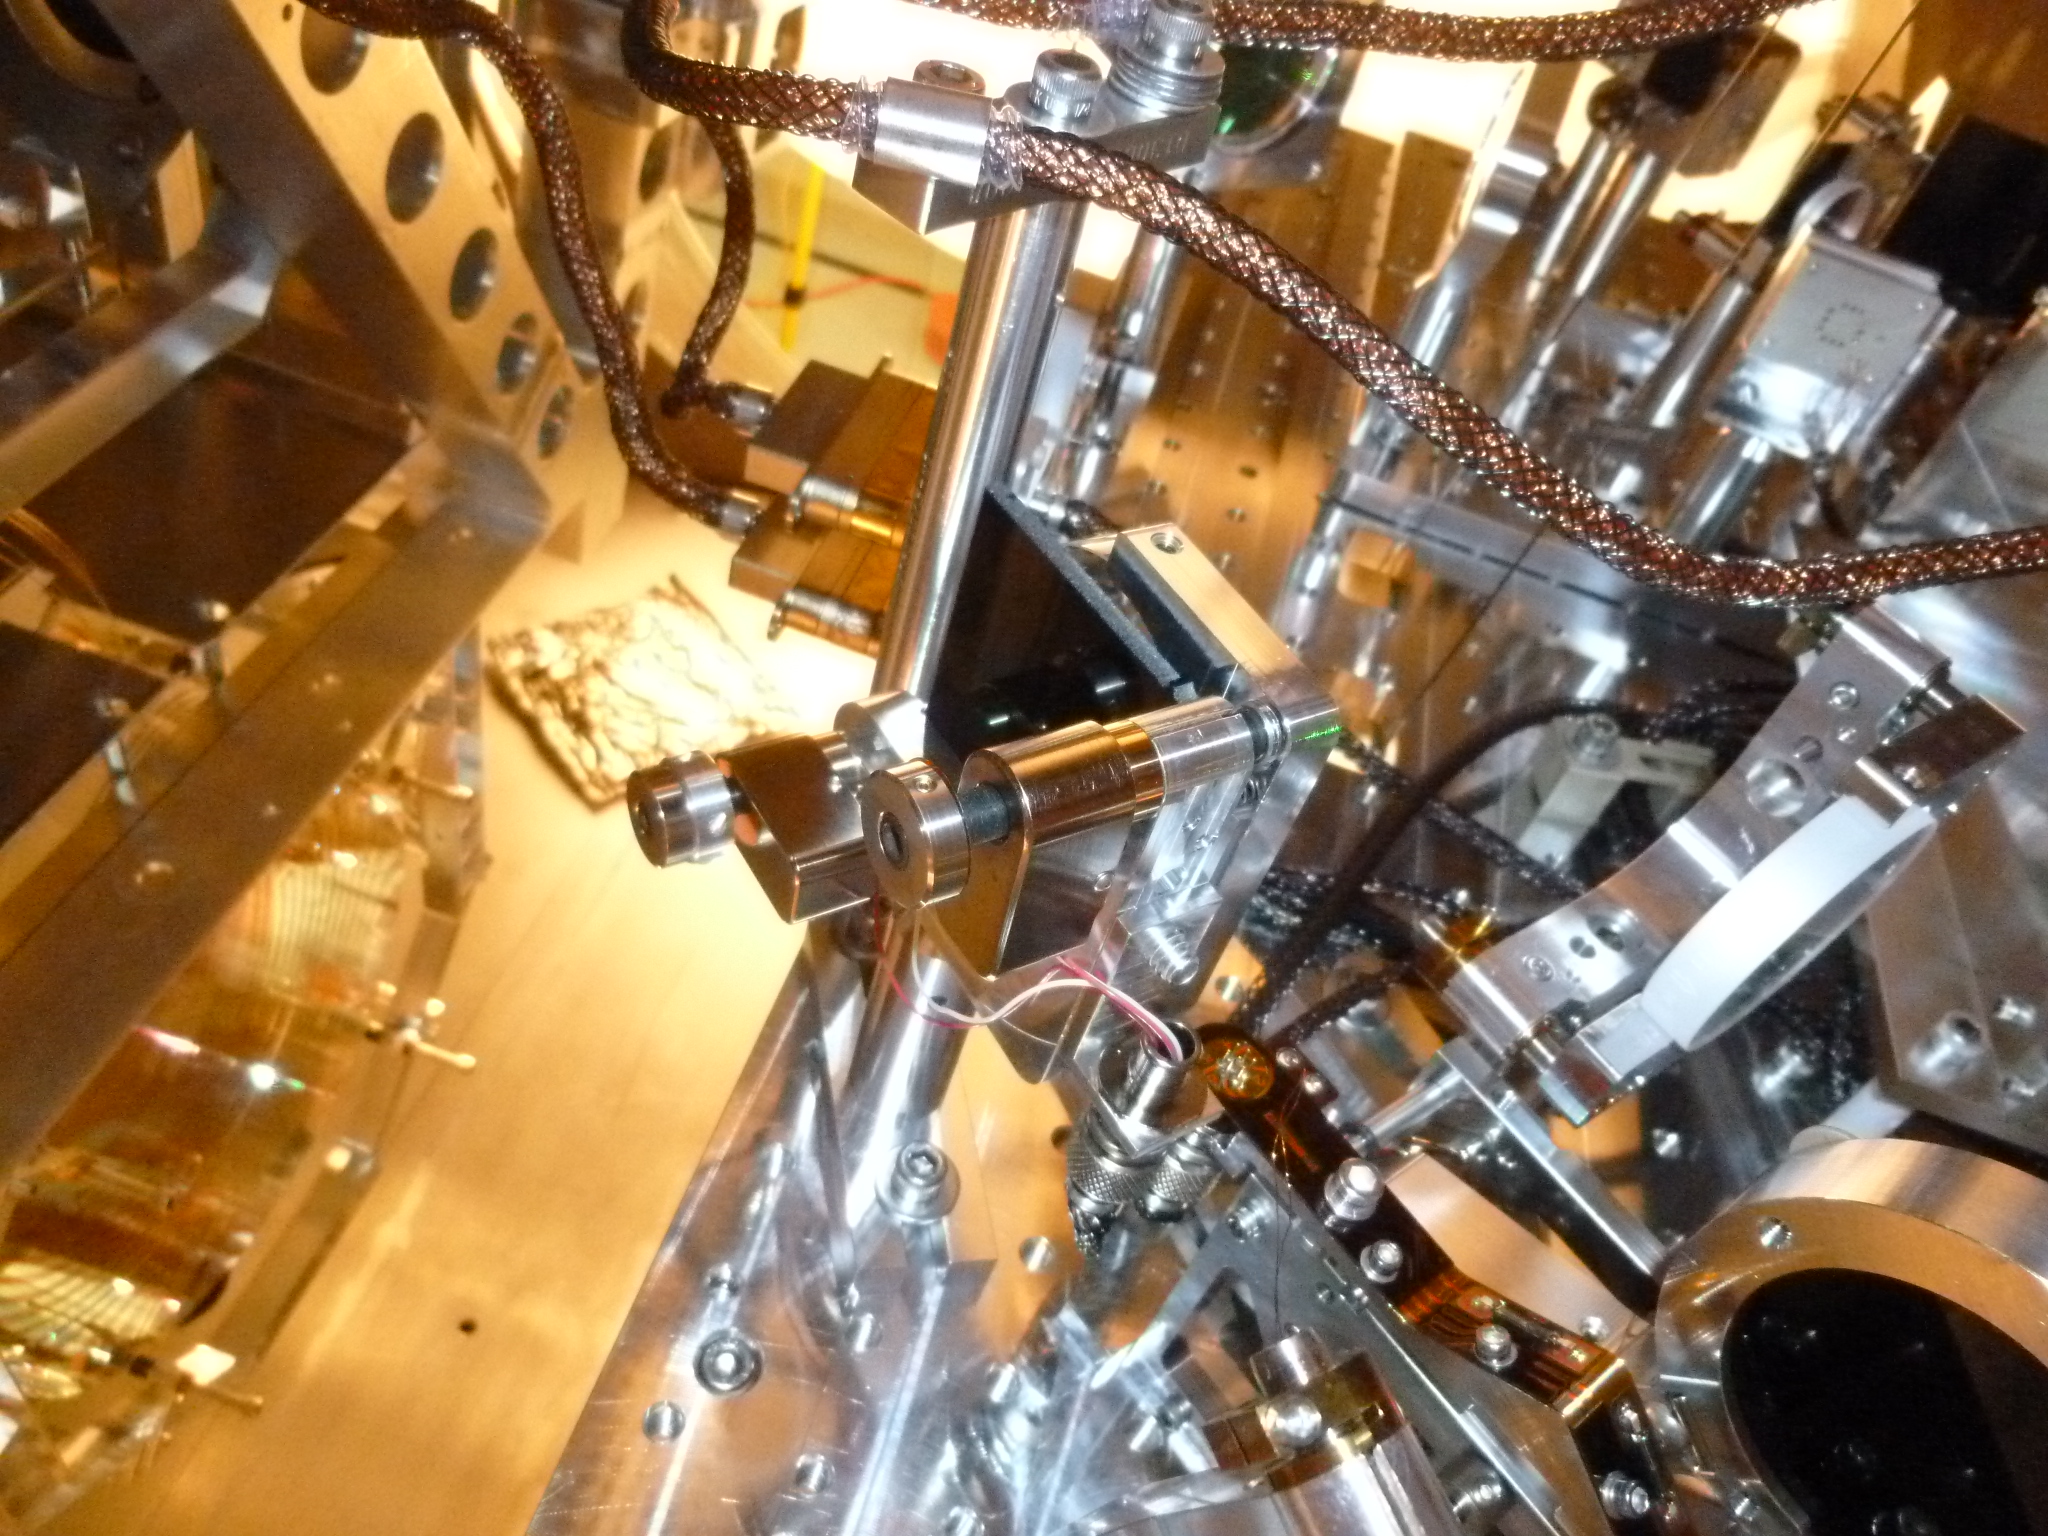
Though I asserted to Corey that EX picos have collars, I was wrong. We put the collars on picomotors where possible, but there was two picomotors (M14 PIT and M3 YAW) where there was not enough space. See pictures.
Then we put kapton washers to all picomotors.
3. Relieving HEPI bias by rebalancing TMS
Some change in the behavior of SUS guardian seems to mean that the SUS bias is not restored by requesting "align". Because I and Sheila were both unaware of this, we tried to "confirm" our alignment with the HEPI bias on with slightly wrong ETMX bias (turned out later that it was about 30urad too much), and we couldn't quite align the TMS, but estimated from the distance of the forward-going and back-going beam on one of the HWP that we needed 30 urad more headroom to align it. (So things were consistent in the end.)
Anyway, we ended up having to relieve about 300 urad of TMS bias in PIT by moving PIT balance masses on the TMS.
4. Setting up ISCTEX for realigning IR QPDs
First we tried to use Sheila's setup as is, but it turned out that the beam would get too large inside the TransMon telescope.
We removed the lens in the IR TRANS monitor path on ISCTEX and that made things better. After much iterations, we reasonably aligned the IR beam such that the beam retro-reflects from the ETMX and the beam position on the secondary is on top of the green beam within 2mm or so. The IR beam diameter coming out of the arm is about 6mm on the secondary, so 2mm is not very small but should be good enough to put the beam on QPDs.
5. Aligning the steering mirrors on TMS
Not surprisingly, the IR beam was very close to one of the green beams on the QPDs.
We found that the beam was totally off on the QPD sled and was not making it to the QPDs, but just moving M14 was good enough to bring the IR beam on both QPDA and QPDB. It's somewhat puzzling that people could not center the QPDs using M14 and M4, but again it's kind of hard to turn the right knob for the right degree of freedom because two mirrors are almost degenerate (https://alog.ligo-wa.caltech.edu/aLOG/index.php?callRep=11897).
Two disappointments were that the beam was bigger than the 3mm QPD (it looks like 4mm or maybe more), and that the IR power seemed to be too small to be useful for centering. The latter was surprising as the OzOptic laser is nominally 10mW, and given the 95% splitter in the path the power on each QPD should be about 10E-3*0.95*0.05*0.5 = 240uW, which doesn't sound terrible.
Anyway, our mission is to bring the IR beam centered on both QPDs within 1mm, and keep the IR path to the ISCTEX at about the center of the clear aperture formed by the chamber/viewport/table enclosure, to make sure that the pico mirrors can take care of the fine centering job without destroying the in-air IR path. We will center both of the QPDs using M14 (pico) and M15 (manual) as good as can be done by eyeballing tomorrow.