[M. Todd, C. Compton, G. Vajente, S. Dwyer]
Summary
To understand the effect of the Relative Intensity Noise (RIN) of the CO2 laser (Access 5W L5L) proposed for CHETA on the DARM loop, we've done a brief study to check whether the addition of the RIN as displacement noise in deltaL will cause saturation at several key points in the DARM loop such as the ESD driver and DCPDs. The estimates we've made on the RIN at these points are calibrated with the DARM model in pydarm, which models the DARM loop during Nominal Low Noise; however, appropriate checks have been made that these estimates are accurate or at least over-estimating of the effects during lower power stages (when the CHETA laser will be on).
CHETA RIN to ESD drive
This estimate is done by propagating displacement noise in deltaL (how CHETA RIN is modeled, m/rtHz) to counts RMS of the ESD DAC. The RMS value of this should stay below 25% or so of the saturation level of the DAC, which is 2**19. To do this, we multiply the loop suppressed CHETA RIN (calibrated into DARM) by the transfer functions mapping deltaL to ESD counts (all are calculated at NLN using pydarm).
The CHETA RIN in ESD cts RMS is 0.161% of the saturation level, and in L2 coil cts RMS is 1.098%, and in L3 coil cts RMS is 0.015%. It is worth noting that the CHETA RIN RMS at these points is around 10x higher than that which we expect with just DARM during NLN.
We also checked to make sure that the ESD cts RMS during power-up states is not higher than that during NLN, meaning the calibration using NLN values gives us a worst case scenario of the CHETA RIN impact on ESD cts RMS.
List of Figures:
1) Loop Model Diagram with labeled nodes
2) CHETA RIN in ESD cts RMS
3) CHETA RIN in L2coil cts RMS
4) CHETA RIN in L1coil cts RMS
5) DARM Open Loop Gain - pydarm
6) DARM Sensing Function - pydarm
7) DARM Control Function (Digitals) - pydarm
8) Transfer Function: L3DAC / DARM_CTRL - pydarm
9) Transfer Function: L2DAC / DARM_CTRL - pydarm
10) Transfer Function: L1DAC / DARM_CTRL - pydarm
11) ASD/RMS ESD cts during power-up states - diaggui H1:SUS-ETMX-L3_MASTER_OUT_UL_DQ
12) CHETA RIN ASD (raw)
CHETA RIN to DCPD ADC
This estimate is done by propagating displacement noise in deltaL (how CHETA RIN is modeled, m/rtHz) to counts RMS of the DCPD ADC. The RMS value of this should stay below 25% or so of the saturation level of the DAC, which is 2**15. To do this, we multiply the loop suppressed CHETA RIN (calibrated into DARM) by the transfer functions mapping deltaL to DCPD ADC counts, using the filters in Foton files. This gives us the whitened ADC counts, so by multiplying by the anti-whitening filter we get the unwhitened DCPD ADC cts RMS, which is what is at risk of saturation.
The CHETA RIN in DCPD cts RMS is 3.651% of the saturation level. Again, it is worth noting that the CHETA RIN RMS at this point is around 10x higher than that which we expect with just DARM during NLN.
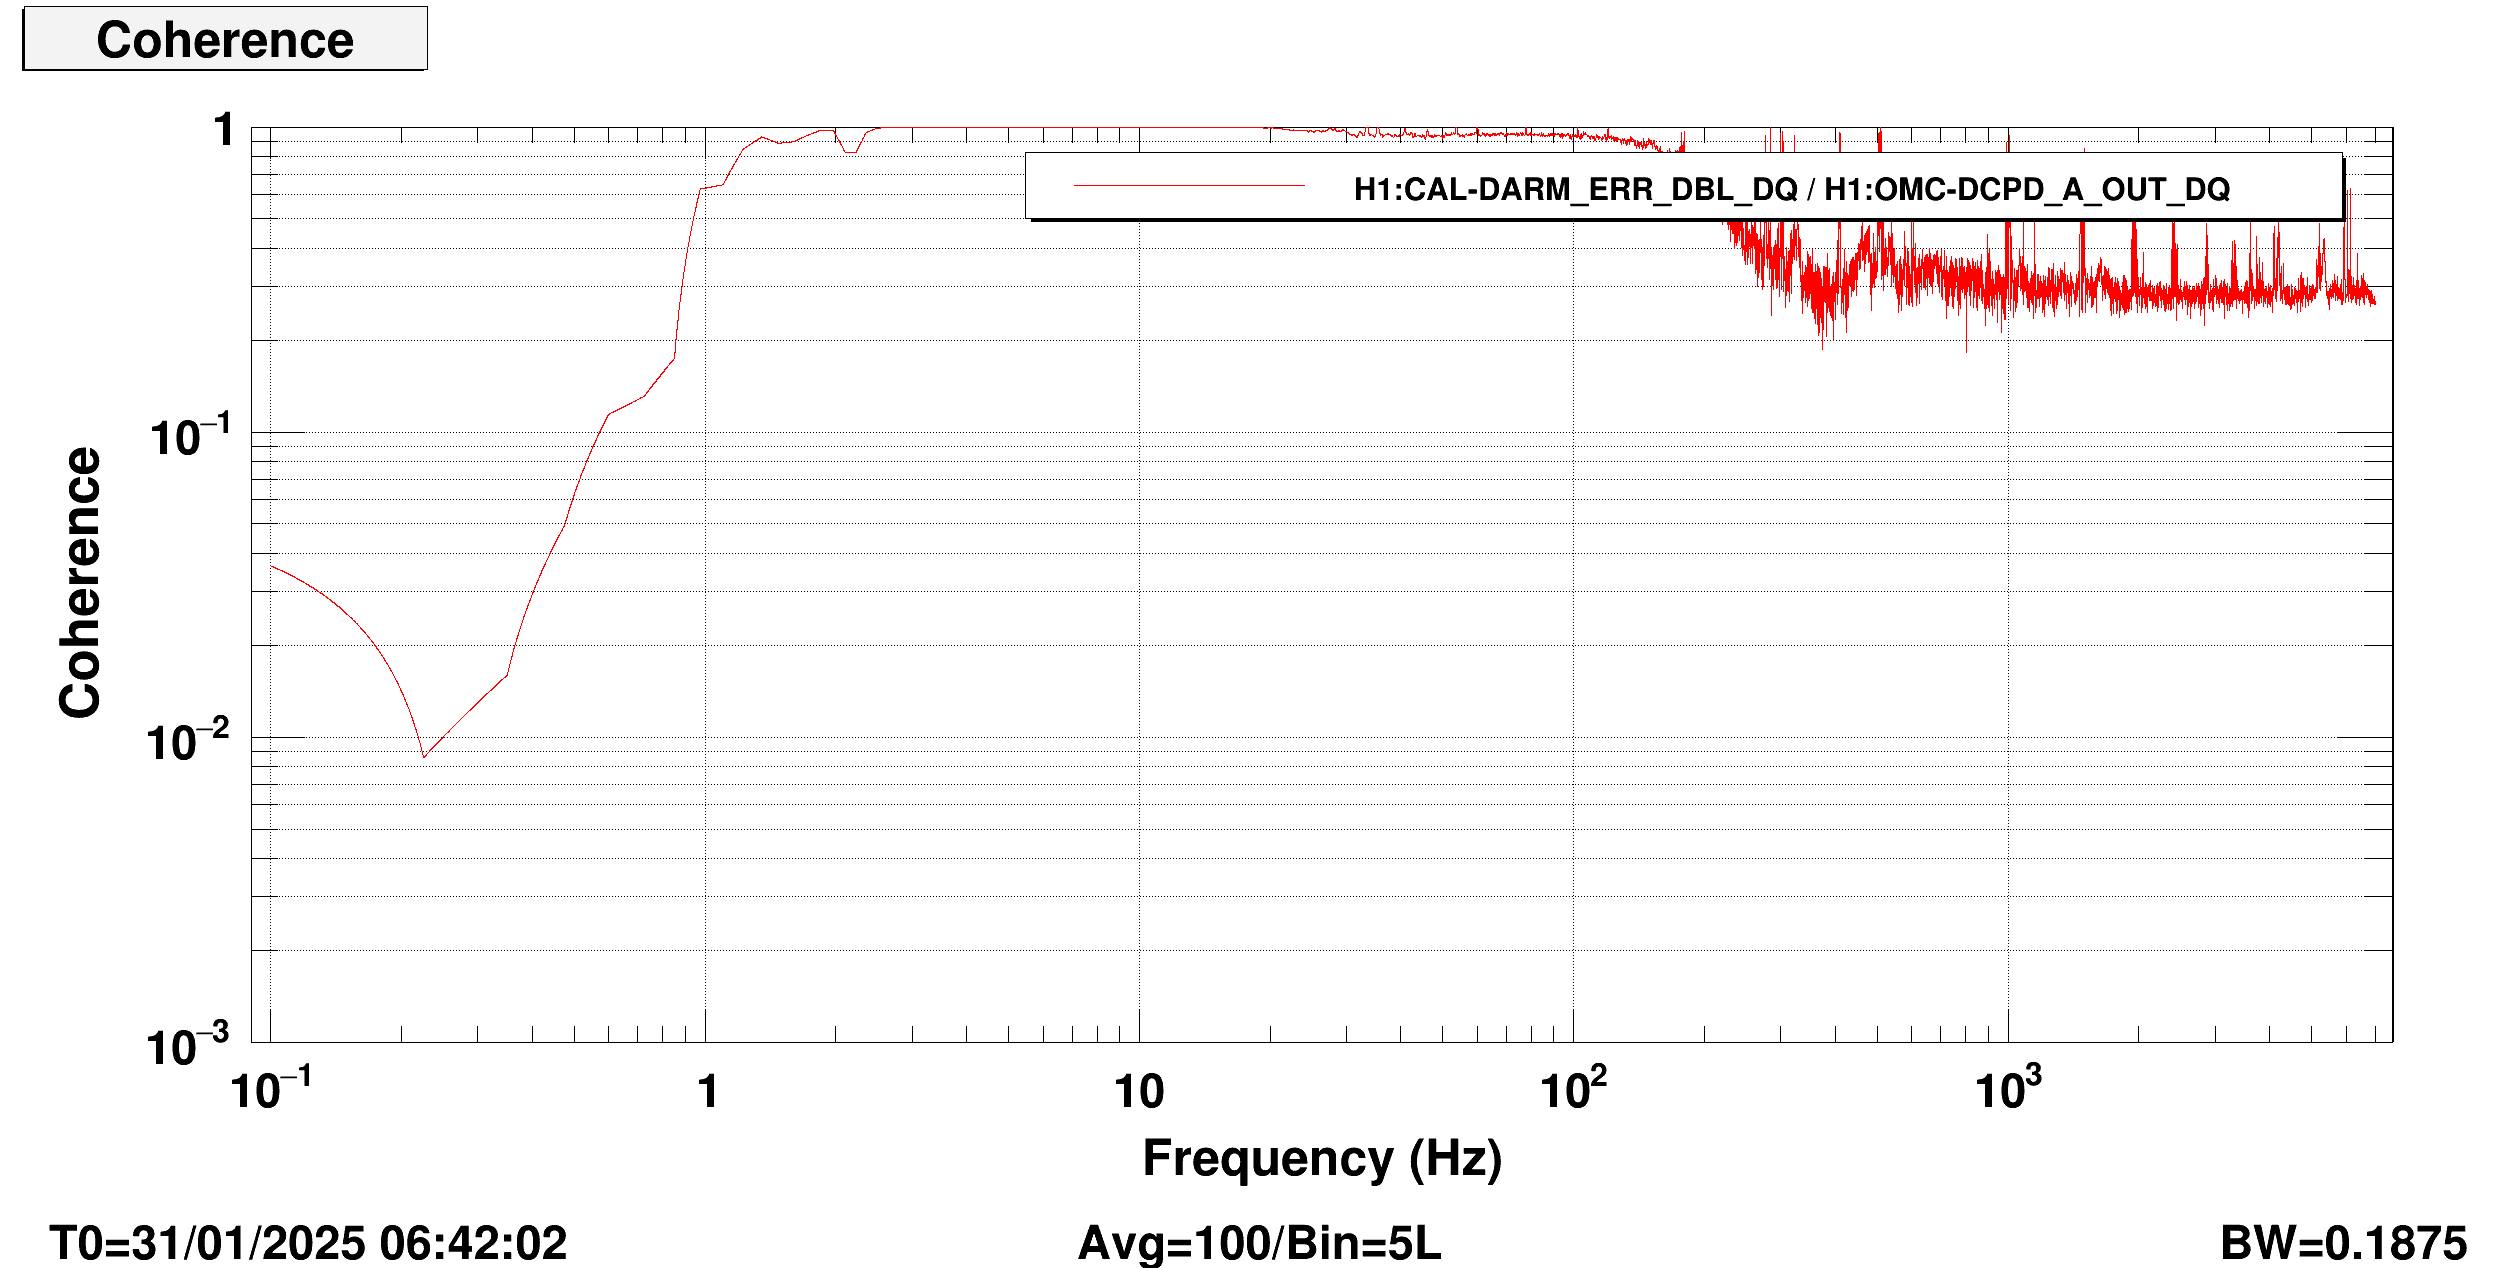
We also checked to make sure that the DCPD-A ADC channel is coherent with DARM_ERR. In short, it is up to 300Hz, where controls noise dominates our signal -- after 300Hz shot noise becomes the dominant noise source and reduces our coherence.
List of Figures:
1) Loop Model Diagram with labeled nodes
2) CHETA RIN in DCPD ADC cts RMS
3) Transfer Function: DCPD-ADC / DELTAL_CTRL
4) Coherence: DCPD-A / DARM_ERR
Codes used:
Calibrating CHETA RIN to ESD cts RMS
Calibrating CHETA RIN to DCPD ADC cts RMS
Previous related alogs:
1) alog 82456