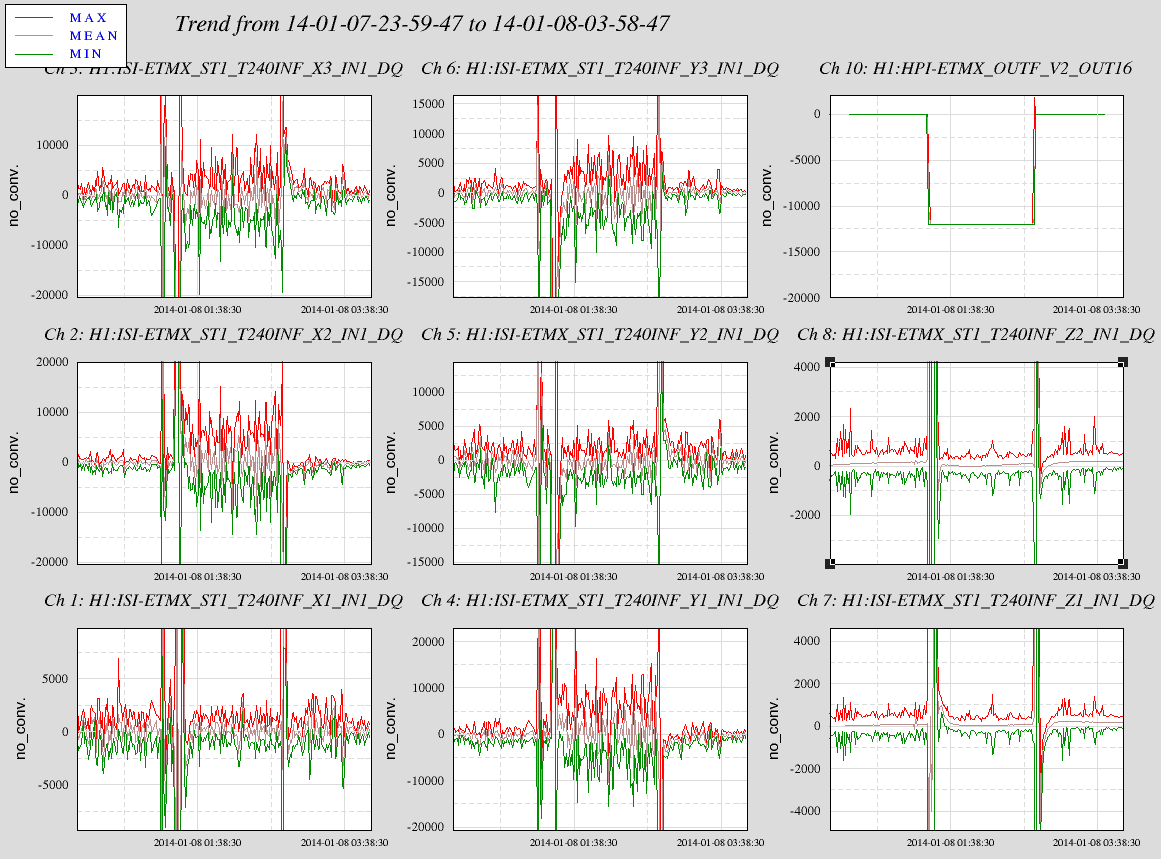
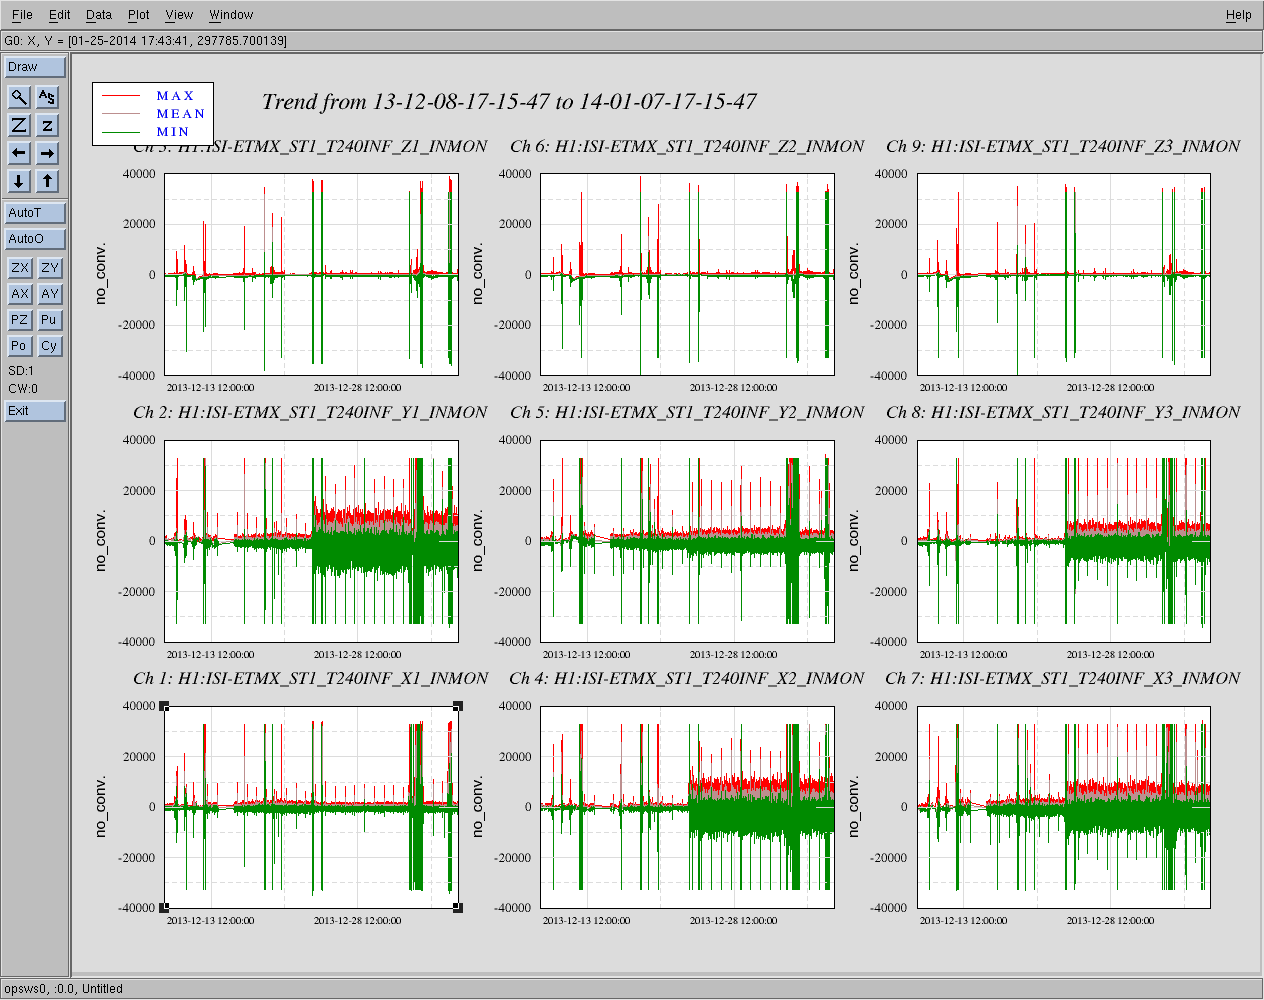
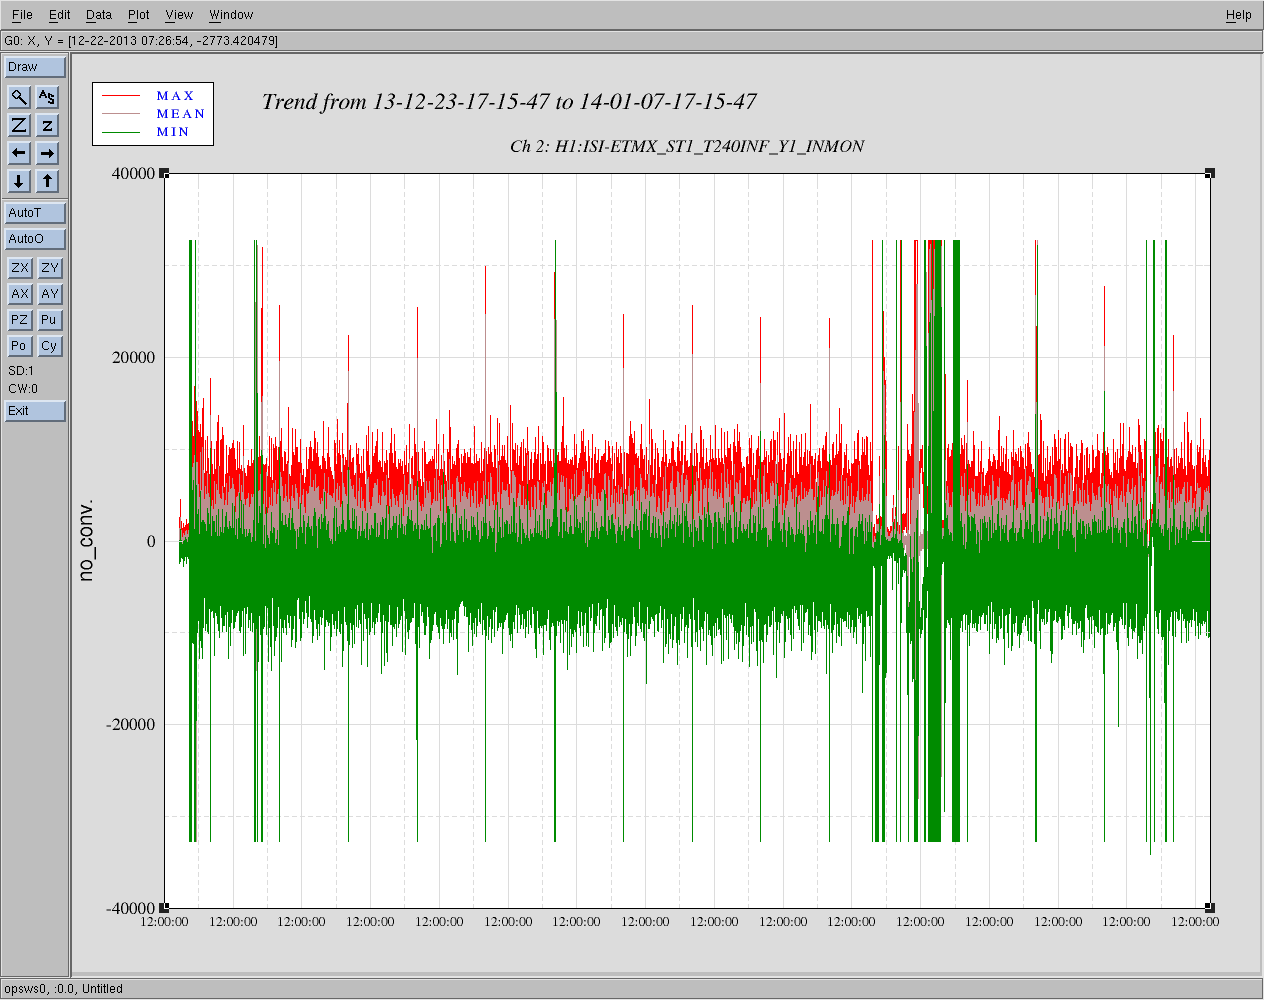
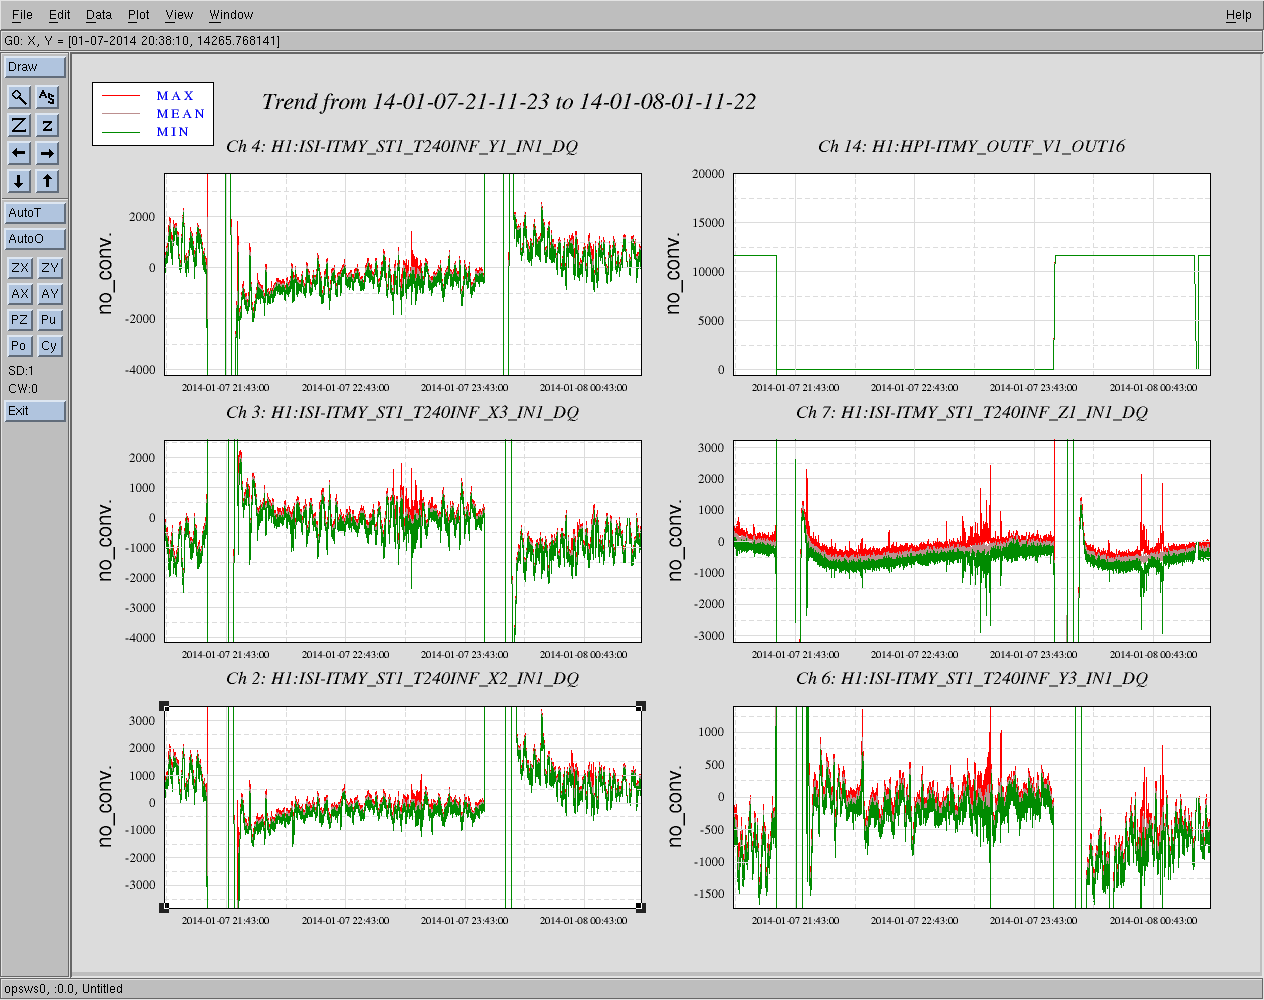
Related to the continuing study of the subject problem, I repeated the measurement at ETMx. When compared to a similar tilt applied to ITMY (see 9139), the HEPI Tilt increases the noise level on the T240 significantly more at ETMX. See the first 4 hour plot below. The upper right plot is the HEPI tilt first off then on and then off again. The vertical axes of the T240 are pretty much unaffected. And depending on the orientation of the pod, some axes are more affected than others.
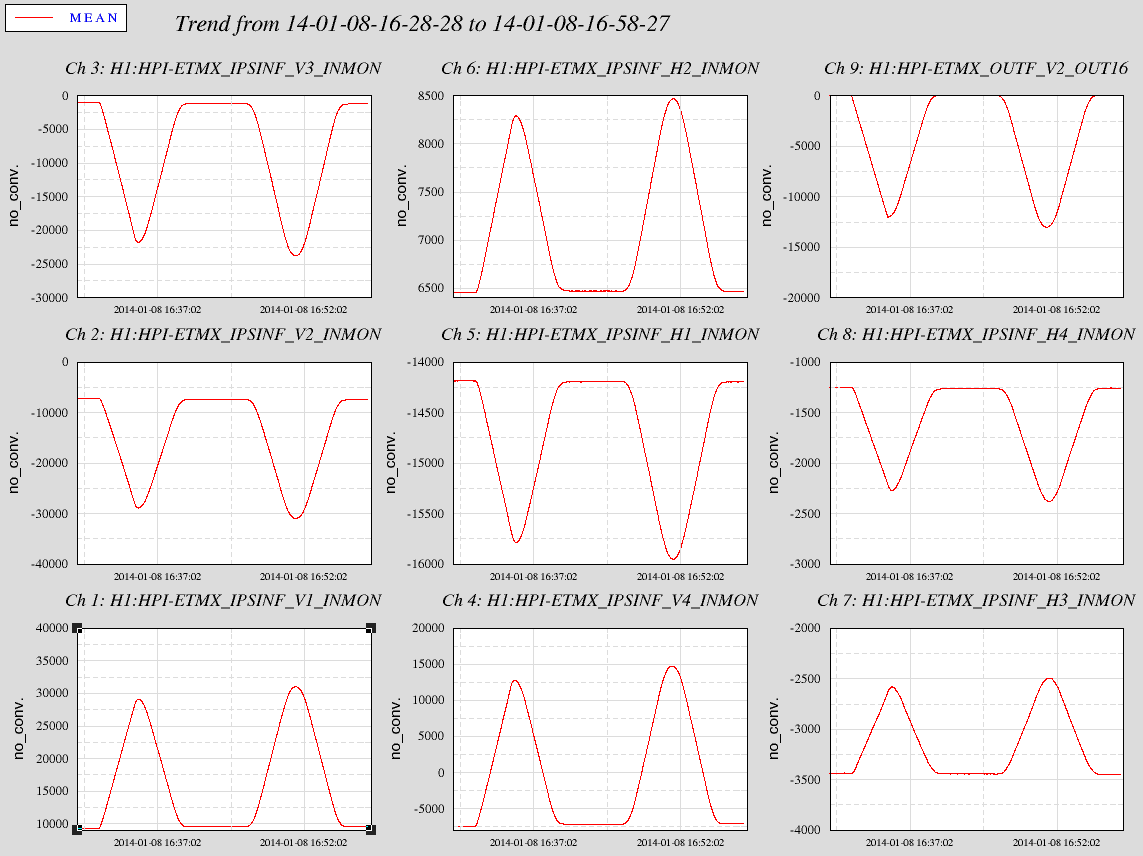
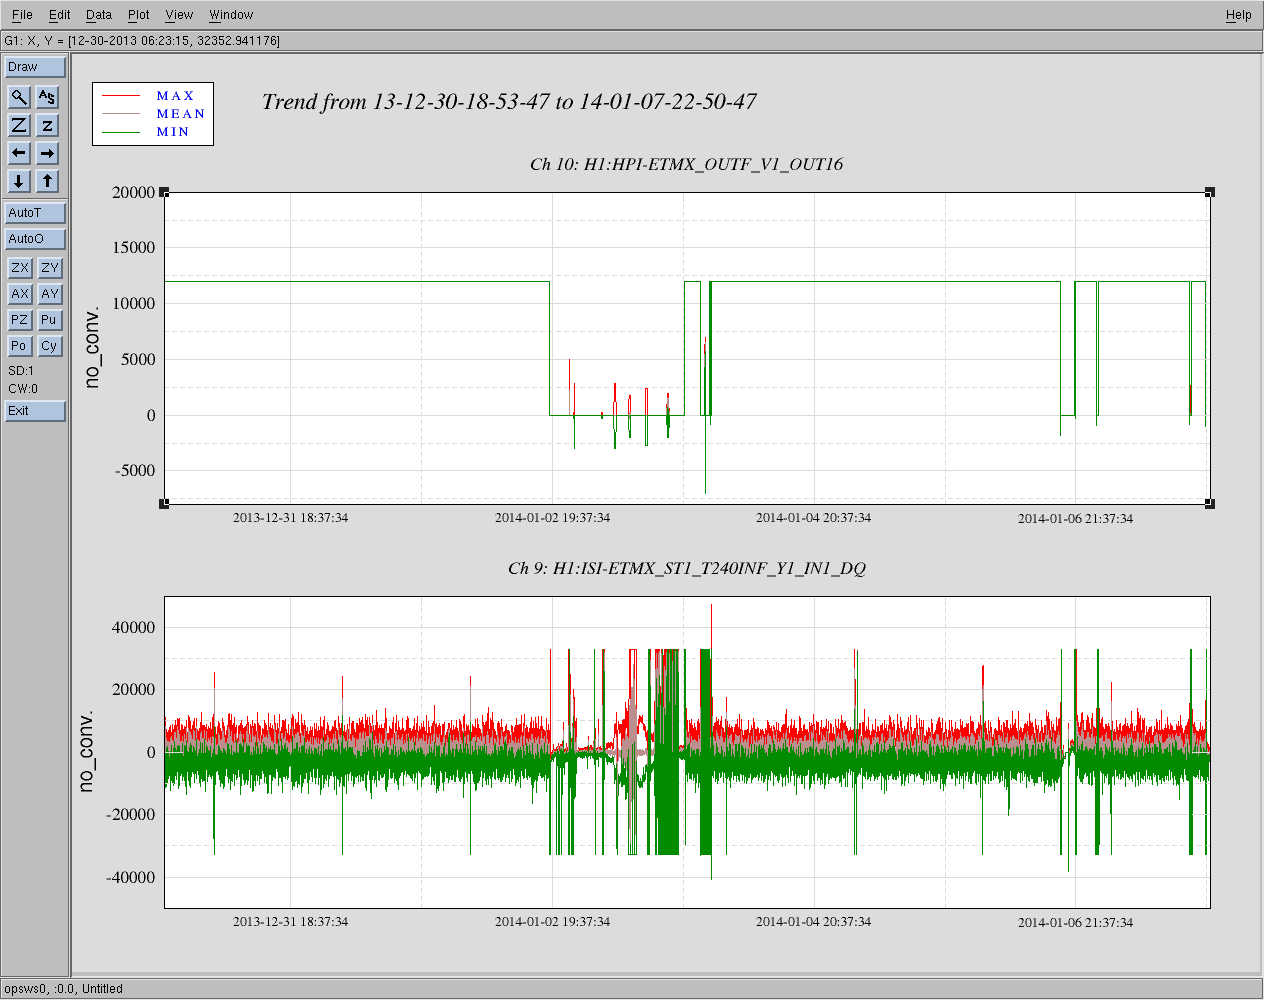
I had a thought, if we were running the HEPI Actuators into their stops, we could be shorting HEPI to ground and affecting the T240. So, I did the -12000 offset, back to zero and then went to -13000. See the second 30 minute plot with the offset 'ramps' in the upper right. Notice the other graphs with the 8 HEPI position sensors showing an increase in position at the -13000 offset relative to the -12000. So I think this says the Actuators are not running into anything at the -12000 count level...