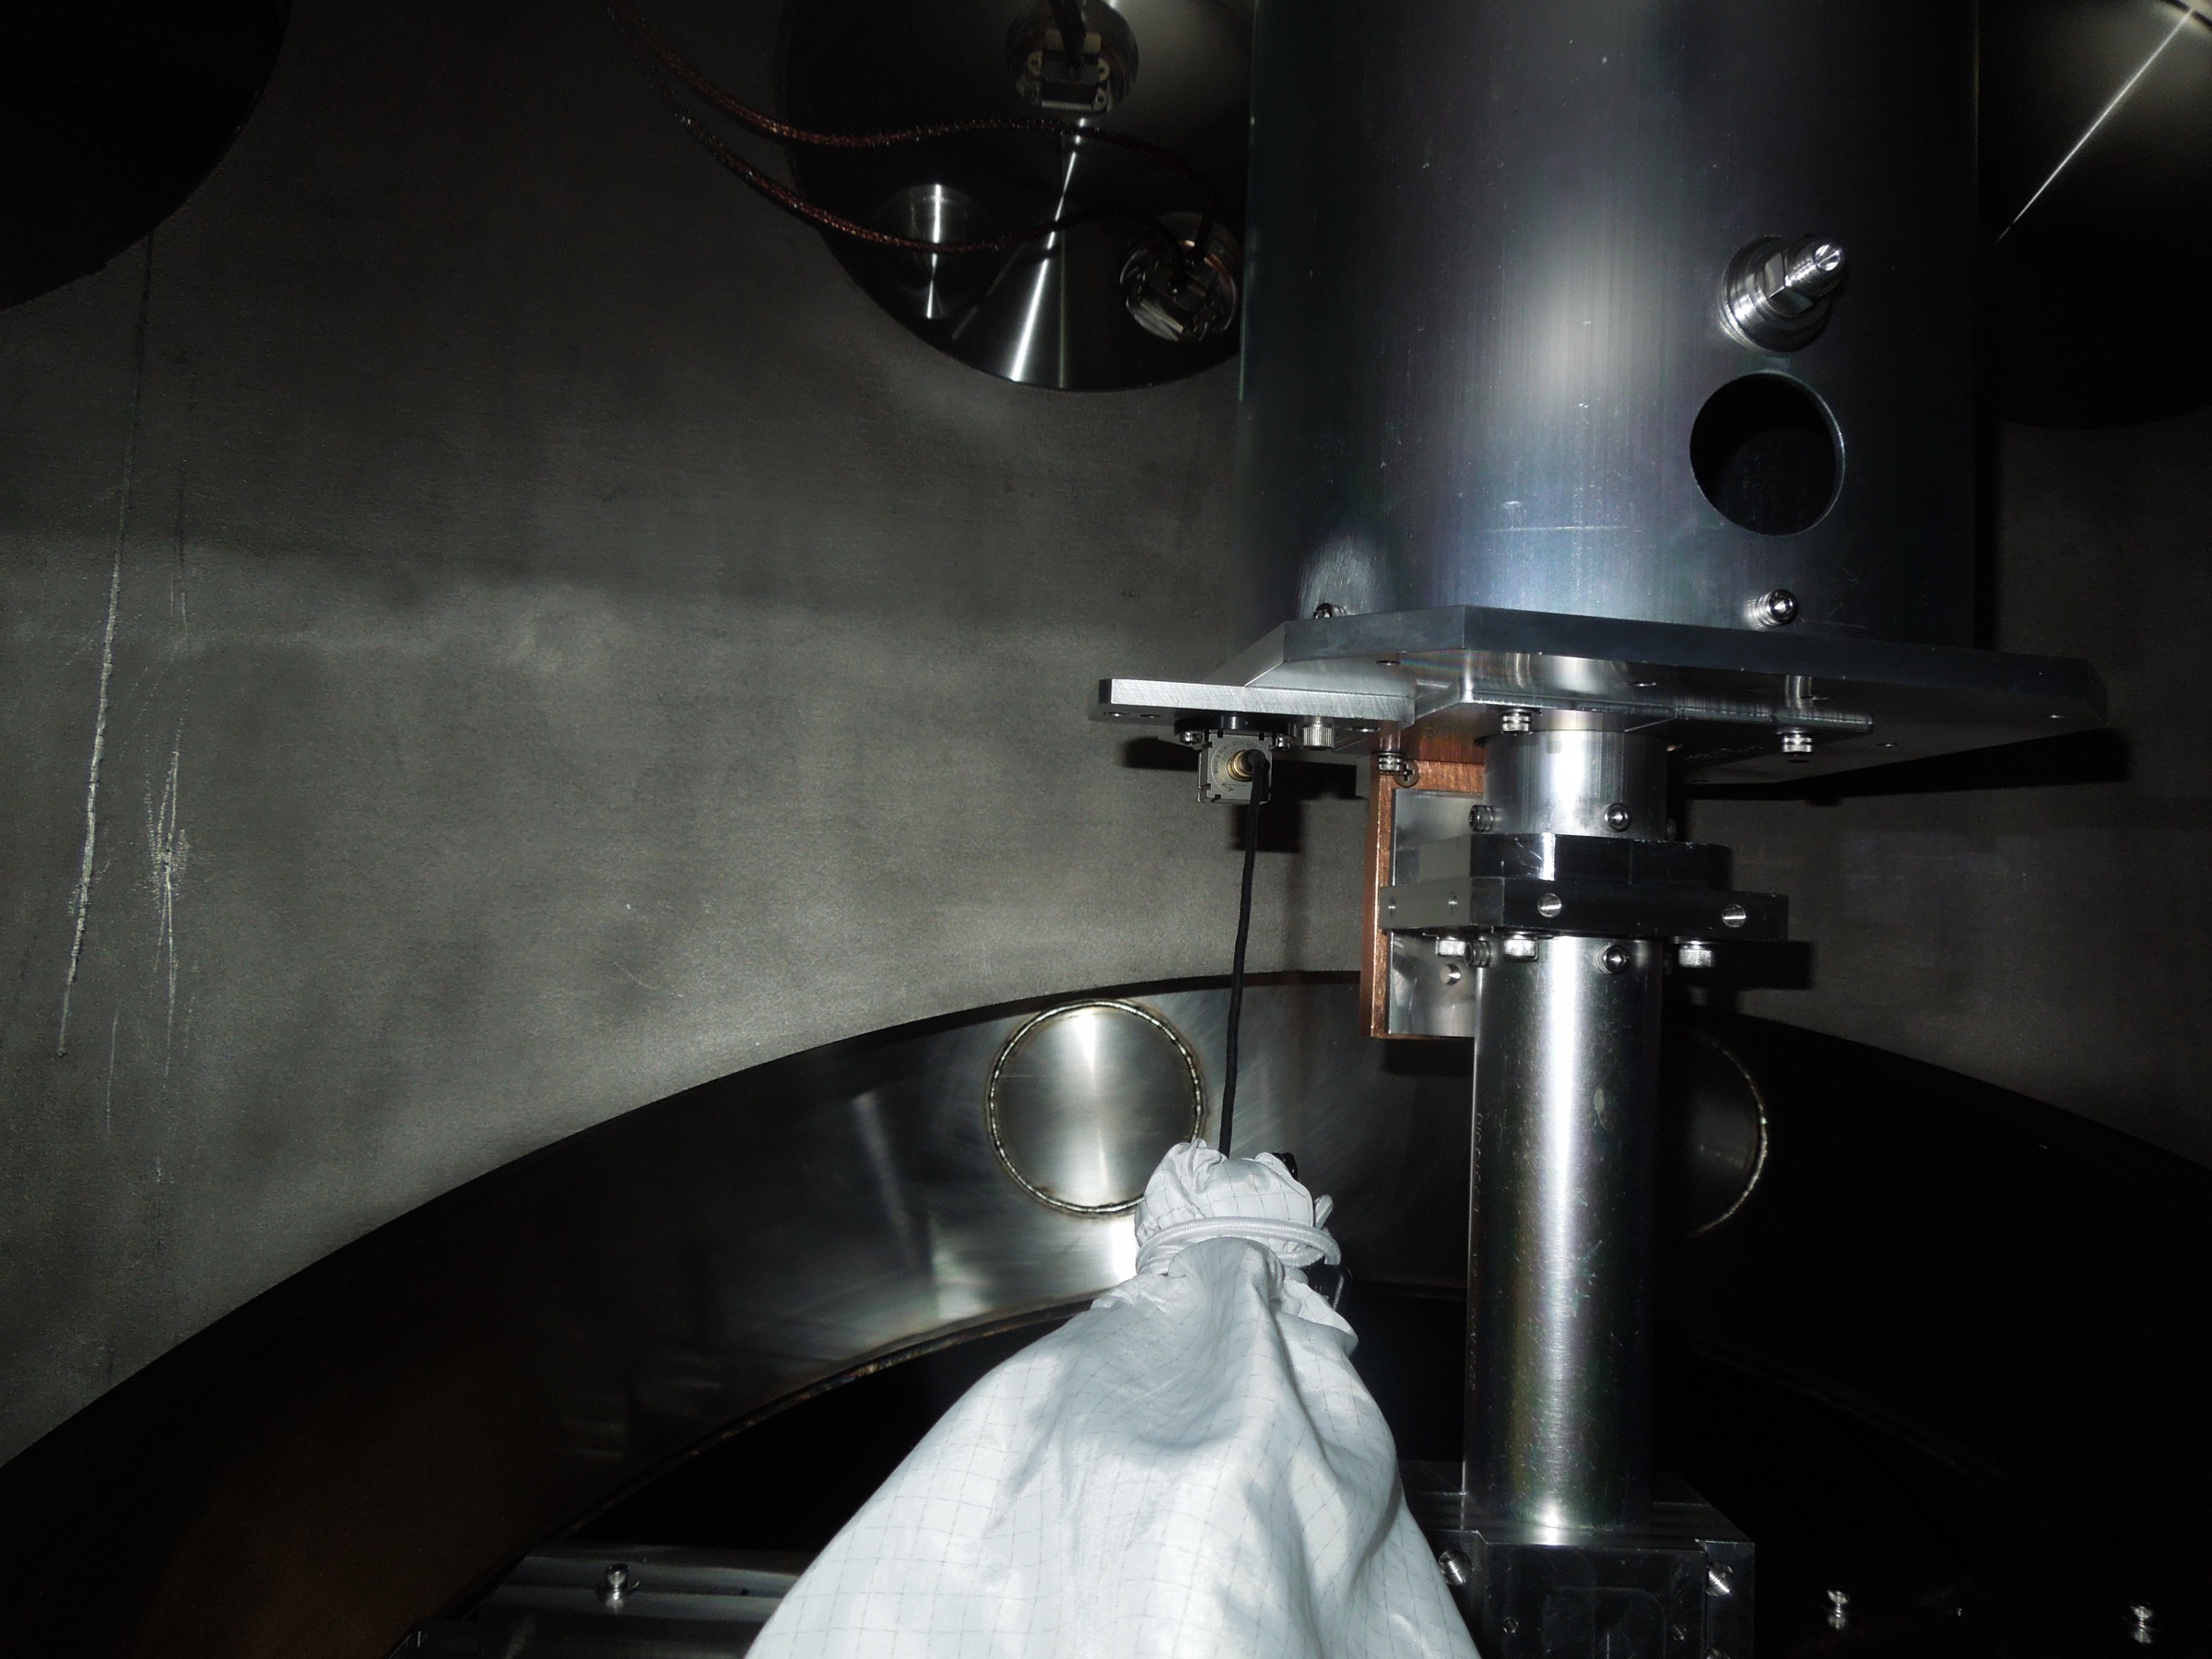
Stefan, Sheila and Kiwamu with remote assistance from Rich A. and Volker
The mysterious jump in the RF phase (see alog 7941) is now understood and fixed. It was due to a loose connection at DB15 connectors in the EOM box and not due to the SMA connector (see alog 8811 and 8813 for our early detective story). We applied two small in-situ modifications on the EOM box. As a result, now it doesn't show the mysterious RF jump any more.
The box:
I briefly explain the EOM box for those who are not familiar with our custom-made EOM box. The EOM box consists of two boxes -- one contains LC resonant circuits and the other contains the EOM crystal. This two-boxes-design allows one to tune the resonant frequencies by tweaking the LC circuits without messing up the alignment of the EOM crystal because one can simply take out the electronics box and leave the crystal box for solder or tuning some parts in the circuits. To apply voltage across the EOM crystal for normal operation, the LC circuits need to be connected to the EOM crystal. This is done by a DB15 connector attached on each box -- female DB15 on the crystal box and a male DB15 on the electronics box (see pictures shown below). In this way, the two boxes are electrically connected.
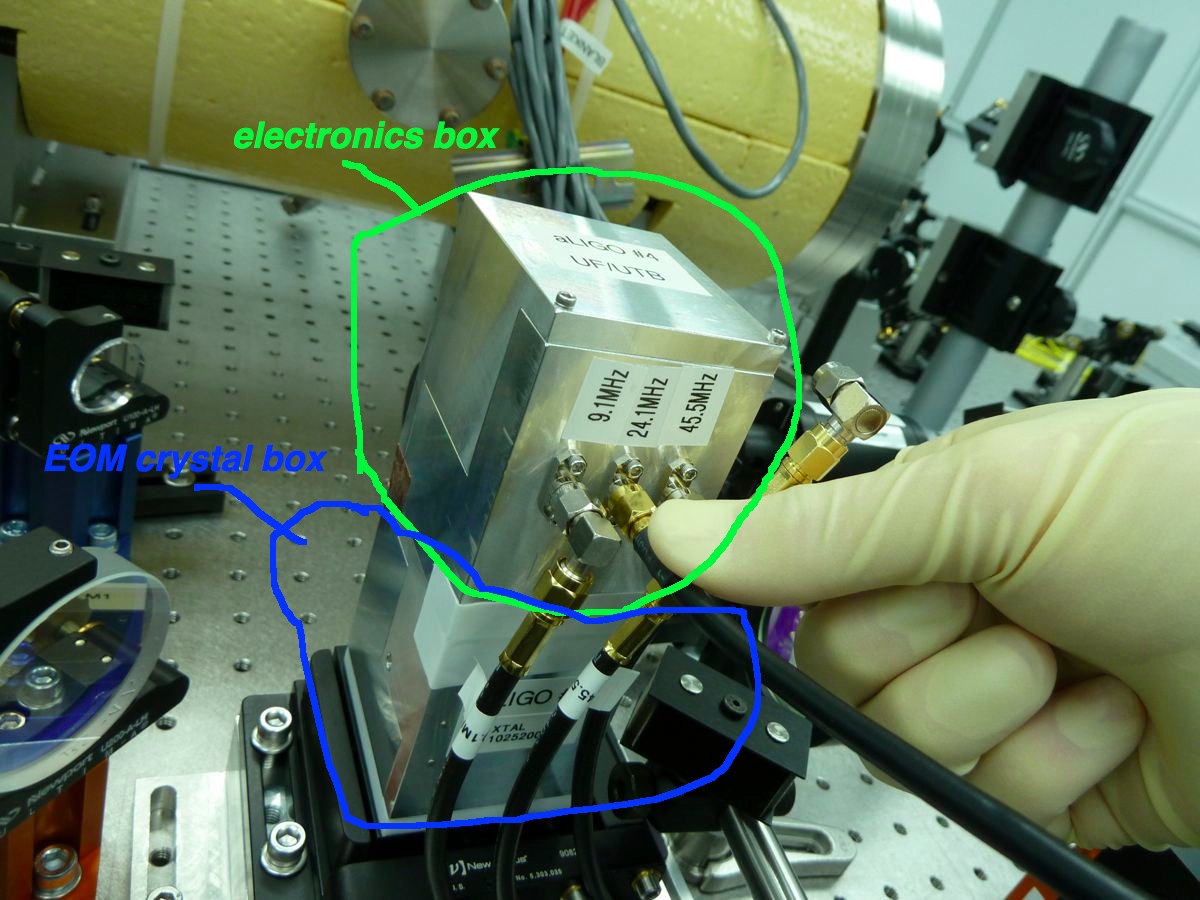
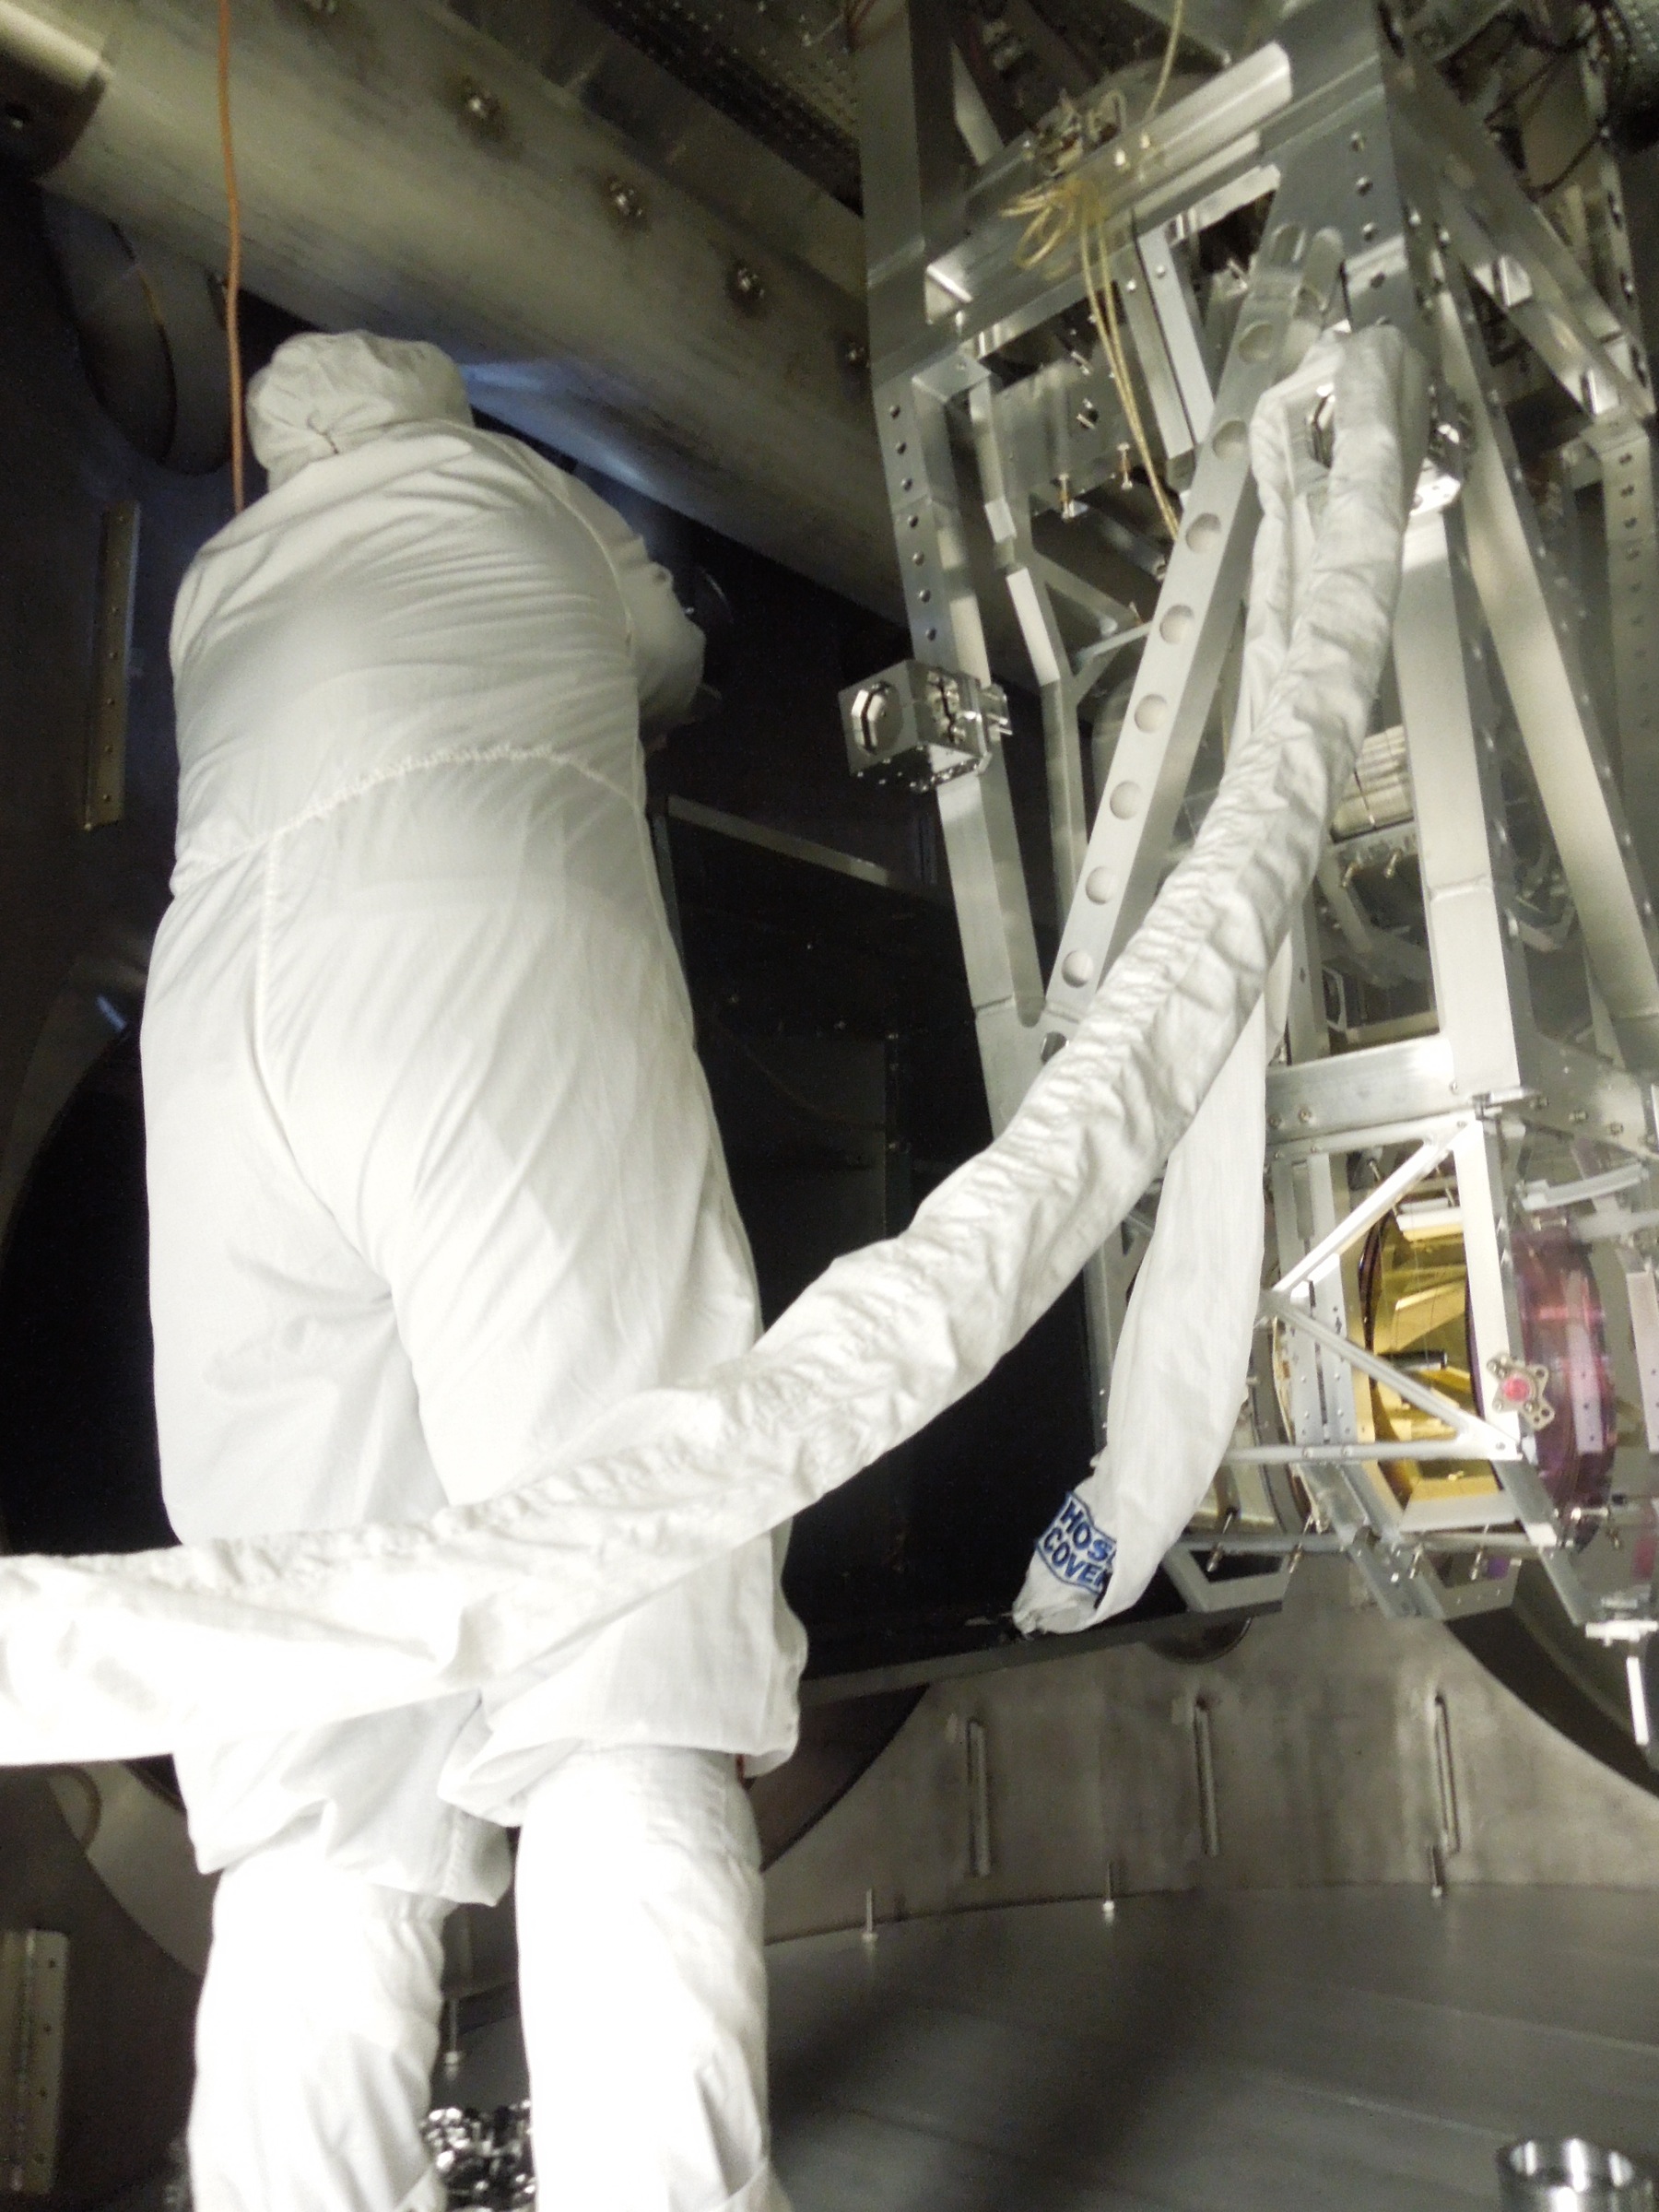
A picture of the actual EOM box. The gloved hand is me pressing the SMA downward in order to reproduce the RF jump.
When I pressed the SMA connectors downward in this morning, the RF characteristic of the EOM box changed as if something jumped. This was repeatable, although it seemed that the condition to make it jump was random -- occasionally, pressing the SMA didn't make it jump and sometime pushing the SMA toward the box made it jump. Anyways, at this point, it was clear that the EOM box was the culprit and not the RF cables.
The causes:
-
The mechanical connection between the two boxes was not solid.
-
The DB15 connectors were not completely all the way in.
-
The above two facts resulted in different amount of stray capacitance in the DB15 connectors depending on the relative orientation of the two boxes.
-
Though, this doesn't explain the bi-stable impedance modes we have observed. Maybe there was some sort of bi-stable condition in the physical orientations.
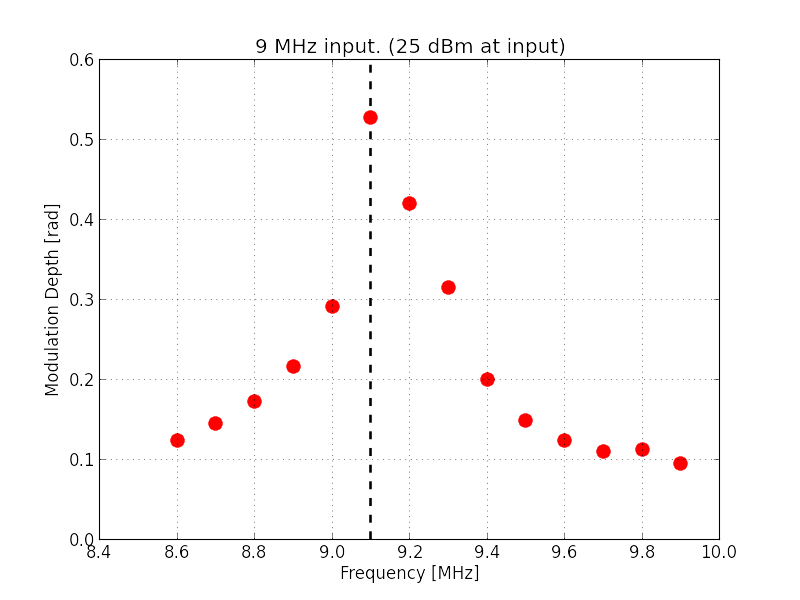
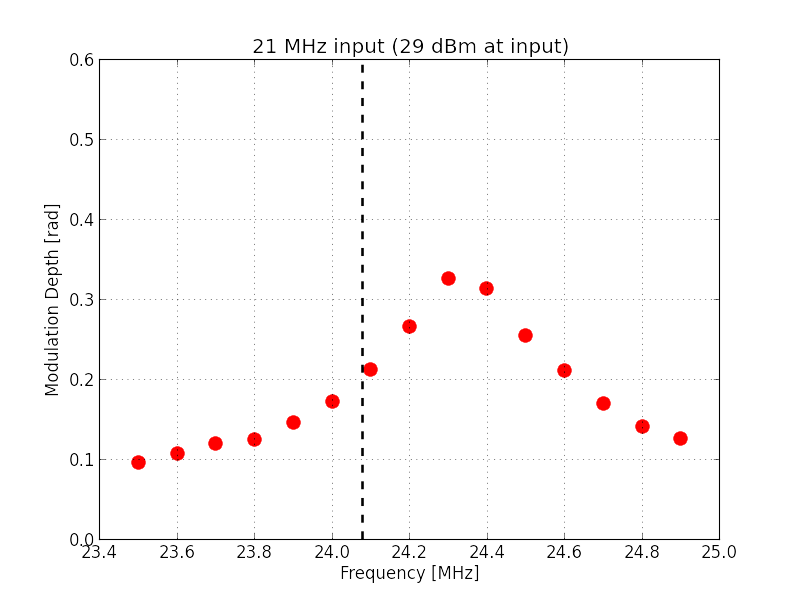
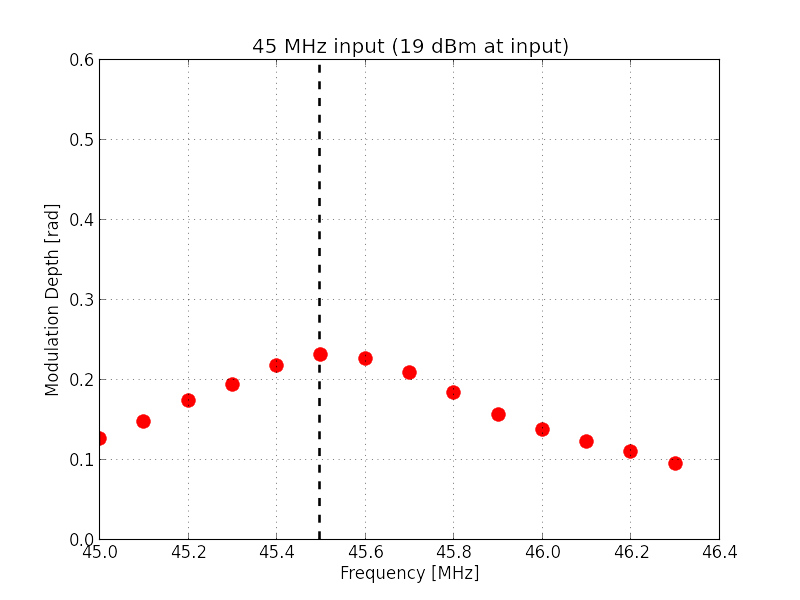
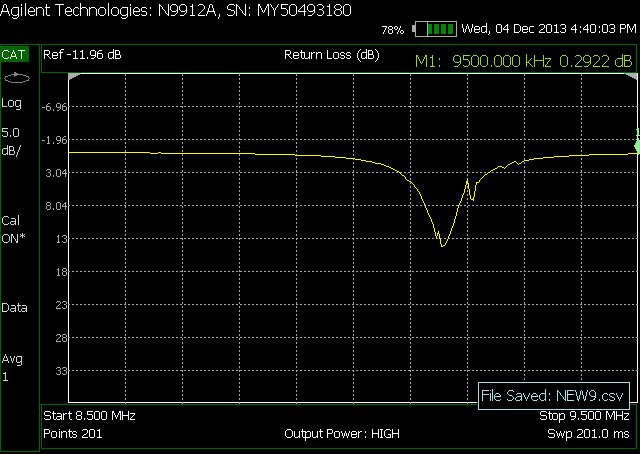
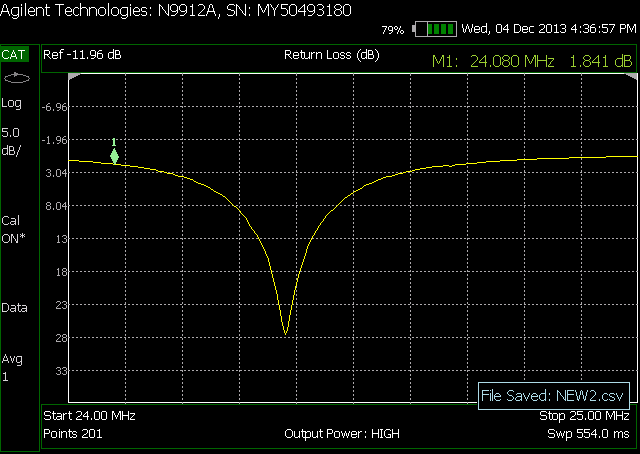
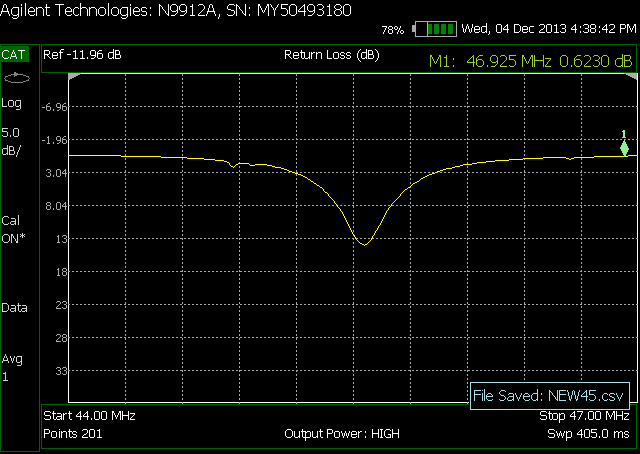
At the beginning, we thought the culprit was the SMA connectors (see alog 8811 and 8813). However, this turned out to be wrong as we investigated it further. With a remote assistance from Volker, Stefan and I took the electronics box apart from the crystal box while keeping the crystal alignment. In the process of removal, we found that the electronics box was attached to the crystal box merely by friction of the DB15 connectors and three pieces of adhesive tape. So the orientation of the electronics box was not so solid with respect the EOM box. We then checked the return loss of the LC circuits without connecting the EOM and confirmed that wiggling the SMA connector didn't change its impedance. Instead, we discovered that the DB15 connector can easily change the amount of its stray capacitance -- the frequency of the resonant notch could shift by approximately 1 MHz by very gently touching the DB15 connector with our latex-gloved-hand. We put the electronics box back on the EOM crystal box and wiggled the orientation of them. Indeed, it changed the resonant frequency by about 1 MHz in a discontinuous way. So we determined that the loose connection in the DB15 connectors was the culprit and the mysterious RF jump was induced by some change in the orientation of the two boxes.
It seemed that the DB15 connectors were not all the way in because the two aluminum boxes contacted first.
The repair/modification fixed the issue:
We did the following two repair/modification:
-
We put washers in the DB15 connector of the electronics box to make the connector stick out a bit more.
-
We introduced four screws to mechanically tighten the connection between two boxes.
The DB15 connector have two screws to support it and we put a washer for each screw. They raise the height of the DB15 connector like shims. Also, we newly installed four screws to make the connection of the two boxes more solid. There were already four screw holes on each box to accommodate them. So we just installed them. After these modifications, we checked the return loss of all three RF ports. We didn't observe the mysterious jump at all, even when the electronics box was wiggled hard. Of course, strongly pressing the electronics box downward shifts the notch position by an order of 10 kHz due to the change in the stray capacitance at the DB15 connectors, but the shift is smooth and not in a discontinuous way any more. So the RF jump issue is now solved.
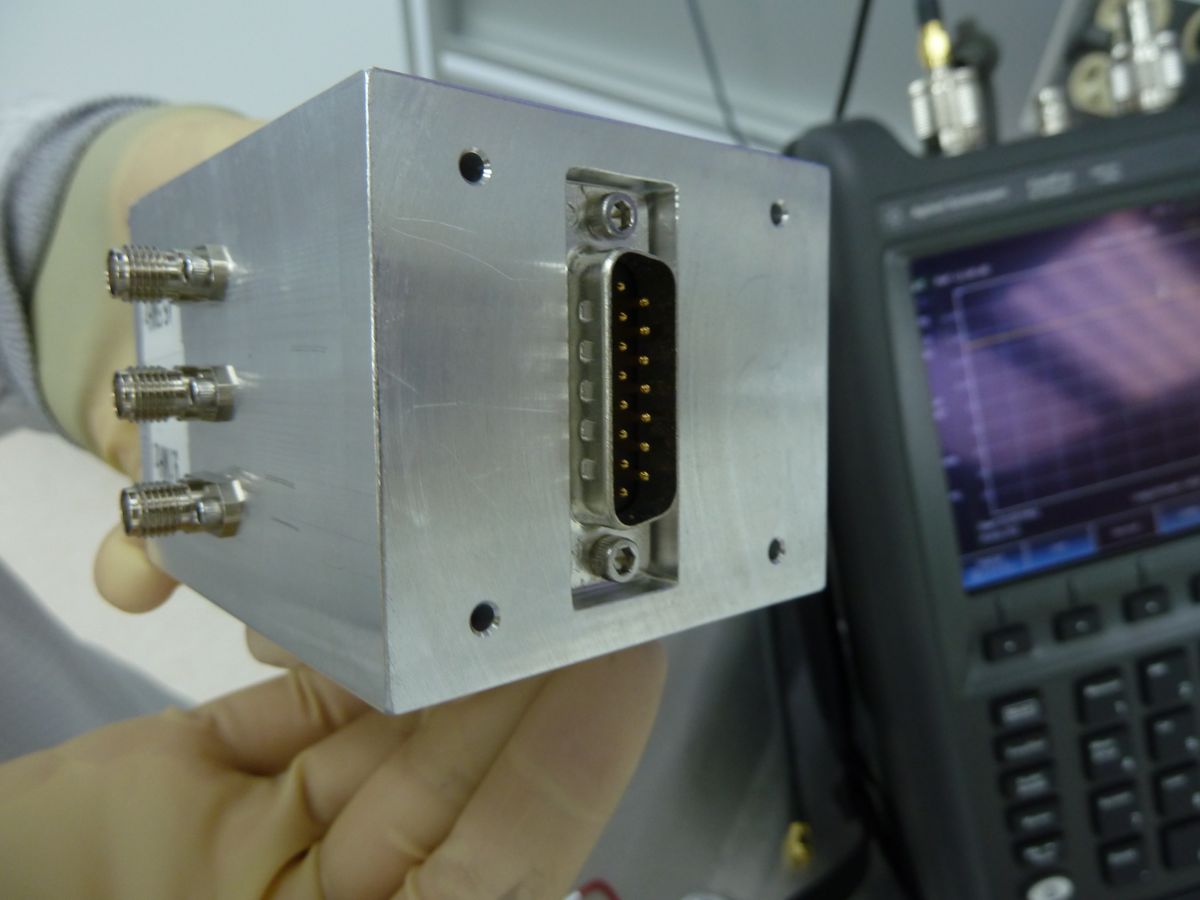
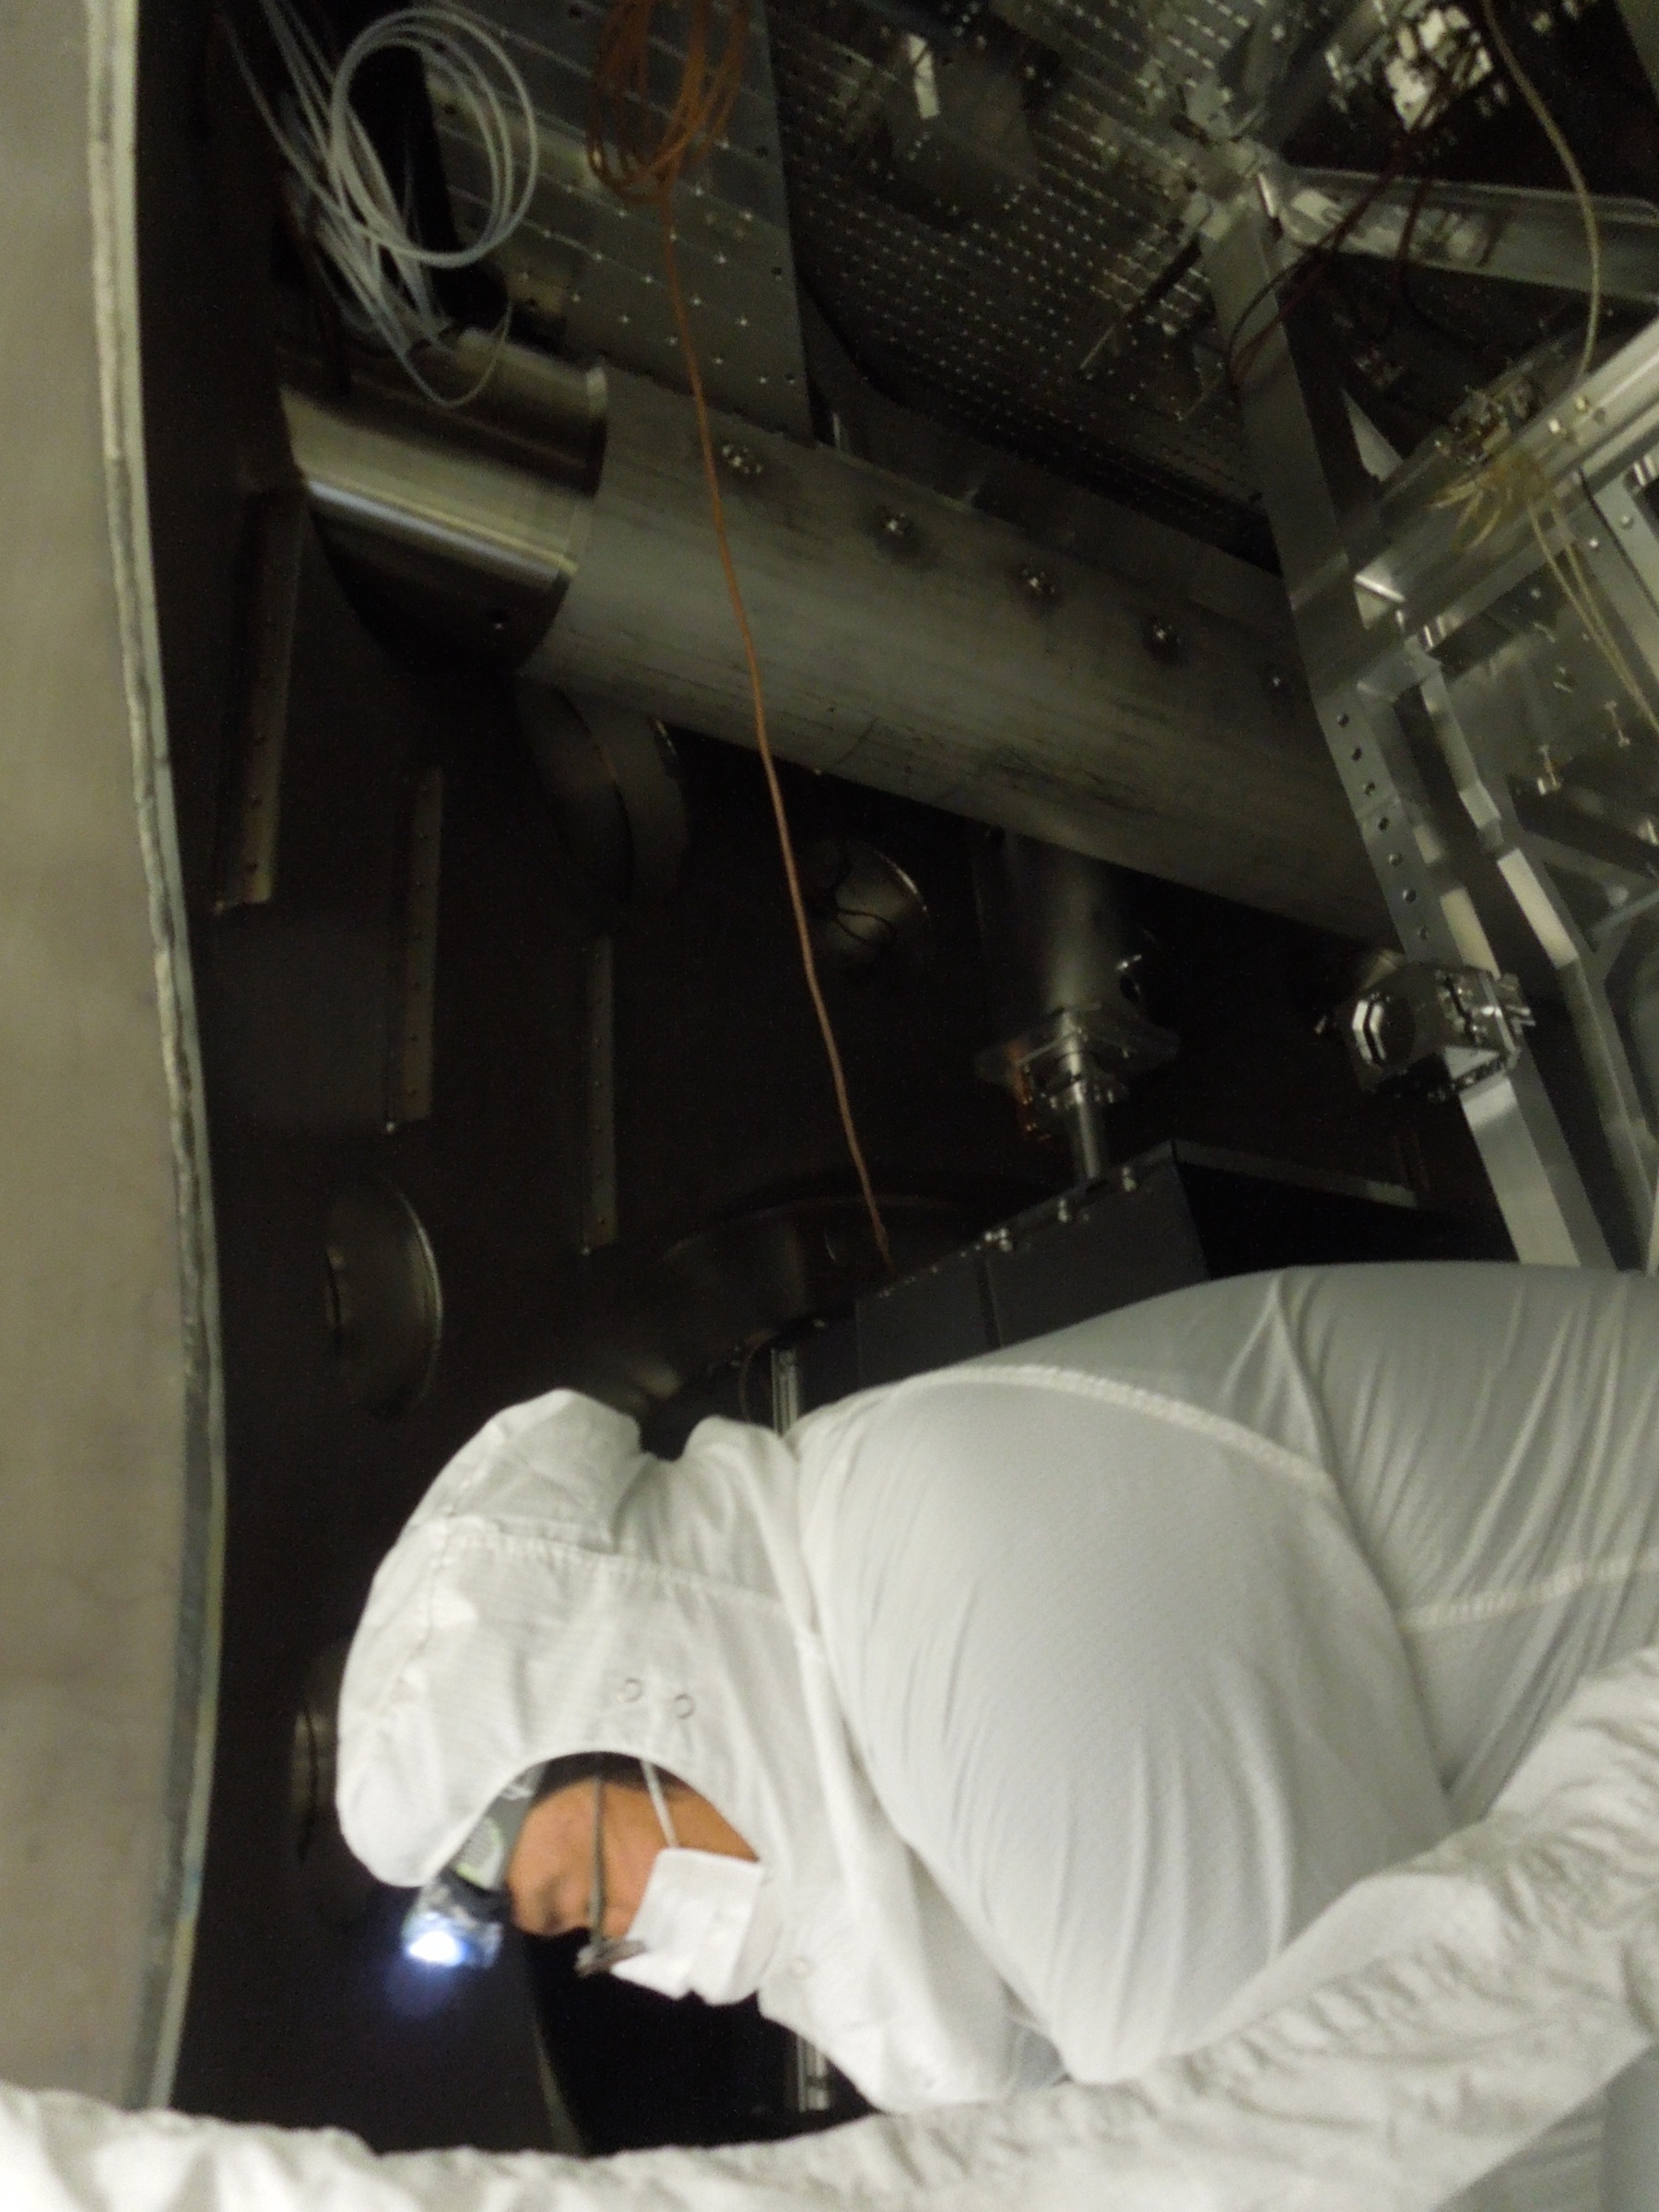
A picture of the electronics box when apart from the EOM crystal box. This DB15 connector was shimmed by washers.
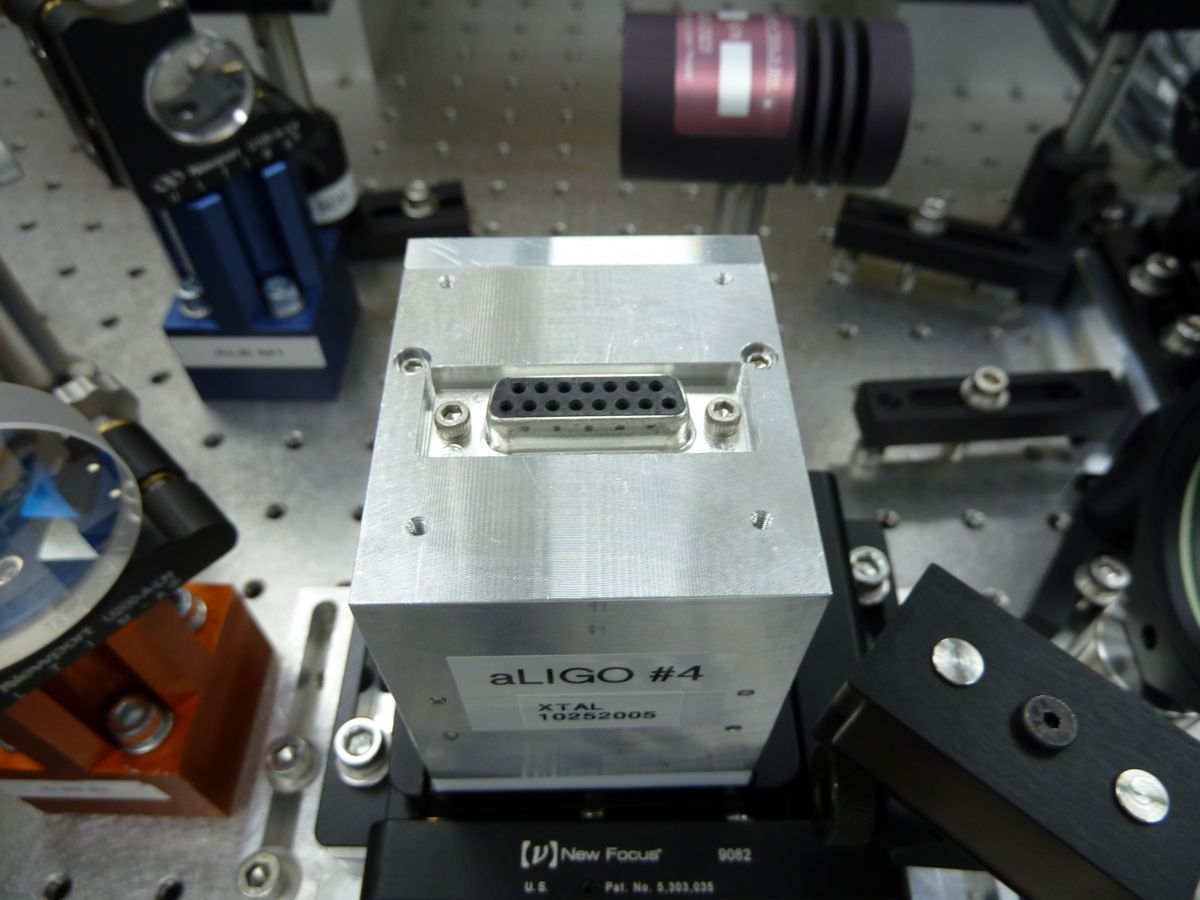
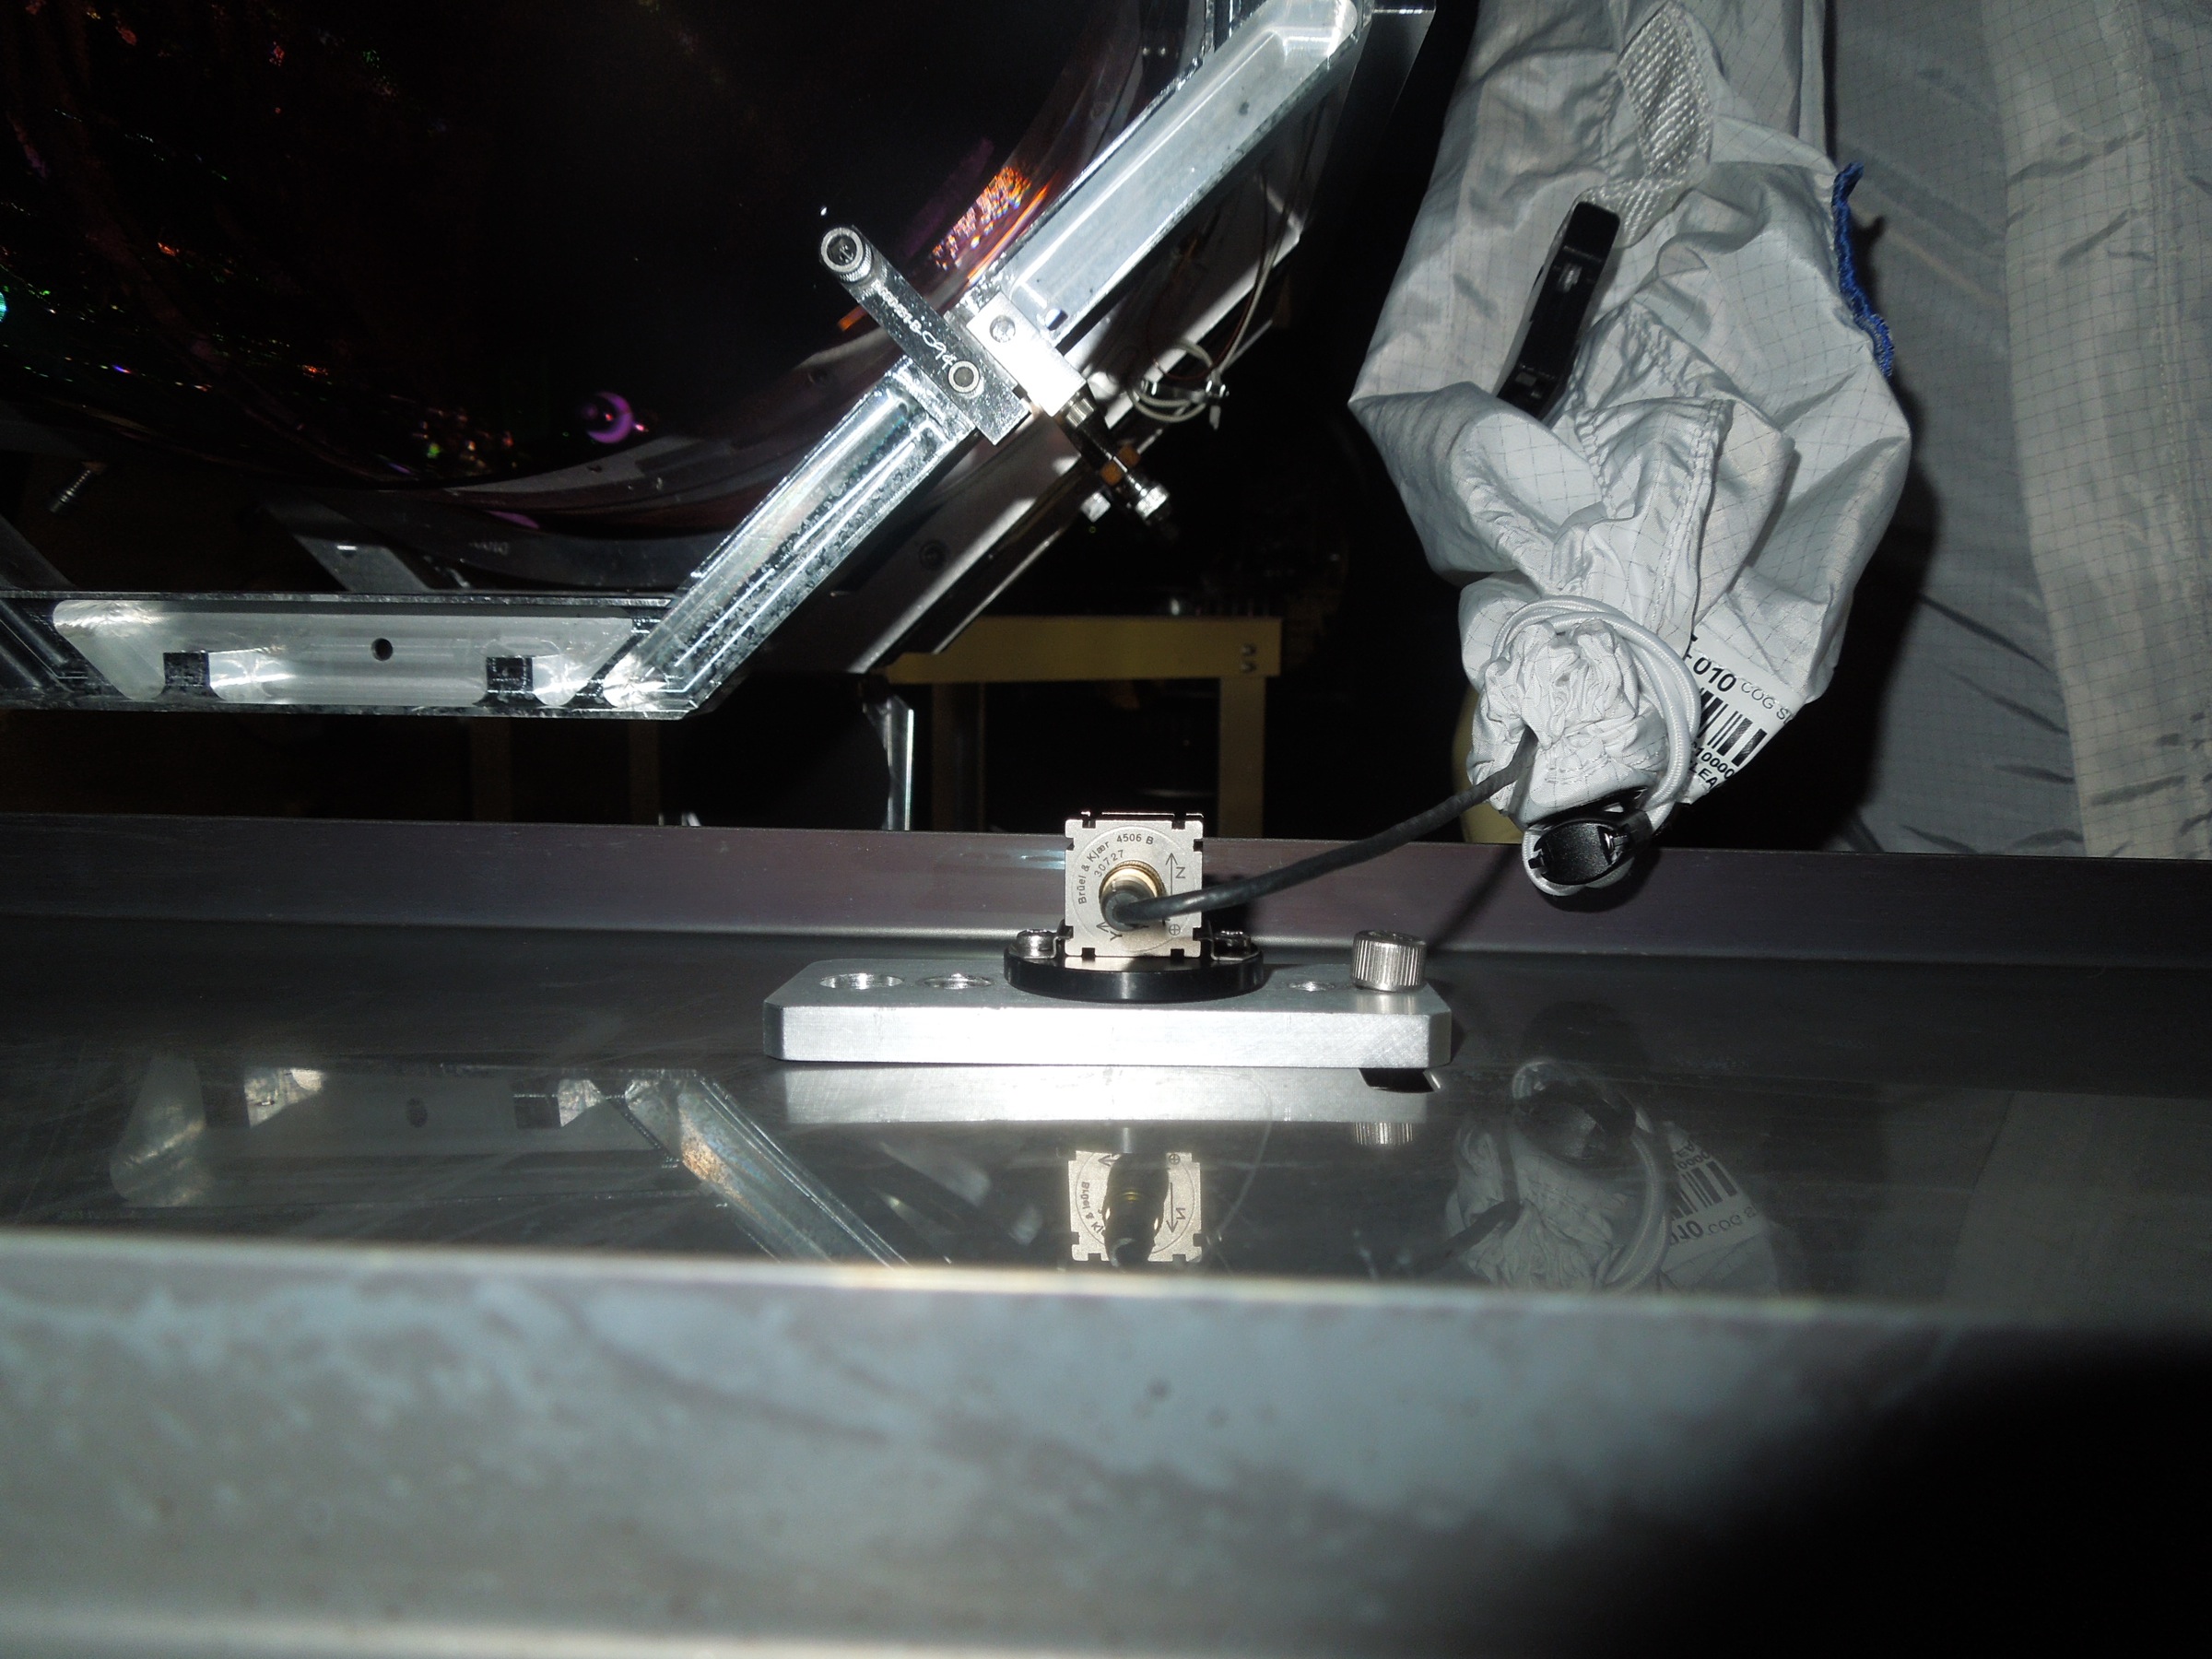
A picture of the EOM crystal box when the electronics box is taken away. There is a threaded screw hole on each corner and these are the ones we used for installing the new screws.
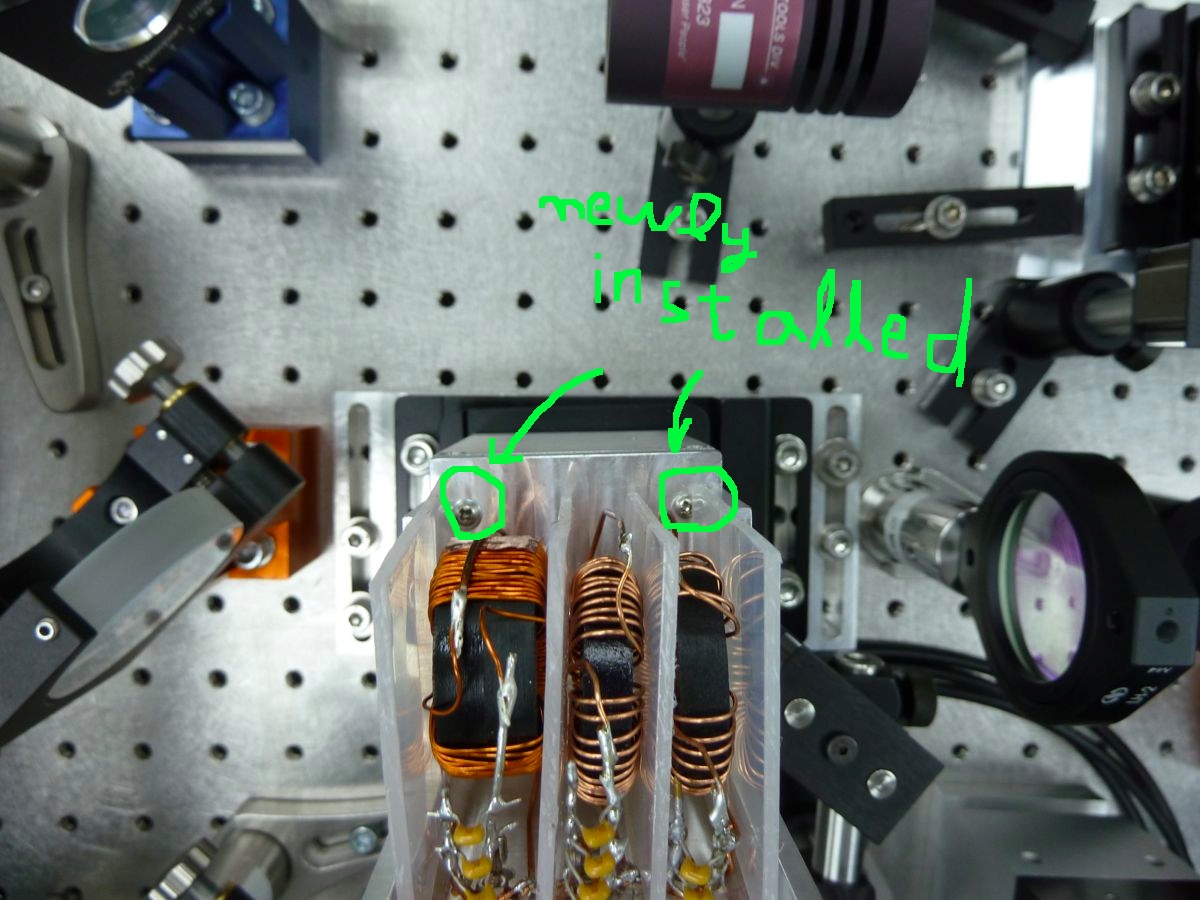
A top view of the EOM box with the lid off. The green circles indicate the screws that we newly installed.
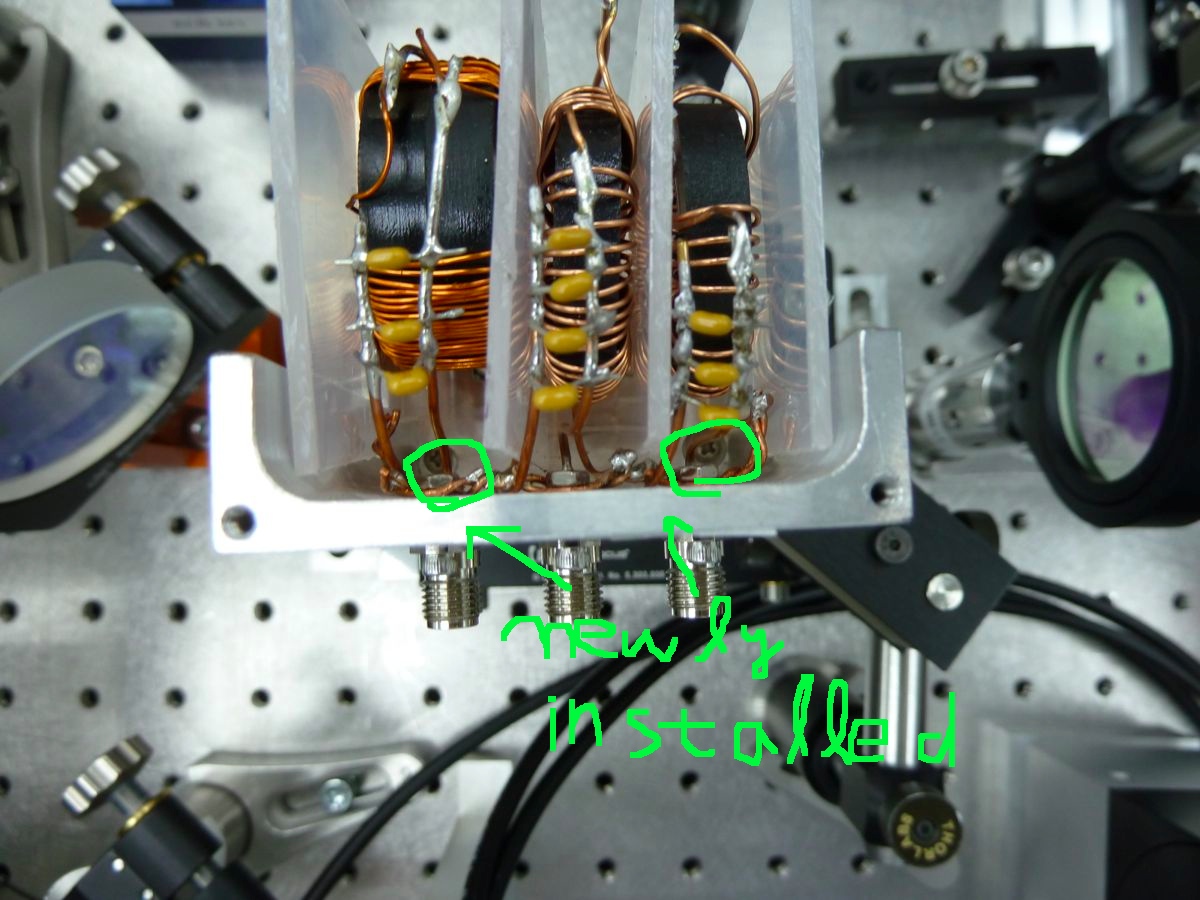
A top view of the EOM box with the lid off. The green circles indicate the screws that we newly installed.