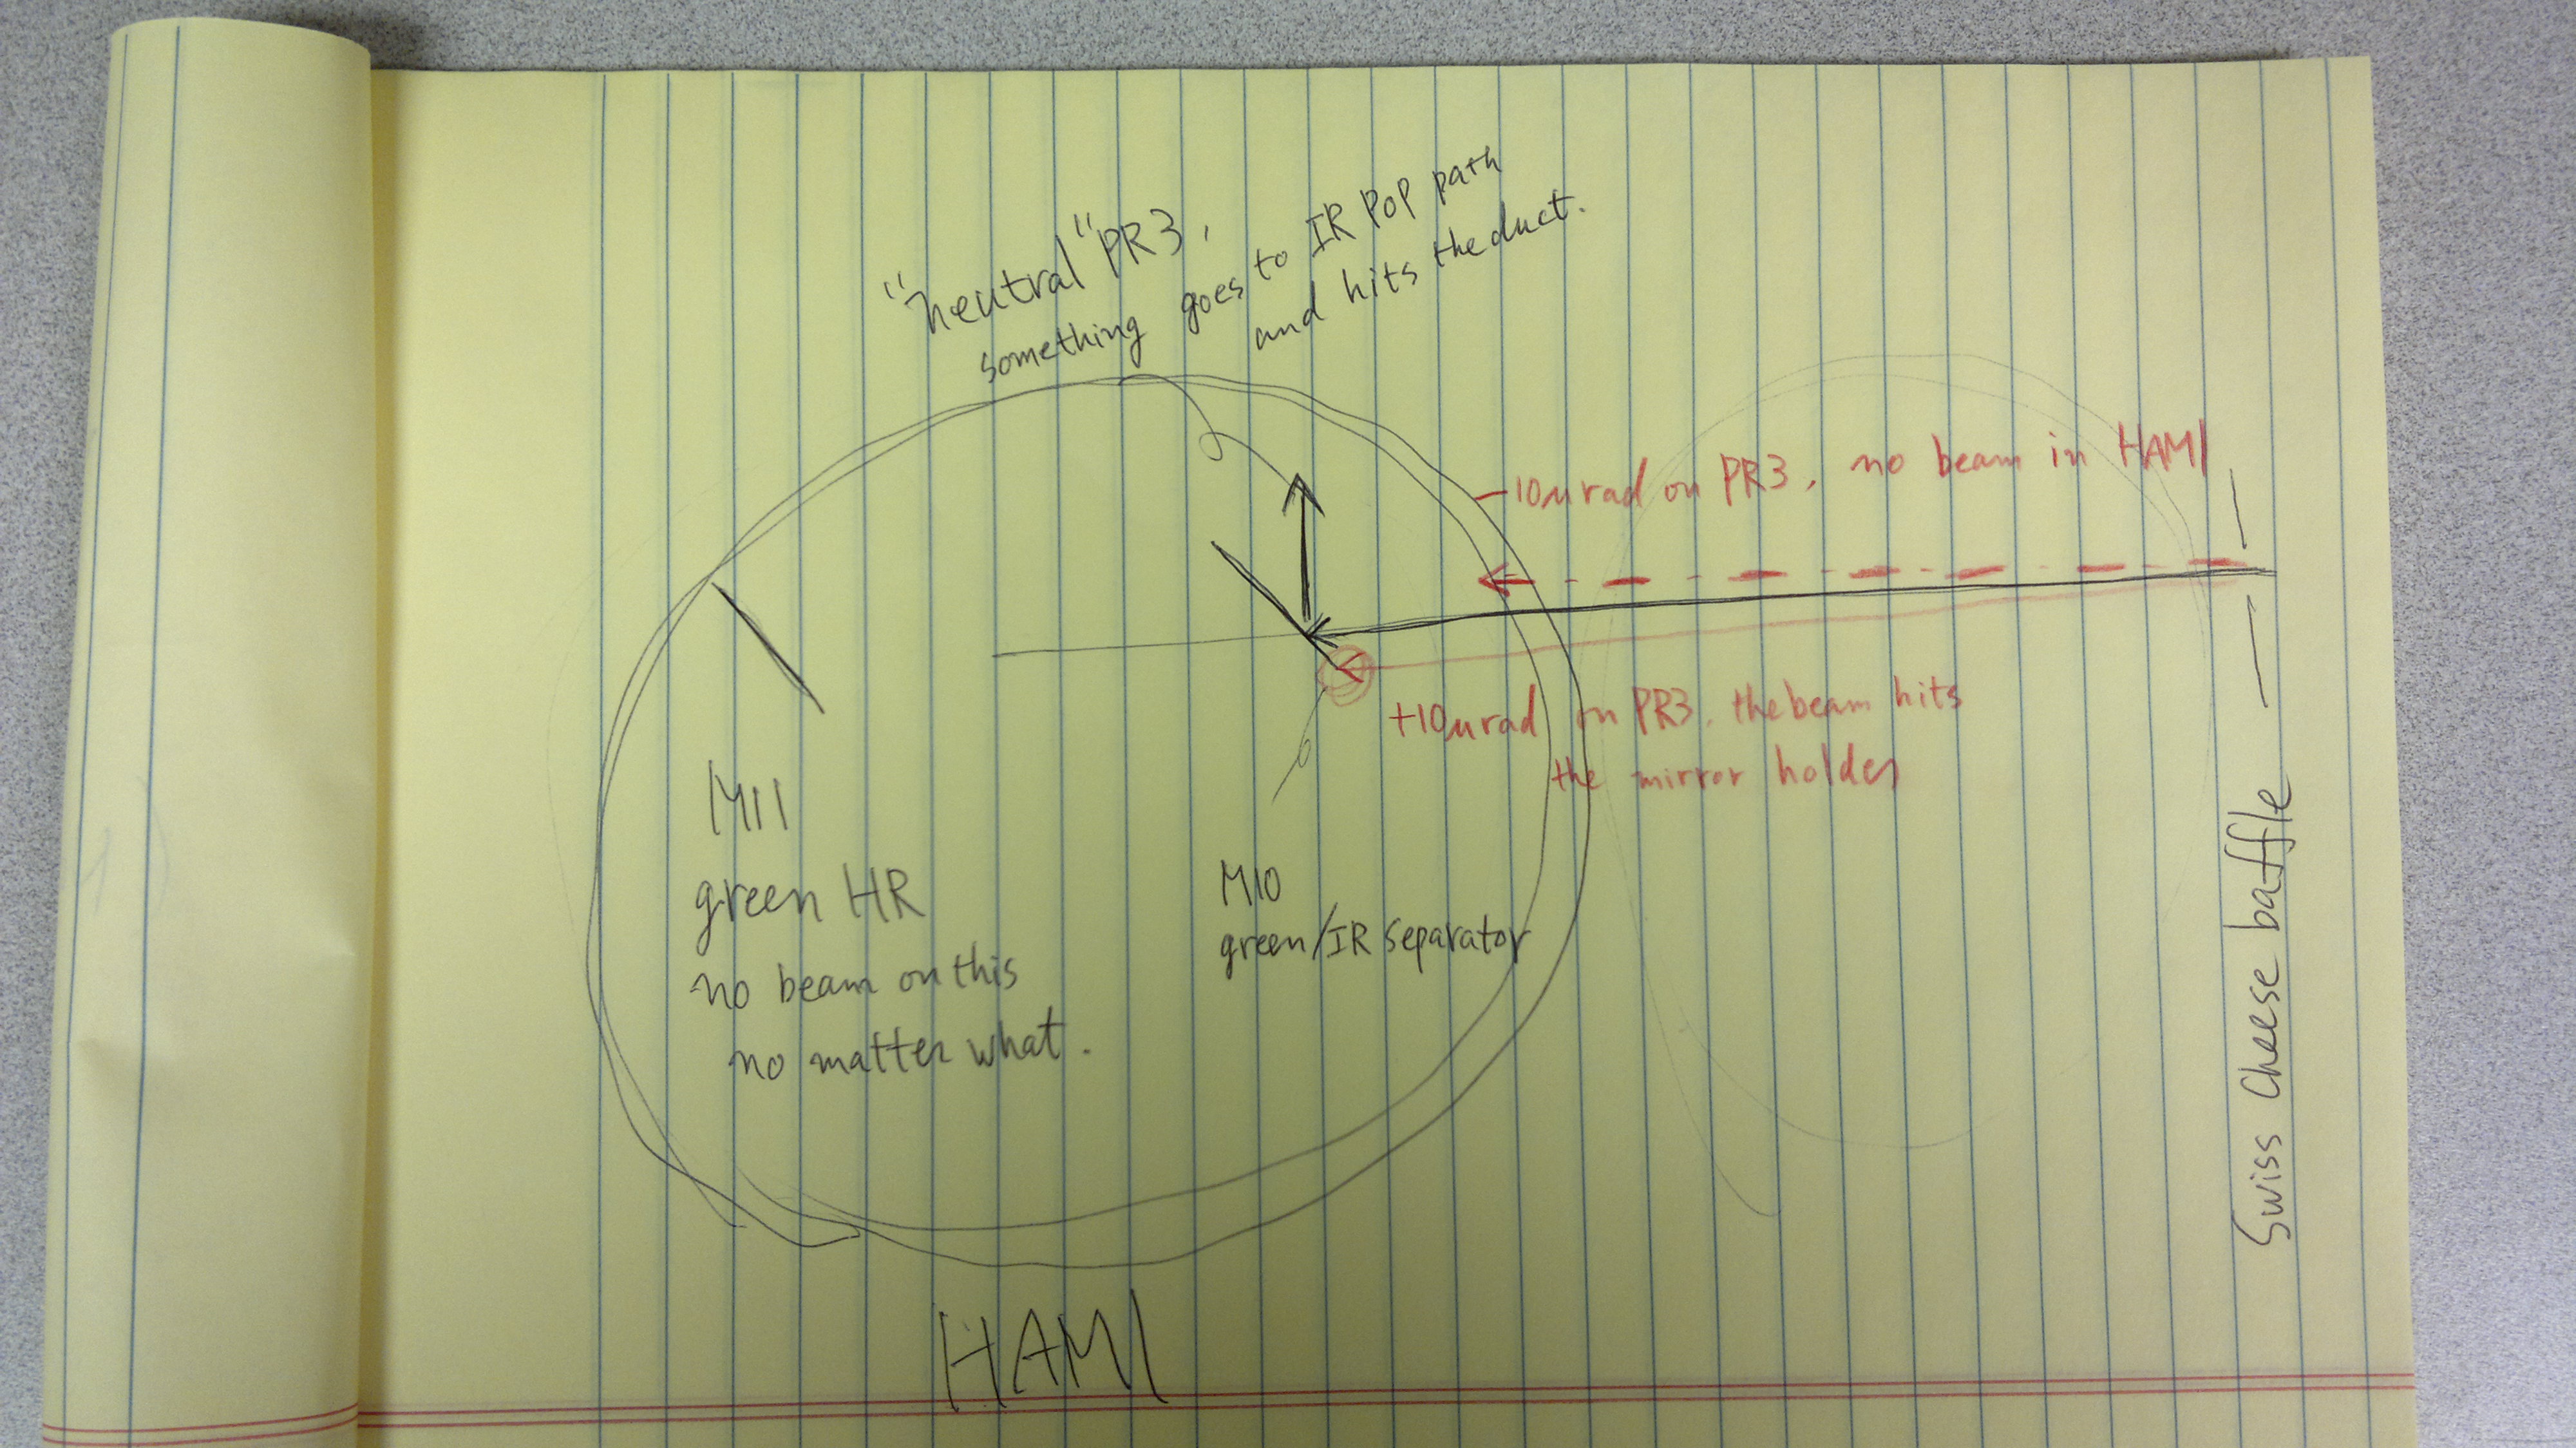
Green arm transmission was first found on the Swiss cheese baffle while scanning PR3.
After centering the beam on the POP hole in the baffle (PIT was already good, YAW was off by 86urad), we looked inside HAM1 and found that the beam was already coming in that chamber. The beam was hitting somewhere on the green/IR separator M10, and some scattering or maybe specular reflection was hitting the beam duct of IR POP path, but nothing seemed to be hitting the green steering mirror M11.
Turning PR3 by +10urad in YAW and the beam was already blocked on the mirror holder of M11.
Turning PR3 by -10urad in YAW and the beam was nowhere to be found in HAM1, and we couldn't identify where the beam is blocked in HAM2, but it kind of seems from one of the GigE cameras that the beam might be blocked by one of the MC towers.
See attached if this helps.
Right now PR3 is set to the "neutral" position where the beam is centered in the baffle hole, but probably that's not the right thing to do (because the space between MC1 and MC3 tower gives us a tight aperture in YAW). We'll go in HAM1 tomorrow to find a right solution.
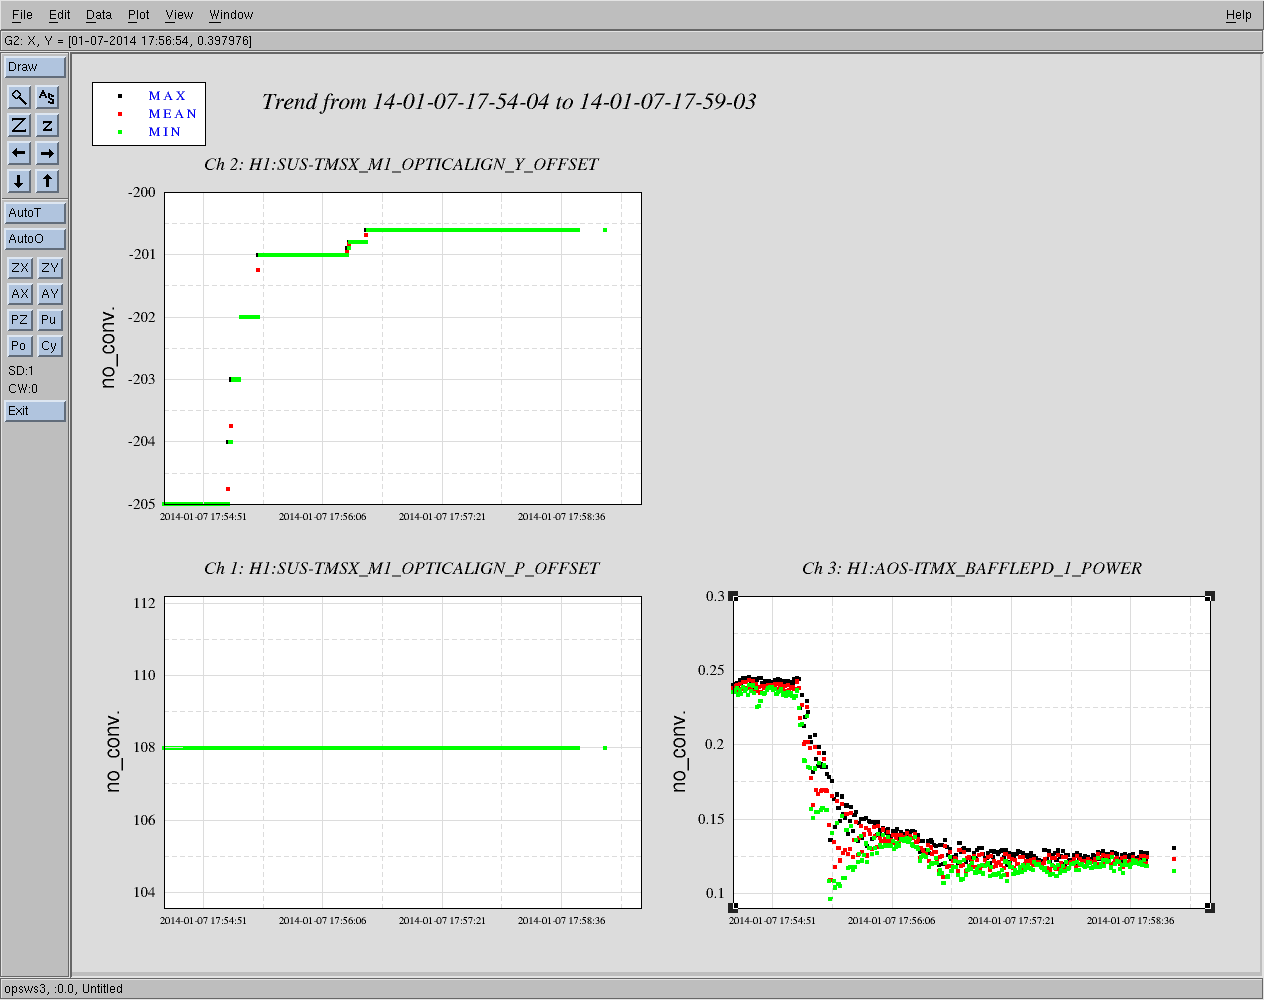
One positive thing is that it seemed as if we're locked to 00 mode.
However, refl power is supposed to drop to 45%-ish in an ideal case, we're only getting 90% or so, and our mode matching cannot be that bad (see earlier alog), so the alignment is far from ideal (Kiwamu and Sheila confirmed that no dither was used for aligning it).