kiwamu.izumi@LIGO.ORG - posted 06:07, Wednesday 04 December 2013 (8807)
further alignment of IMC
Sheila and Kiwamu
We improved the clipping of the IM1 trans beam by moving the uncontrolled degree of freedom in the IMC alignment control.
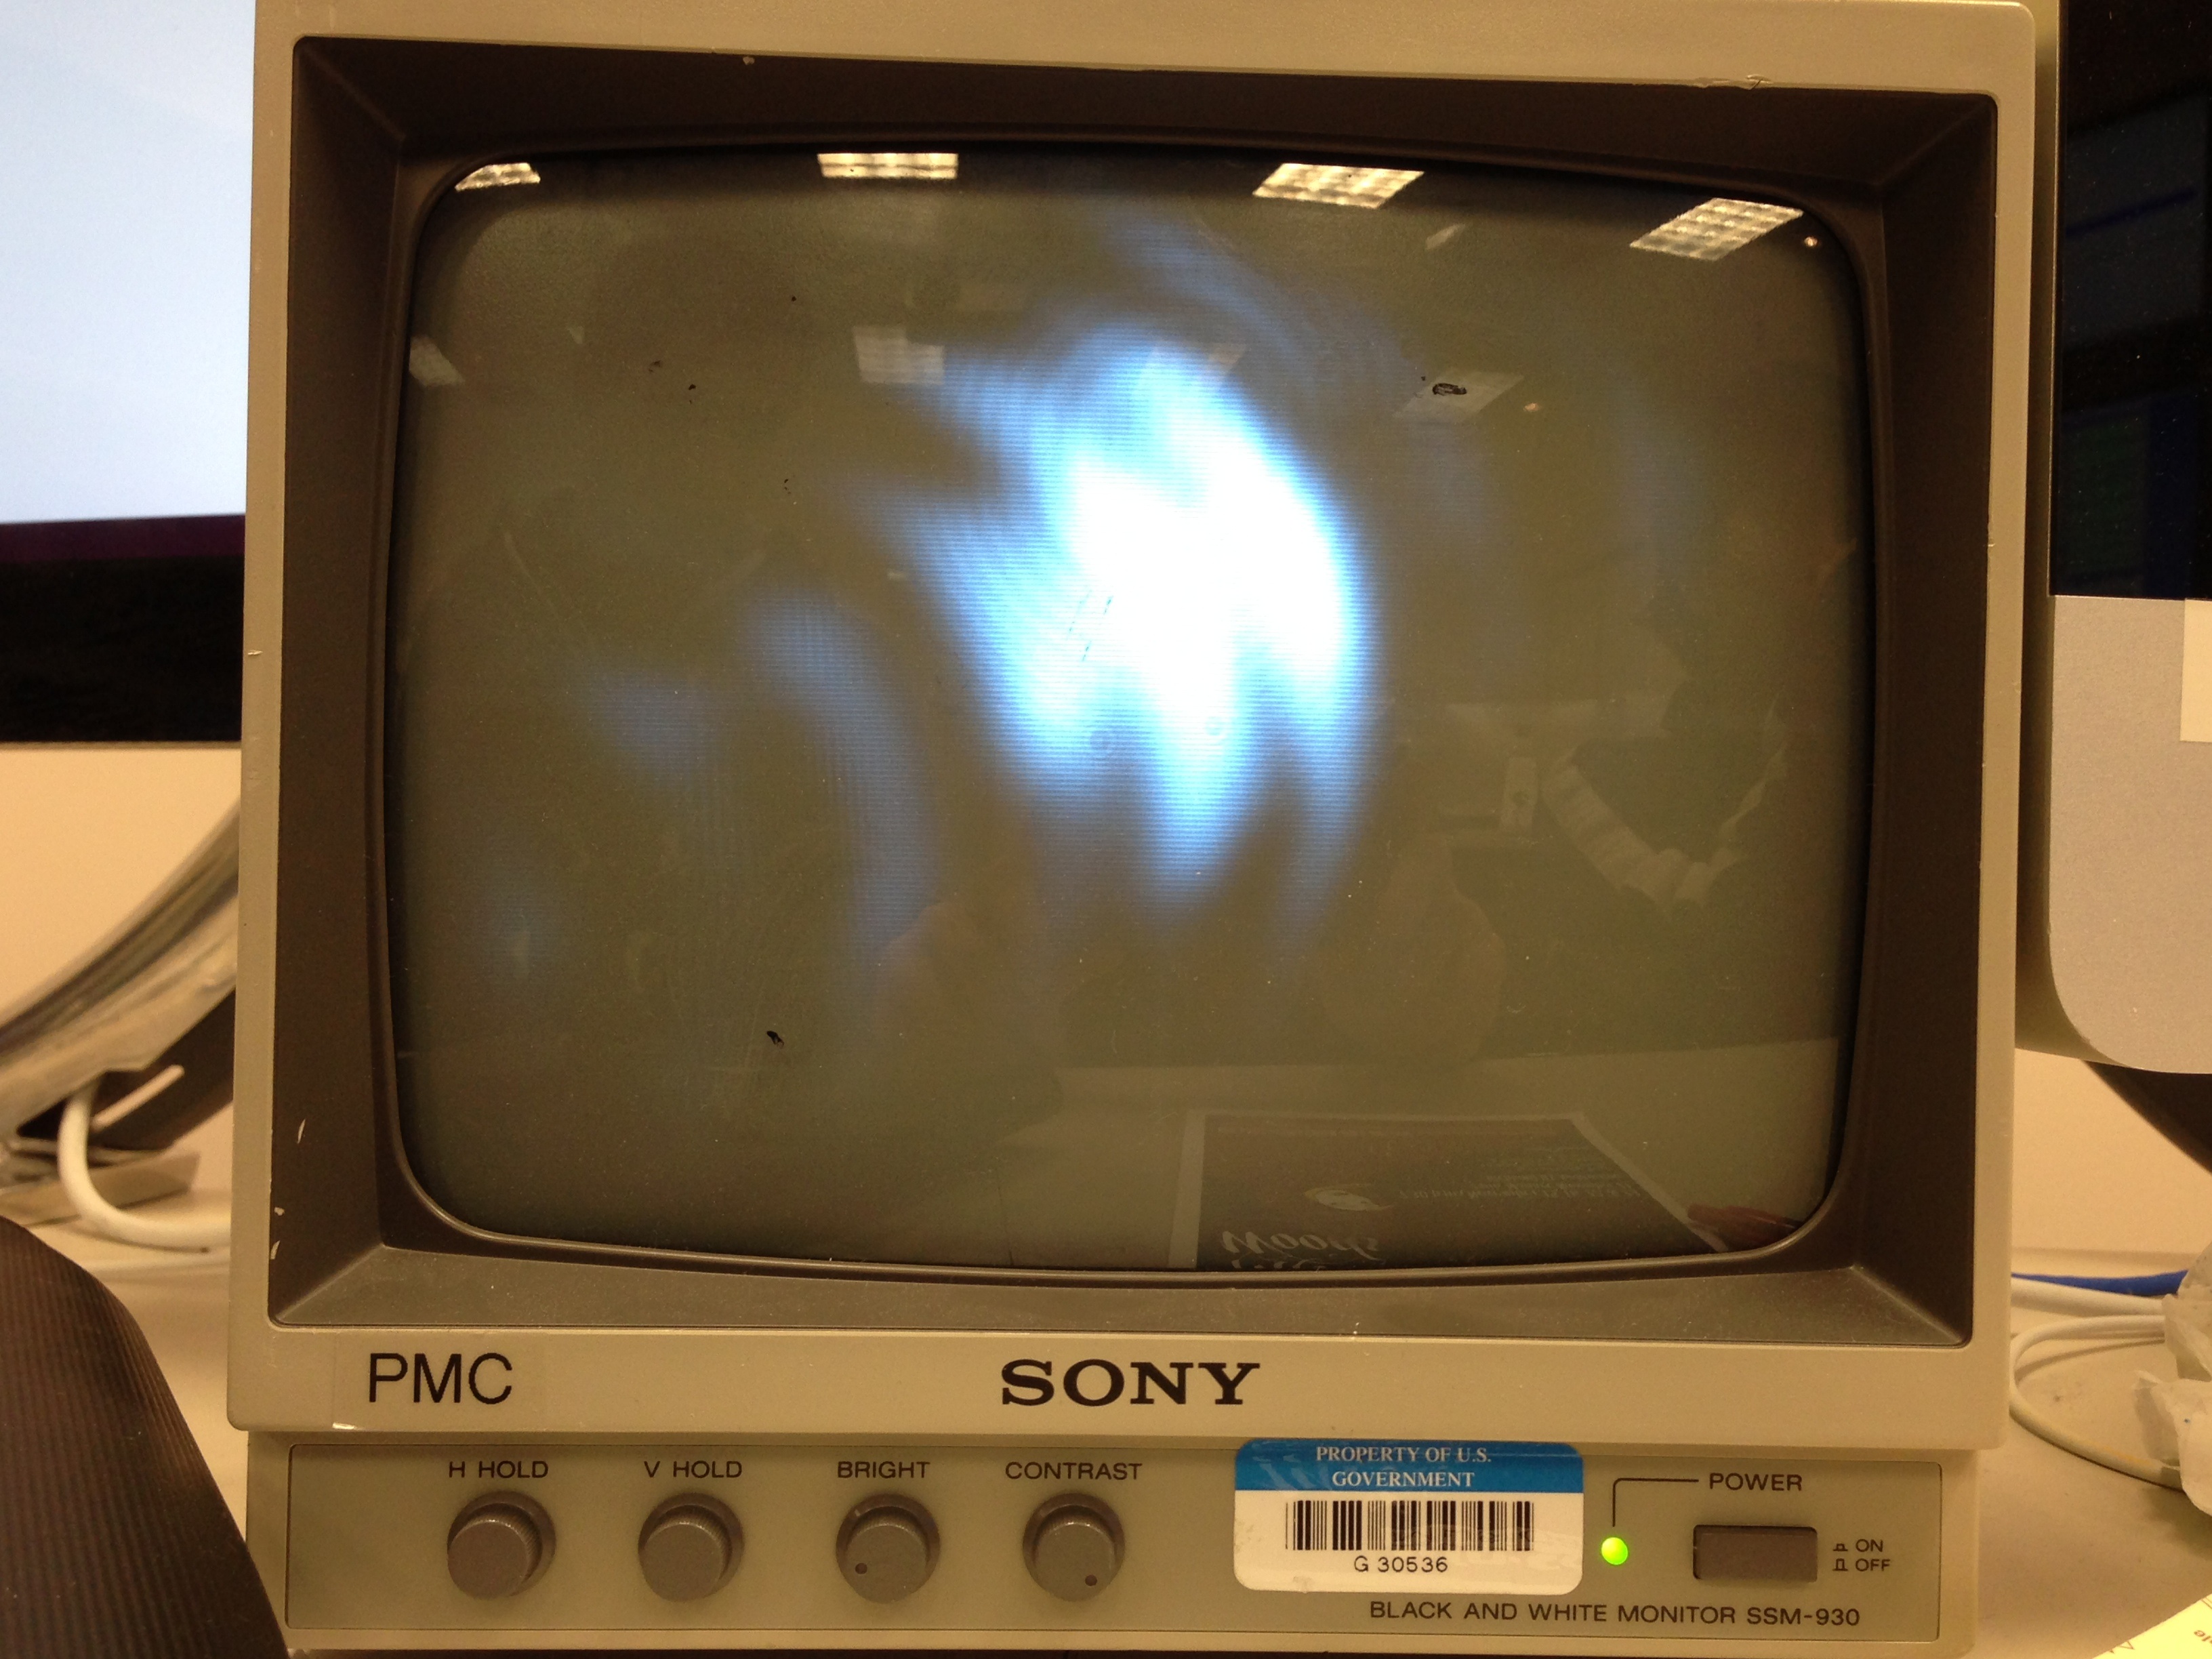
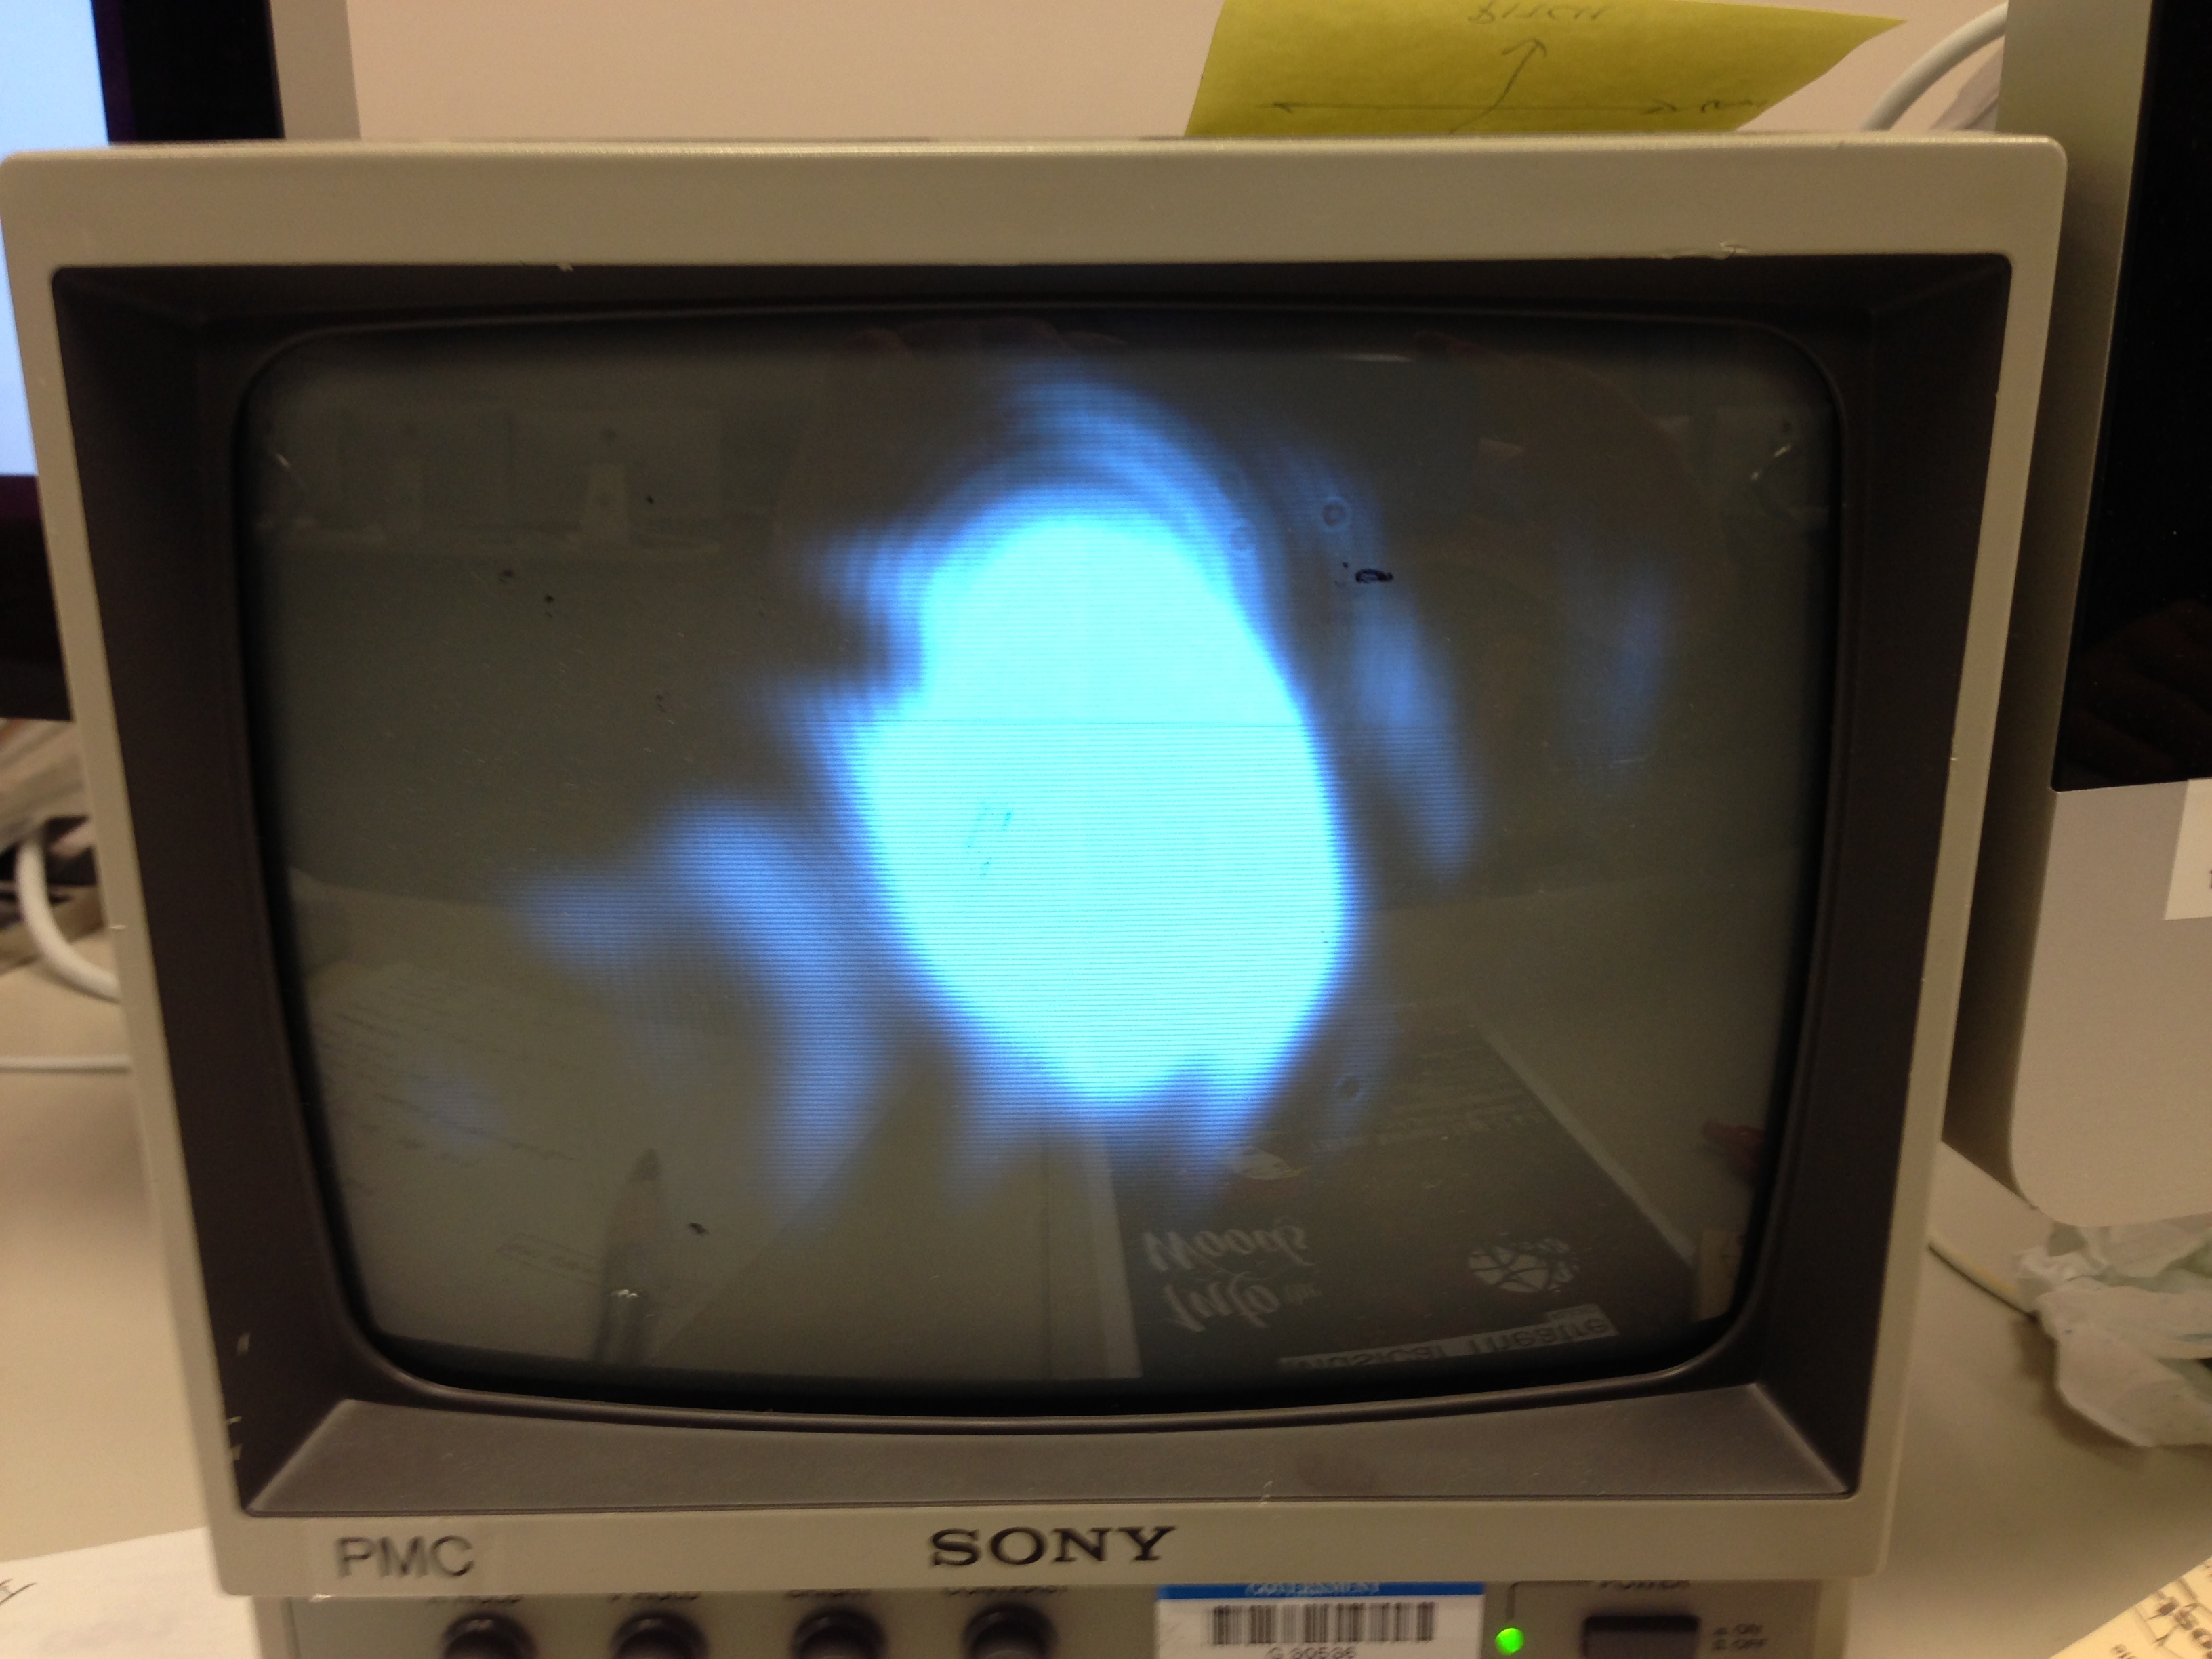
As a result, the amount of the light detected at the trans PD went up from about 240 counts to more than 800 counts. Also the beam shape on the camera became more round-looking.
The clipping was mainly in yaw. The shift we introduced was visible in the IM4 trans QPD. The spot moved in yaw from -0.3 to 0.
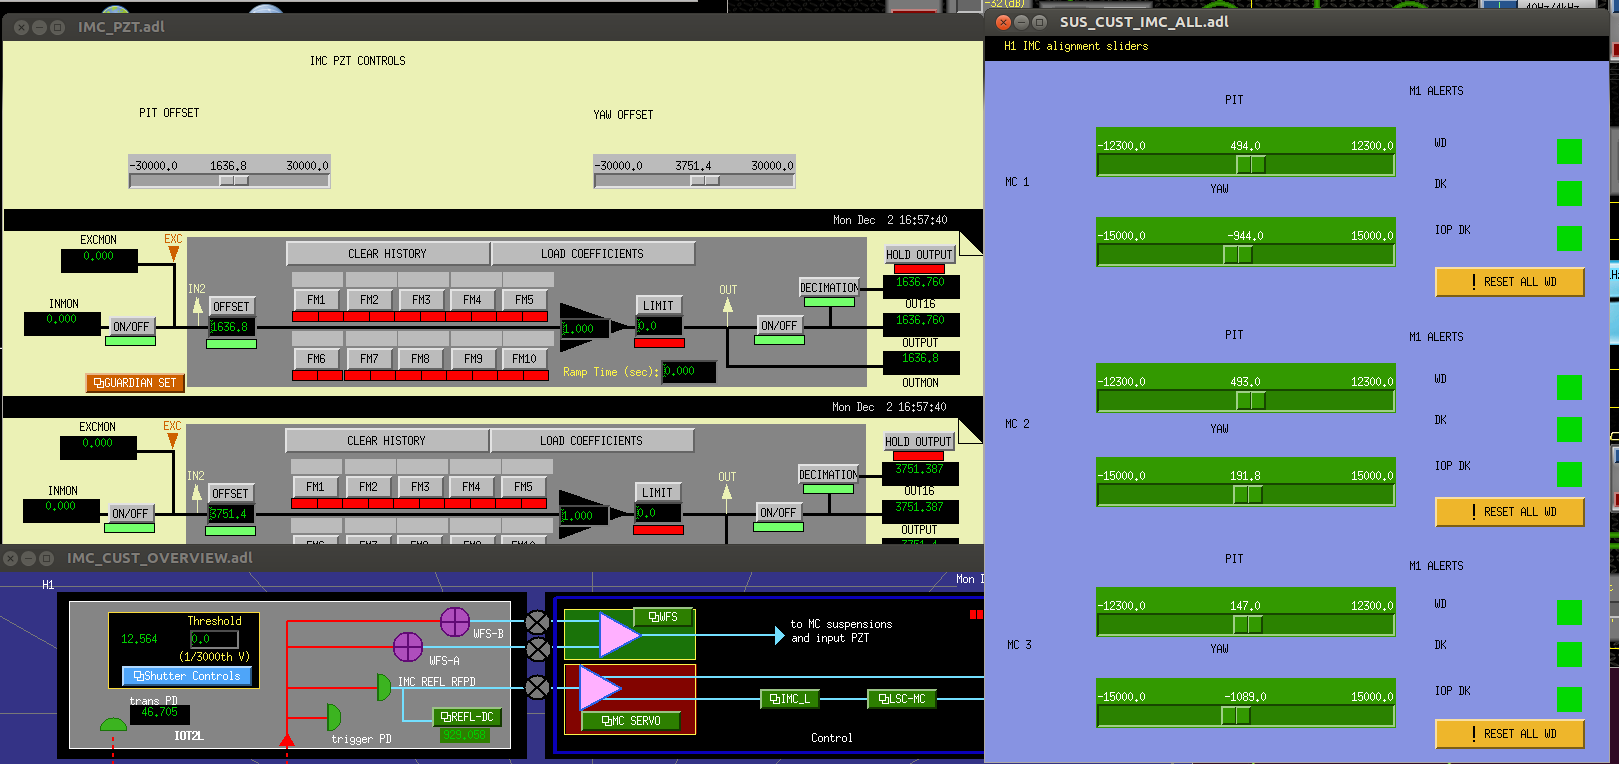
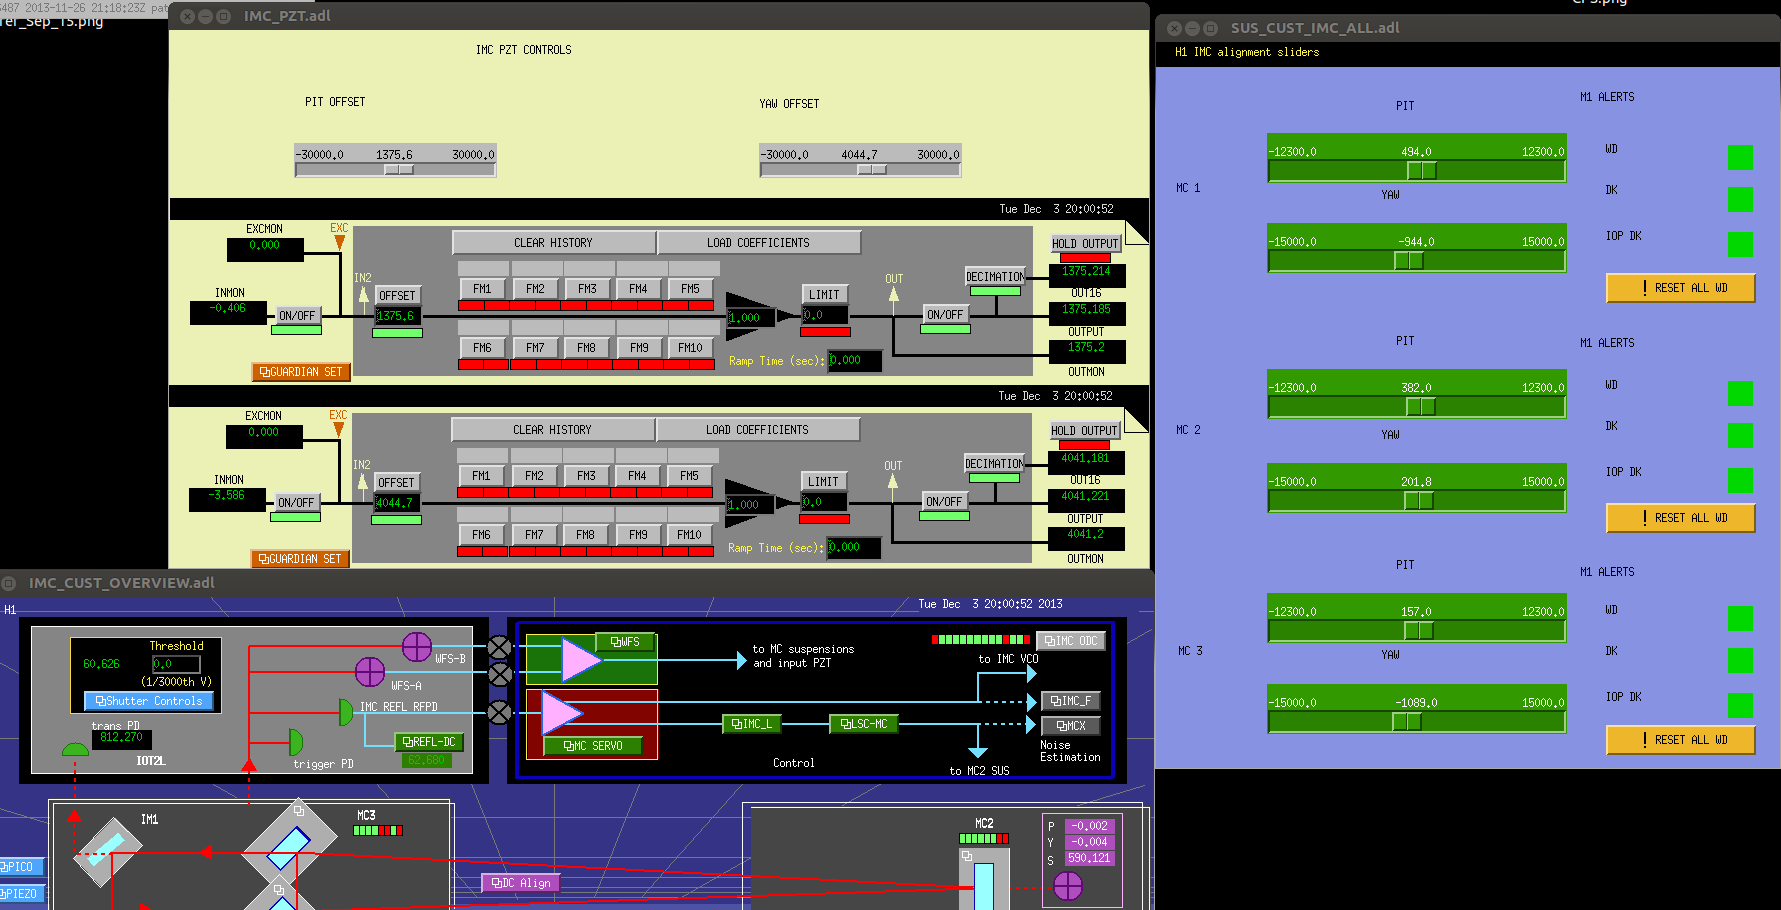
The screen shots below are the current alignment settings that gives a less clipping on the IM1 trans beam. Note that we didn't touch IM1-4 suspensions.
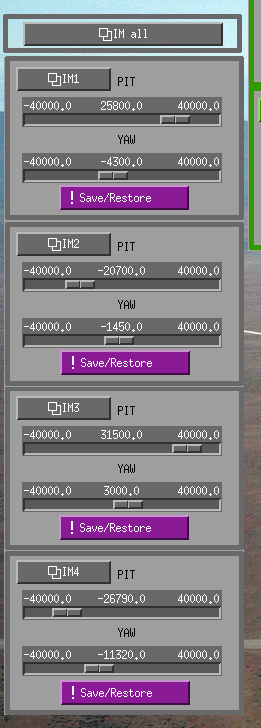
Images attached to this report