Macro substitution text files were intalled for all H1 HEPI and BSC-ISI.
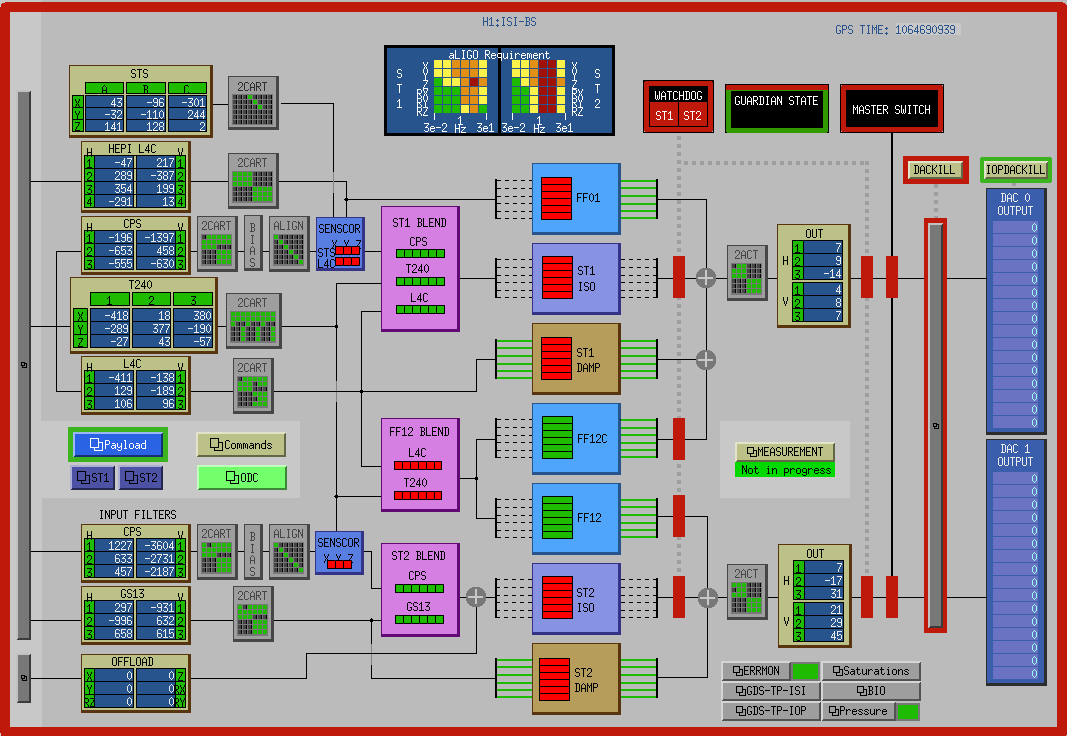
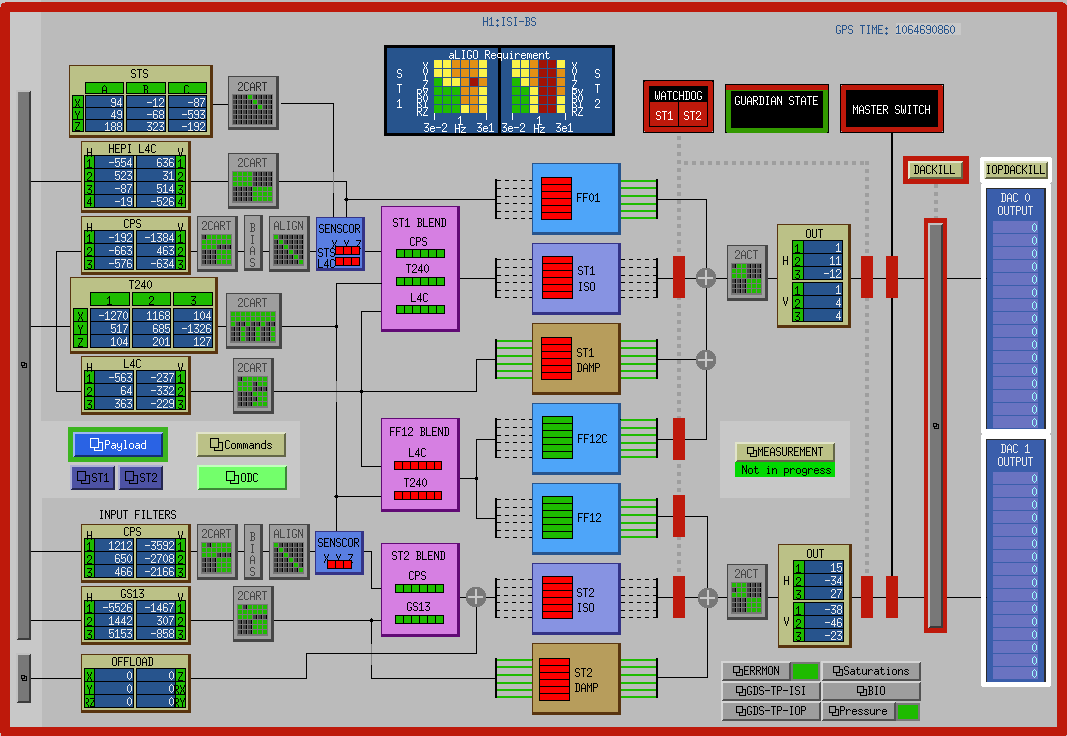
The IOP_NAME macro substitution was added. It corrects the issue seen with the display of the IOP Watchdog status, on the BSC screen. Befrore/After comparison is attahced.
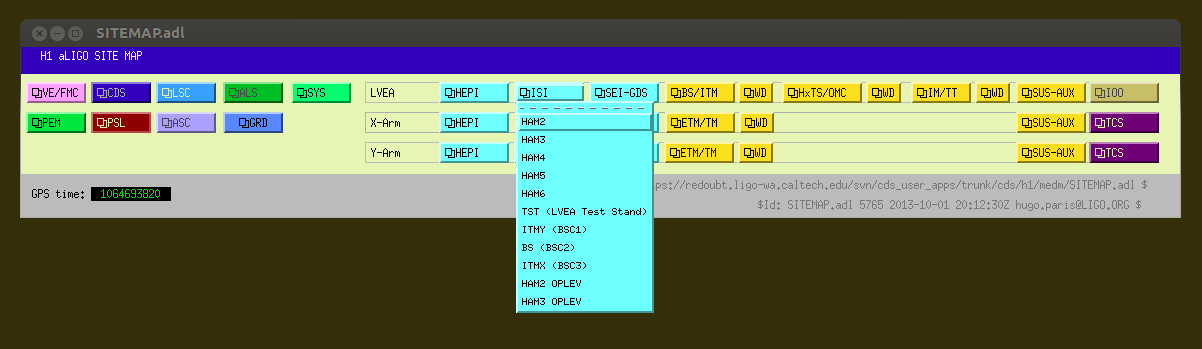
The SITEMAP.adl was updated, and chamber names (bscX) were added to the labels. A screenshot of the new sitemap is attached.
The macro substitution text files, and the new SITEMAP.adl were commited to the SVN. Details below:
Sending SITEMAP.adl
Transmitting file data .
Committed revision 5765.
Password for 'hugo.paris':
Adding bscisi
Adding bscisi/isibs_overview_macro.txt
Adding bscisi/isietmx_overview_macro.txt
Adding bscisi/isiitmx_overview_macro.txt
Adding bscisi/isiitmy_overview_macro.txt
Adding bscisi/isitst_overview_macro.txt
Transmitting file data .....
Committed revision 5764.
Password for 'hugo.paris':
Adding hepi
Adding hepi/hepibs_overview_macro.txt
Adding hepi/hepiham1_overview_macro.txt
Adding hepi/hepiham2_overview_macro.txt
Adding hepi/hepiham3_overview_macro.txt
Adding hepi/hepiham4_overview_macro.txt
Adding hepi/hepiham5_overview_macro.txt
Adding hepi/hepiham6_overview_macro.txt
Adding hepi/hepiitmy_overview_macro.txt
Transmitting file data ........
Committed revision 5762.Sending SITEMAP.adl
BSC-ISI Macro Substitution Text FIles:
/opt/rtcds/userapps/release/isi/h1/medm/
Adding bscisi/isibs_overview_macro.txt
Adding bscisi/isietmx_overview_macro.txt
Adding bscisi/isiitmx_overview_macro.txt
Adding bscisi/isiitmy_overview_macro.txt
Adding bscisi/isitst_overview_macro.txt
Committed revision 5764.
HEPI Macro Substitution Text FIles:
/opt/rtcds/userapps/release/hpi/h1/medm/
Adding hepi/hepibs_overview_macro.txt
Adding hepi/hepiham1_overview_macro.txt
Adding hepi/hepiham2_overview_macro.txt
Adding hepi/hepiham3_overview_macro.txt
Adding hepi/hepiham4_overview_macro.txt
Adding hepi/hepiham5_overview_macro.txt
Adding hepi/hepiham6_overview_macro.txt
Adding hepi/hepiitmy_overview_macro.txt
Transmitting file data ........
Committed revision 5762.
Sitemap
SITEMAP.adl
Committed revision 5765.
This work closes WP #4156