Displaying reports 8021-8040 of 89121.Go to page Start 398 399 400 401 402 403 404 405 406 End
Reports until 07:39, Sunday 23 March 2025
LHO General
ryan.short@LIGO.ORG - posted 07:39, Sunday 23 March 2025 (83508)
Ops Day Shift Start

TITLE: 03/23 Day Shift: 1430-2330 UTC (0730-1630 PST), all times posted in UTC
STATE of H1: Observing at 148Mpc
OUTGOING OPERATOR: Ryan C
CURRENT ENVIRONMENT:
    SEI_ENV state: CALM
    Wind: 13mph Gusts, 8mph 3min avg
    Primary useism: 0.02 μm/s
    Secondary useism: 0.26 μm/s
QUICK SUMMARY: Good night for H1, observing with steady range for 10 hours now. Rainy morning on-site, but fortunately the rest of the environment is calm.

LHO General
corey.gray@LIGO.ORG - posted 21:59, Saturday 22 March 2025 (83506)
Sat EVE Ops Summary

TITLE: 03/22 Eve Shift: 2330-0500 UTC (1630-2200 PST), all times posted in UTC
STATE of H1: Observing at 143Mpc
INCOMING OPERATOR: Ryan C
SHIFT SUMMARY:

Even with a lockloss 50min into his measurment, Robert was able to get the base minimum needed for his measurements in the LVEA this evening while L1 was down.  So this activity can be taken OFF the Weekend To Do List for operators!

Continue to have the User Message about SQZ_OPO_LR having high Rejected Power (tagging SQZ).

LOG:

Images attached to this report
H1 General
corey.gray@LIGO.ORG - posted 16:09, Saturday 22 March 2025 (83507)
H1 Dropped From Observing (While L1 Down) For Approved 1-hr Measurement Time For Robert S.

At 2257utc, noticed L1 go to the YELLOW ("Calib not ready") state on gwistat.  Went to check LLO screenshots to confirm L1 looked down (it mostly looked down although some screenshots took a few minutes to update showing so).  Ran to let Robert know. 

At 2302, H1 was dropped out of Observing.  Robert did some measurment set-up in the Control Room, and then went out to the LVEA to turn on an amplifier which is set up in the H1 PSL area.  Robert has been approved to have 1hr of measurement time.

LHO General
corey.gray@LIGO.ORG - posted 14:41, Saturday 22 March 2025 (83505)
Sat EVE Ops Transition

TITLE: 03/22 Eve Shift: 2330-0500 UTC (1630-2200 PST), all times posted in UTC
STATE of H1: Observing at 147Mpc
OUTGOING OPERATOR: Ryan S
CURRENT ENVIRONMENT:
    SEI_ENV state: CALM
    Wind: 10mph Gusts, 5mph 3min avg
    Primary useism: 0.03 μm/s
    Secondary useism: 0.26 μm/s
QUICK SUMMARY:

H1's had a pretty decent 24hrs with only 3.5hrs of downtime.  Environmentally, the day has been calmer windwise than yesterday & decently overall seismically/environmentally today.

Trying to keep an eye on L1 in case there is an opportunistic moment for Robert measurements out on the floor.

LHO General (SQZ)
ryan.short@LIGO.ORG - posted 14:28, Saturday 22 March 2025 (83504)
Ops Day Shift Summary

TITLE: 03/22 Day Shift: 1430-2330 UTC (0730-1630 PST), all times posted in UTC
STATE of H1: Observing at 148Mpc
INCOMING OPERATOR: Corey
SHIFT SUMMARY: One lockloss this morning with an easy relock and coordinated calibration sweeps with L1 made for a straightforward shift. H1 has now been locked for 5.5 hours.

LOG:

Start Time System Name Location Lazer_Haz Task Time End
19:57 SAF LASER HAZARD LVEA YES LVEA IS LASER HAZARD Ongoing
19:38 ISC Mayank, Siva Opt Lab Local ISS array work 21:18
H1 CAL
ryan.short@LIGO.ORG - posted 12:33, Saturday 22 March 2025 (83503)
Broadband and Simulines Calibration Sweeps

Successfully ran the usual calibration measurements at 19:00 UTC (30 minutes later than usual as H1 was still thermalizing) following instructions in the wiki. Times of sweeps below:

Broadband: 19:01:02 to 19:06:12 UTC

Simulines: 19:06:51 to 19:30:13 UTC

2025-03-22 19:30:13,919 | INFO | File written out to: /ligo/groups/cal/H1/measurements/DARMOLG_SS/DARMOLG_SS_20250322T190652Z.hdf5
2025-03-22 19:30:13,929 | INFO | File written out to: /ligo/groups/cal/H1/measurements/PCALY2DARM_SS/PCALY2DARM_SS_20250322T190652Z.hdf5
2025-03-22 19:30:13,933 | INFO | File written out to: /ligo/groups/cal/H1/measurements/SUSETMX_L1_SS/SUSETMX_L1_SS_20250322T190652Z.hdf5
2025-03-22 19:30:13,938 | INFO | File written out to: /ligo/groups/cal/H1/measurements/SUSETMX_L2_SS/SUSETMX_L2_SS_20250322T190652Z.hdf5
2025-03-22 19:30:13,943 | INFO | File written out to: /ligo/groups/cal/H1/measurements/SUSETMX_L3_SS/SUSETMX_L3_SS_20250322T190652Z.hdf5

LHO VE
david.barker@LIGO.ORG - posted 10:13, Saturday 22 March 2025 (83502)
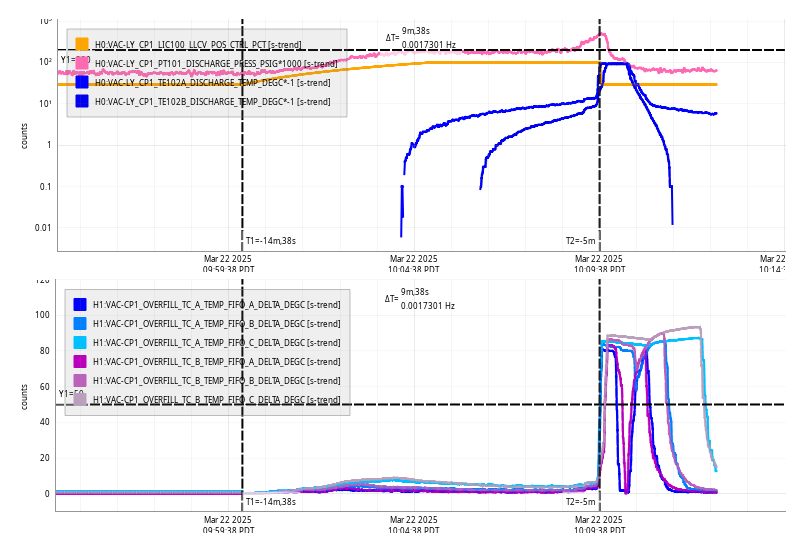
Sat CP1 Fill

Sat Mar 22 10:09:38 2025 INFO: Fill completed in 9min 35secs


Images attached to this report
H1 General (Lockloss)
ryan.short@LIGO.ORG - posted 08:40, Saturday 22 March 2025 - last comment - 09:30, Saturday 22 March 2025(83500)
Lockloss @ 15:00 UTC

Lockloss @ 15:00 UTC - link to lockloss tool

Ends lock stretch at 7 hours. No obvious cause; environment is calm and no real sign of an ETM glitch.

Comments related to this report
ryan.short@LIGO.ORG - 09:30, Saturday 22 March 2025 (83501)

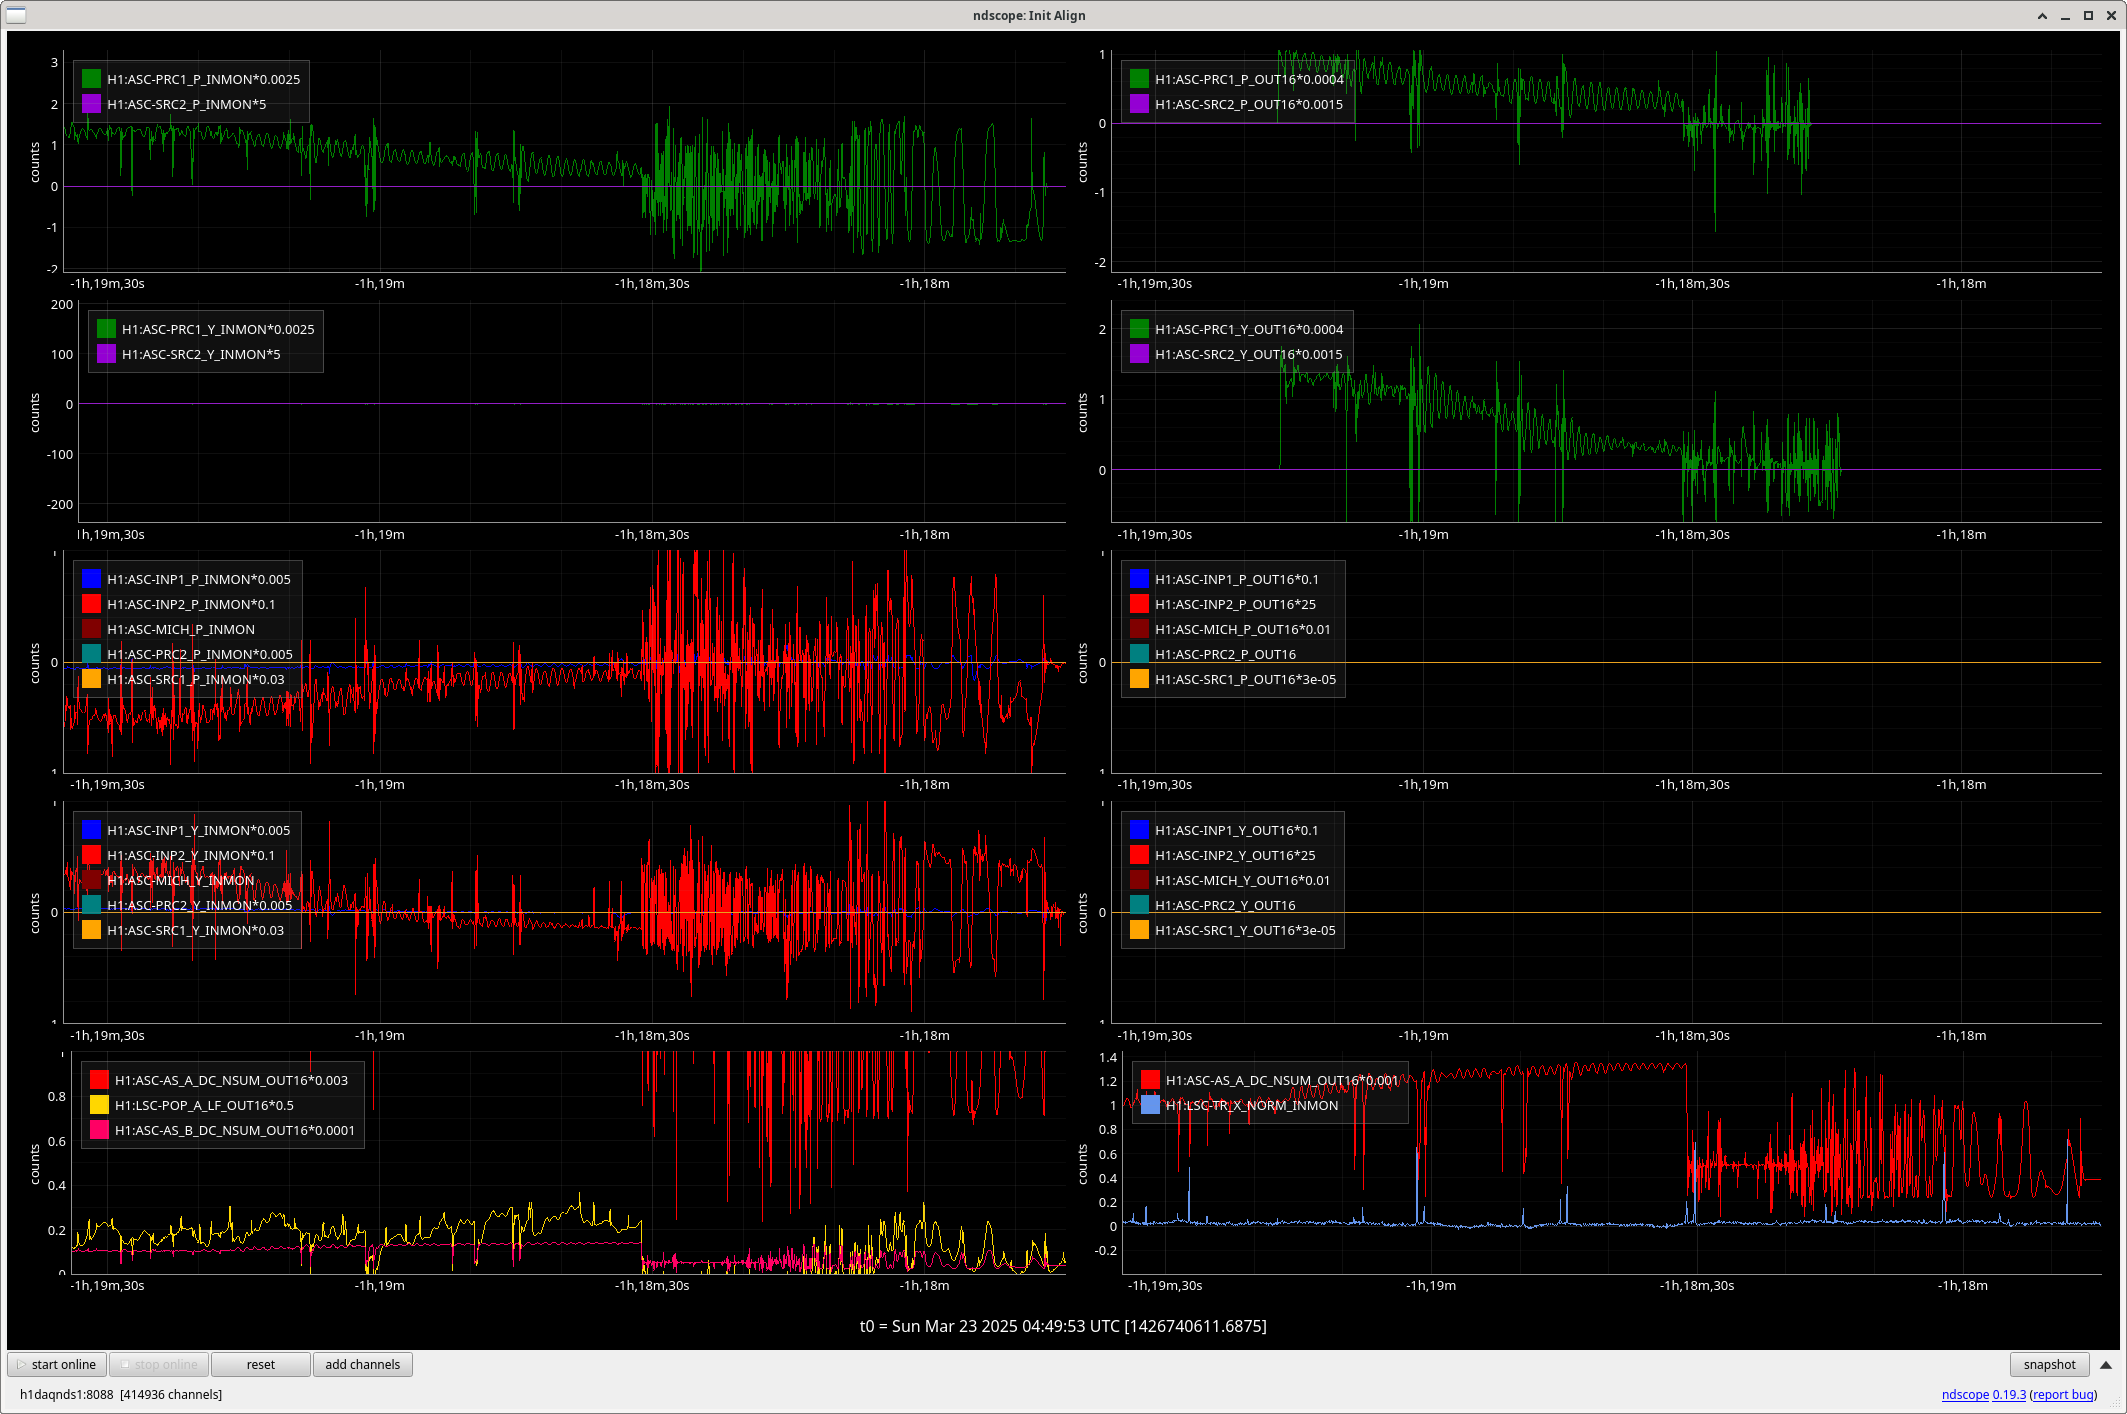
H1 back to observing at 16:13 UTC. I went straight into an initial alignment after the lockloss, then everything went fully automatically after that.

LHO General
ryan.short@LIGO.ORG - posted 07:43, Saturday 22 March 2025 (83499)
Ops Day Shift Start

TITLE: 03/22 Day Shift: 1430-2330 UTC (0730-1630 PST), all times posted in UTC
STATE of H1: Observing at 148Mpc
OUTGOING OPERATOR: Ibrahim
CURRENT ENVIRONMENT:
    SEI_ENV state: CALM
    Wind: 8mph Gusts, 5mph 3min avg
    Primary useism: 0.02 μm/s
    Secondary useism: 0.30 μm/s
QUICK SUMMARY: Despite periods of high winds, H1 generally had a good night with only one lockloss. Lock stretch is currently up to almost 7 hours.

LHO General
corey.gray@LIGO.ORG - posted 21:59, Friday 21 March 2025 (83495)
Fri Ops Eve Summary

TITLE: 03/21 Eve Shift: 2330-0500 UTC (1630-2200 PST), all times posted in UTC
STATE of H1: Observing at 148Mpc
INCOMING OPERATOR: Ibrahim
SHIFT SUMMARY: 

H1 was locked entire shift (even with winds over 30mph).  Had one drop from observing due to the Squeezer, but other than that quiet shift.
LOG:

H1 CAL
anthony.sanchez@LIGO.ORG - posted 21:01, Friday 21 March 2025 (83498)
ndscope Template for CAL- sweep injections

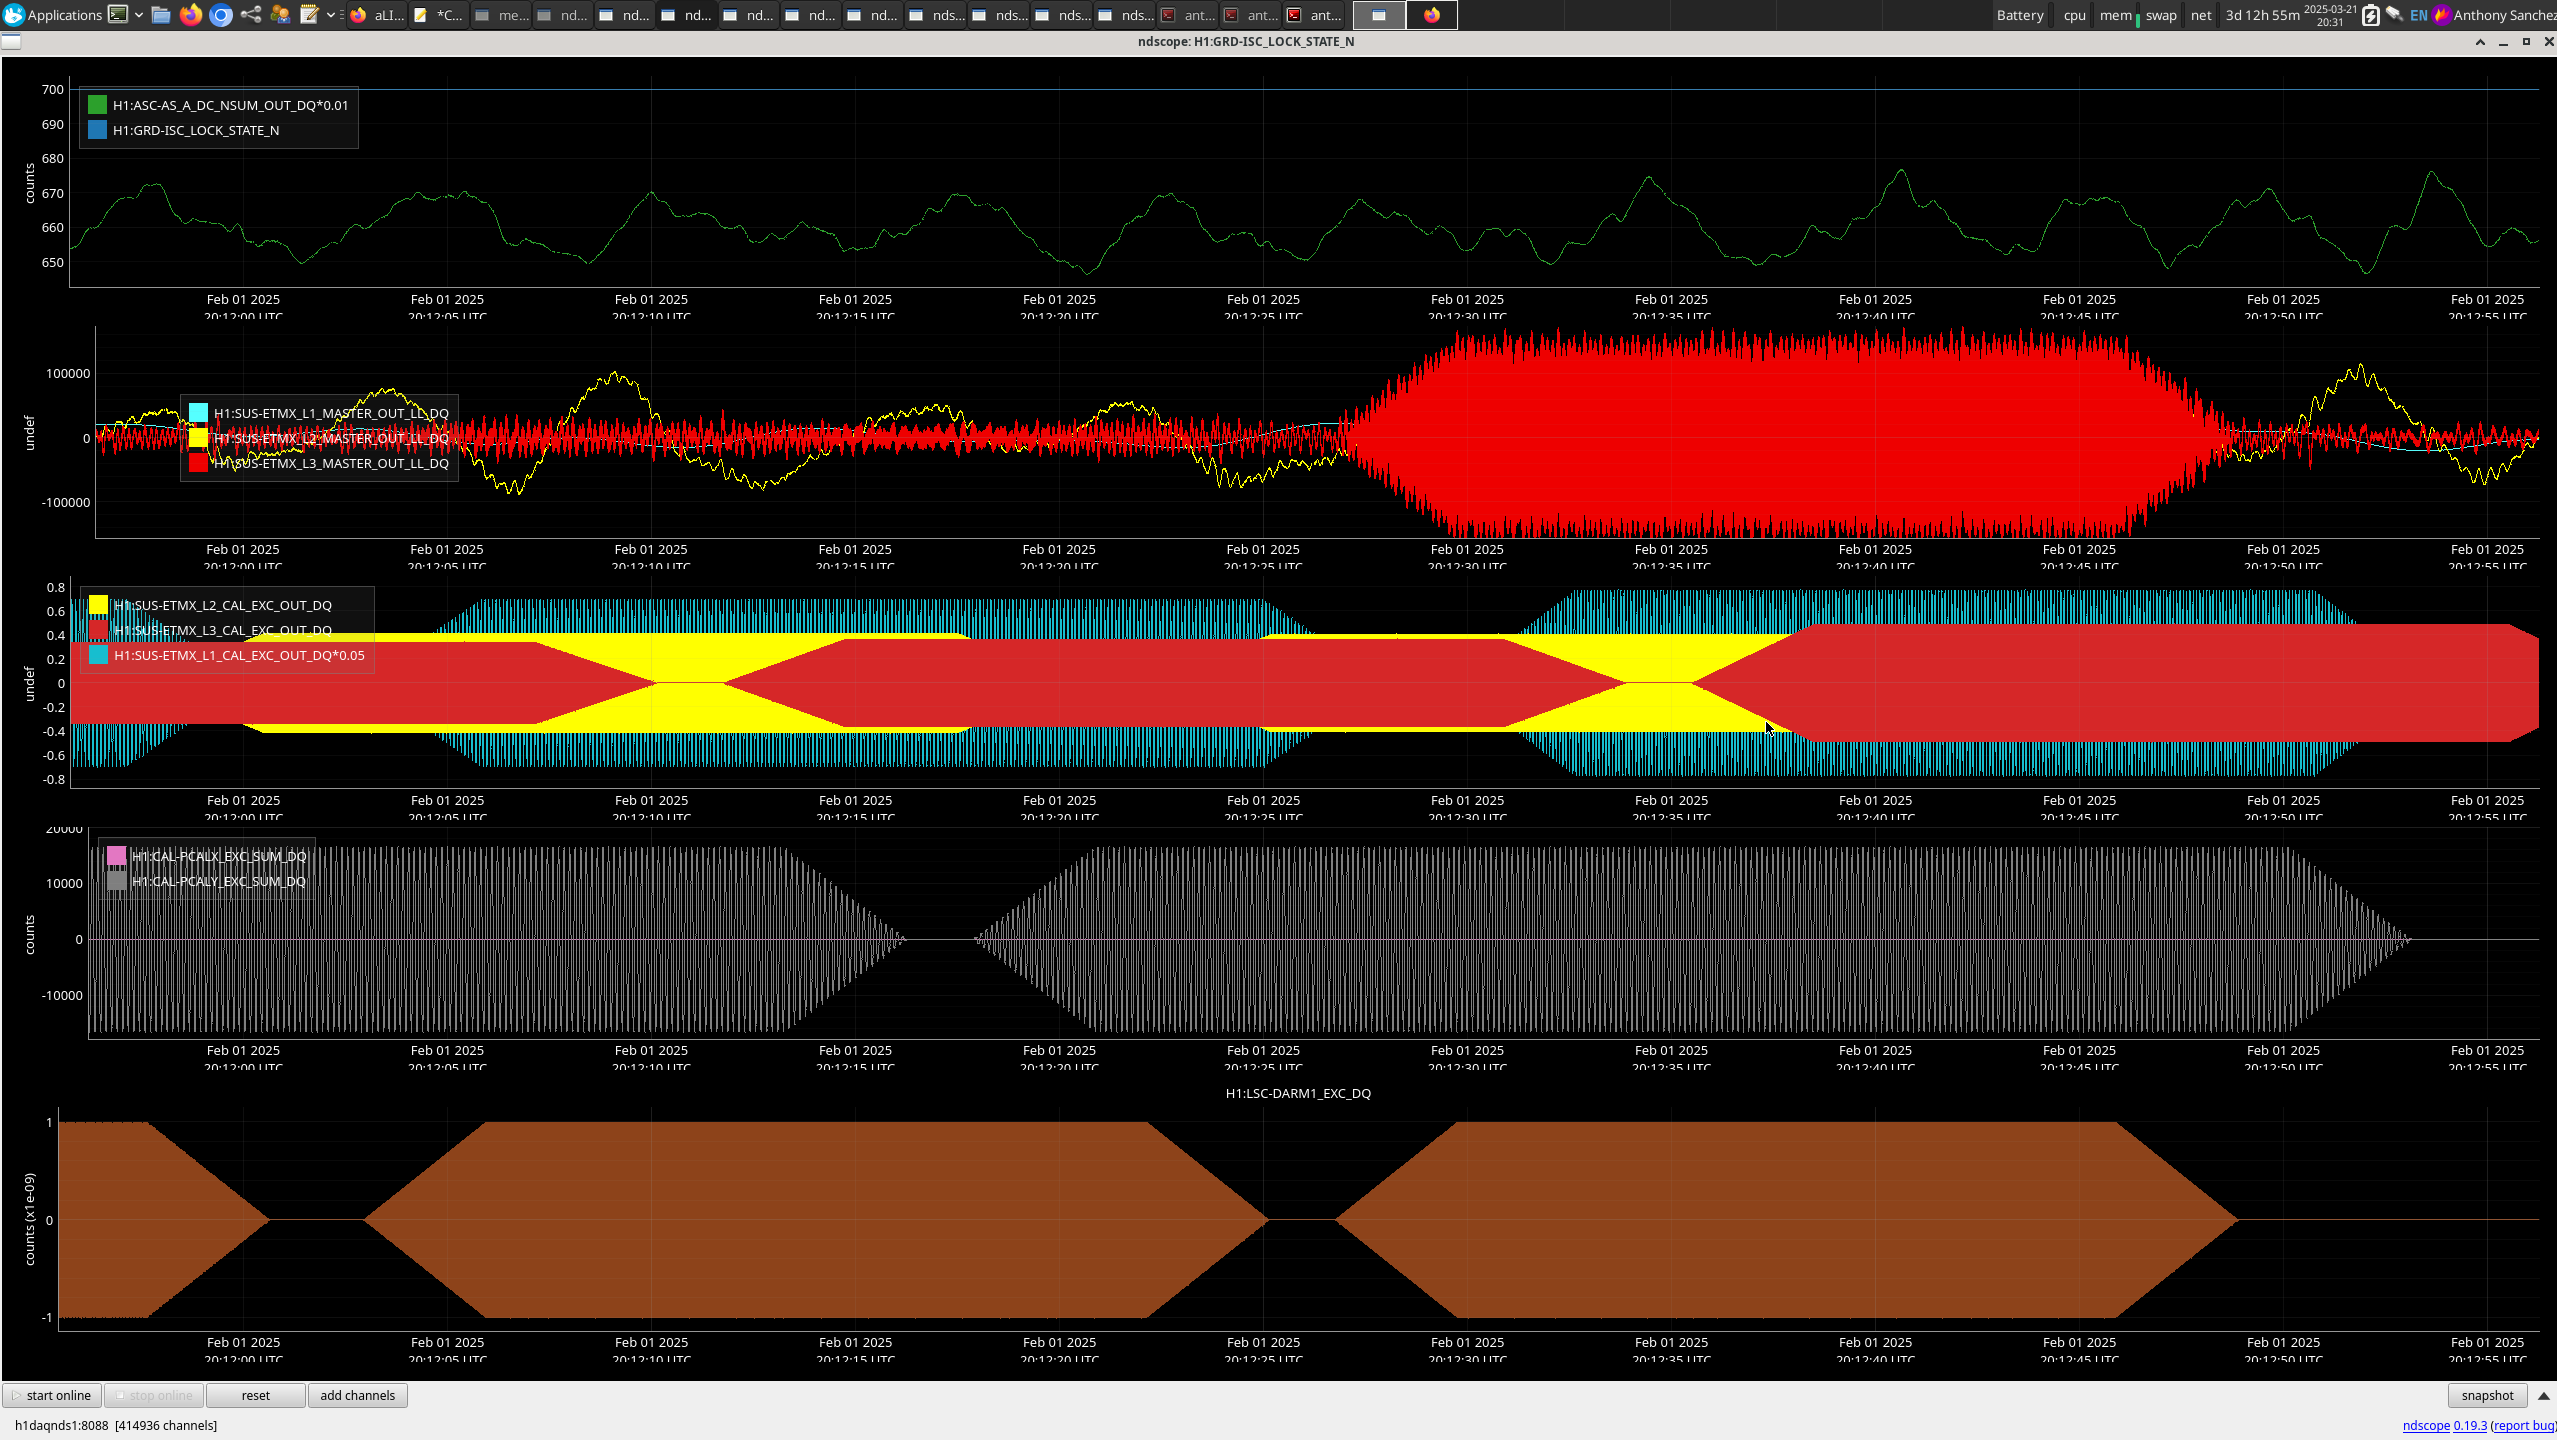
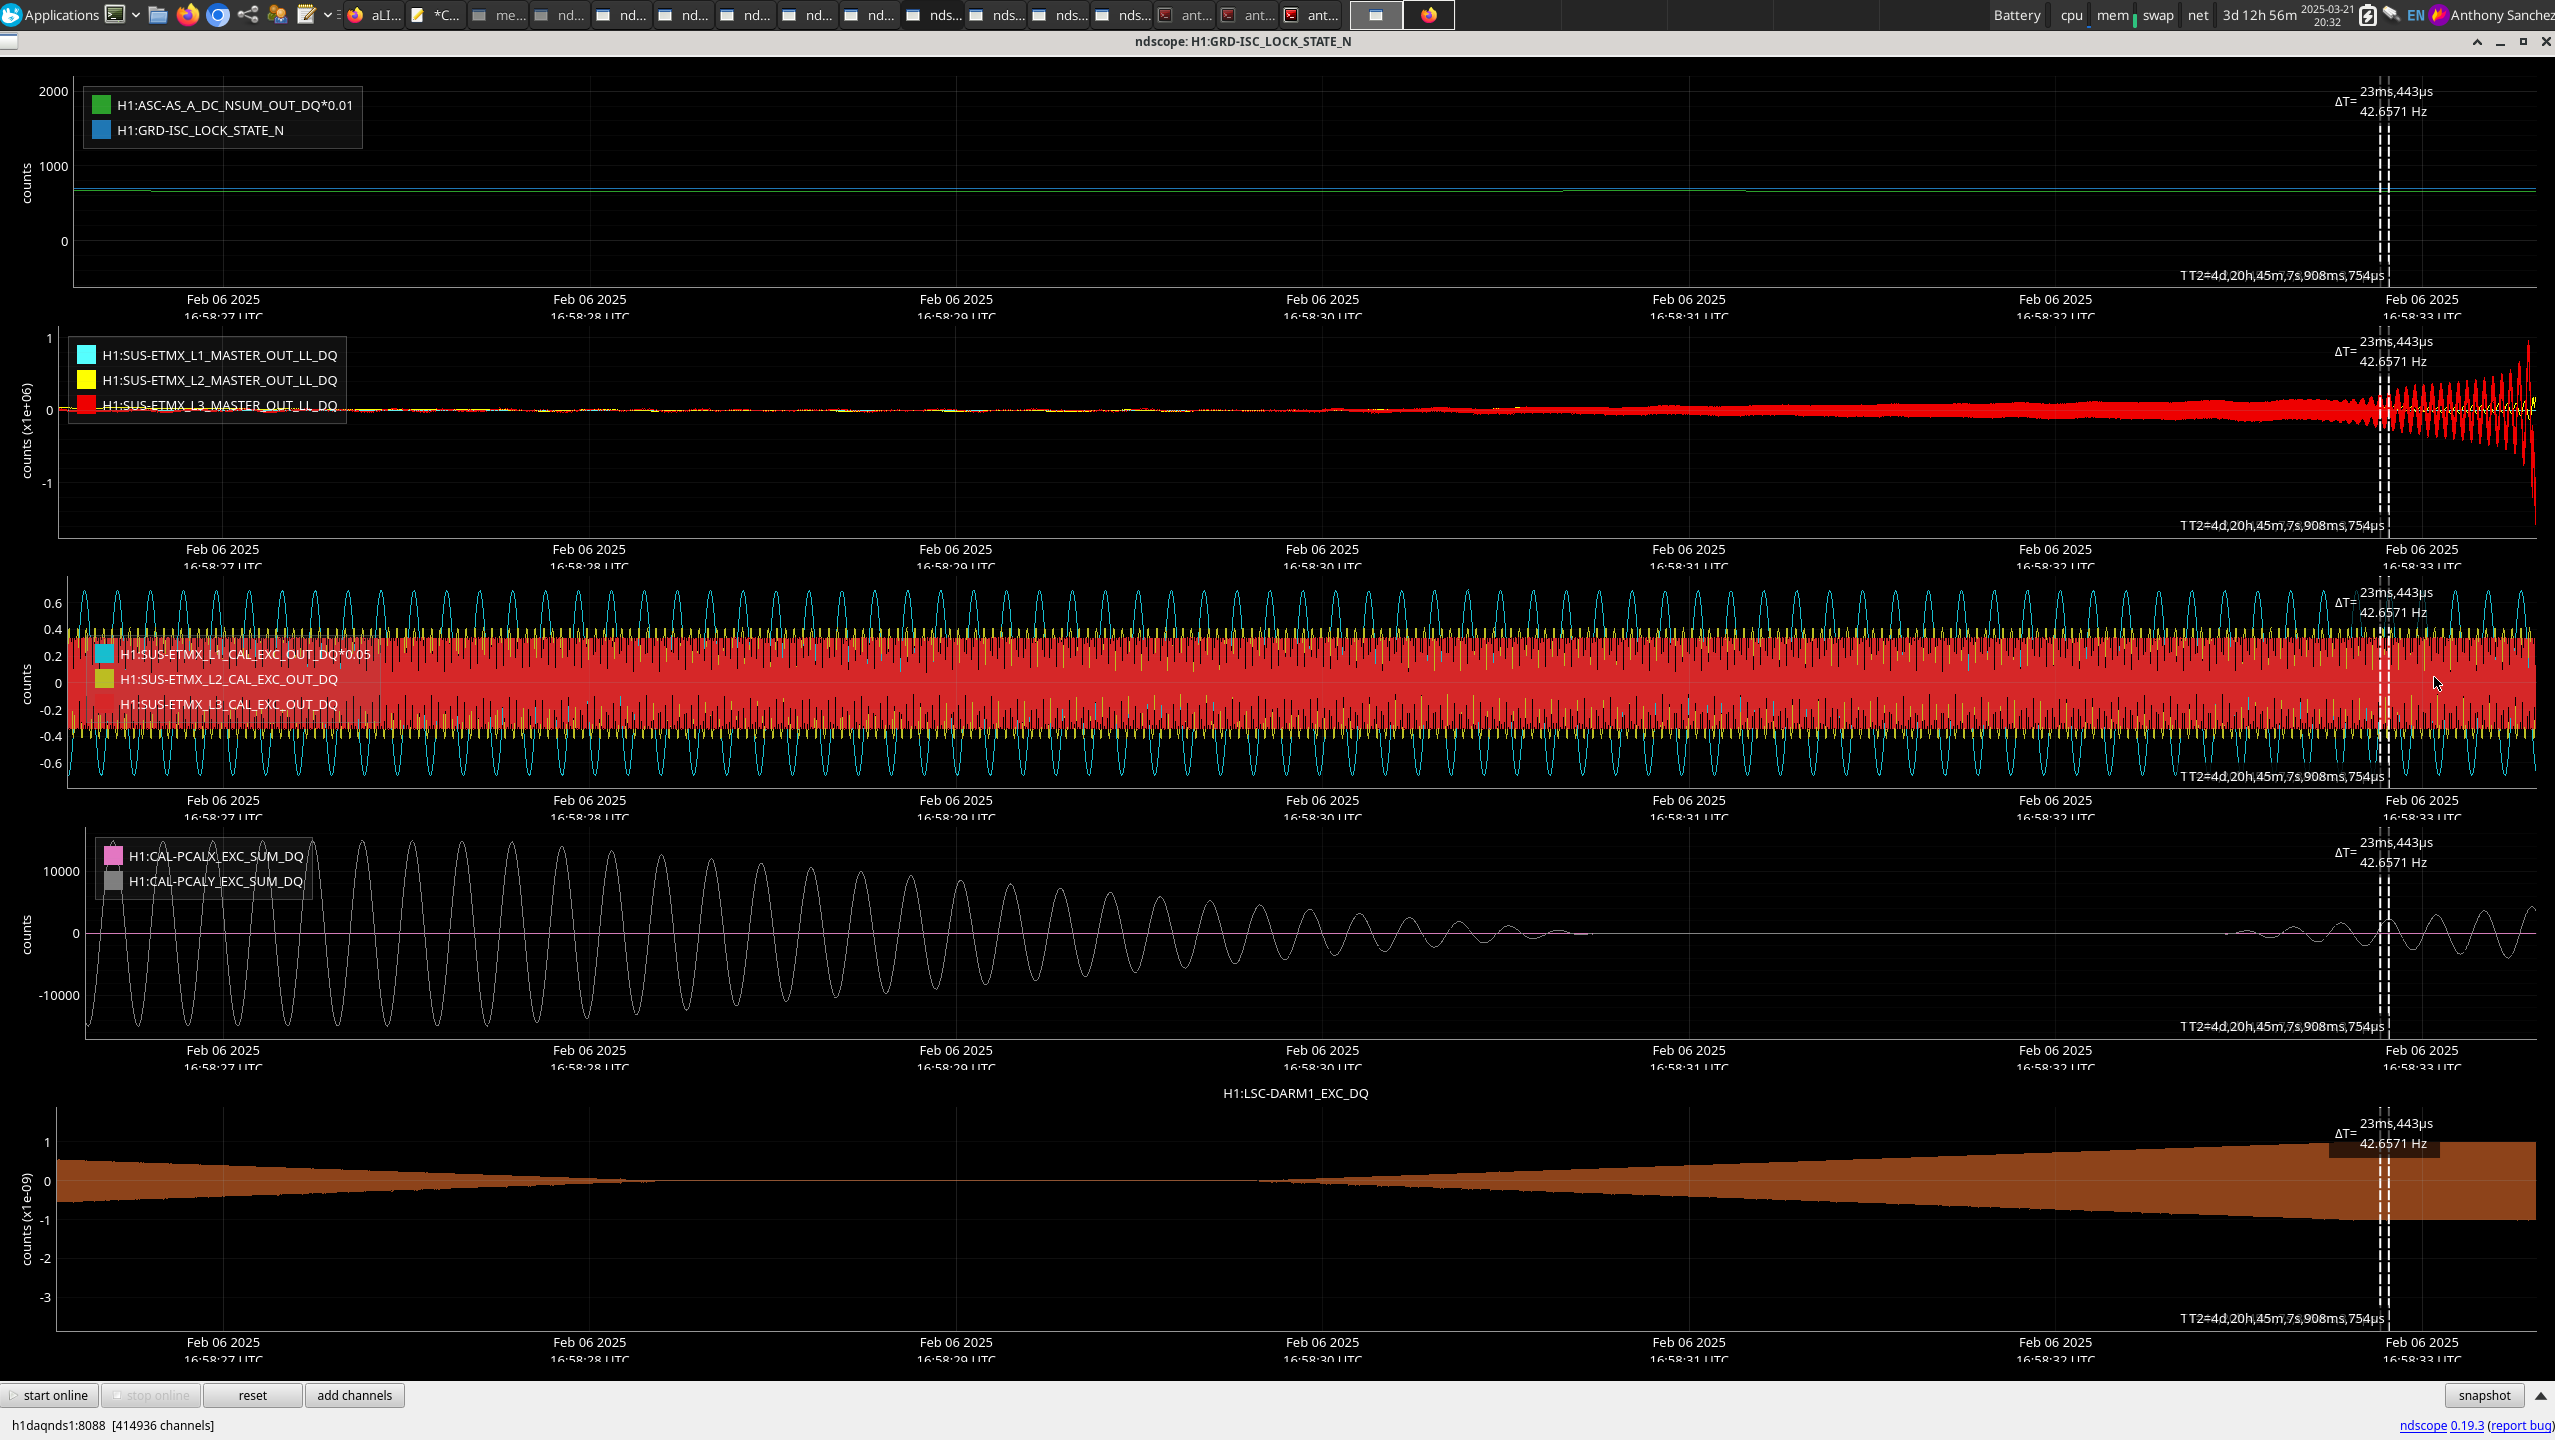
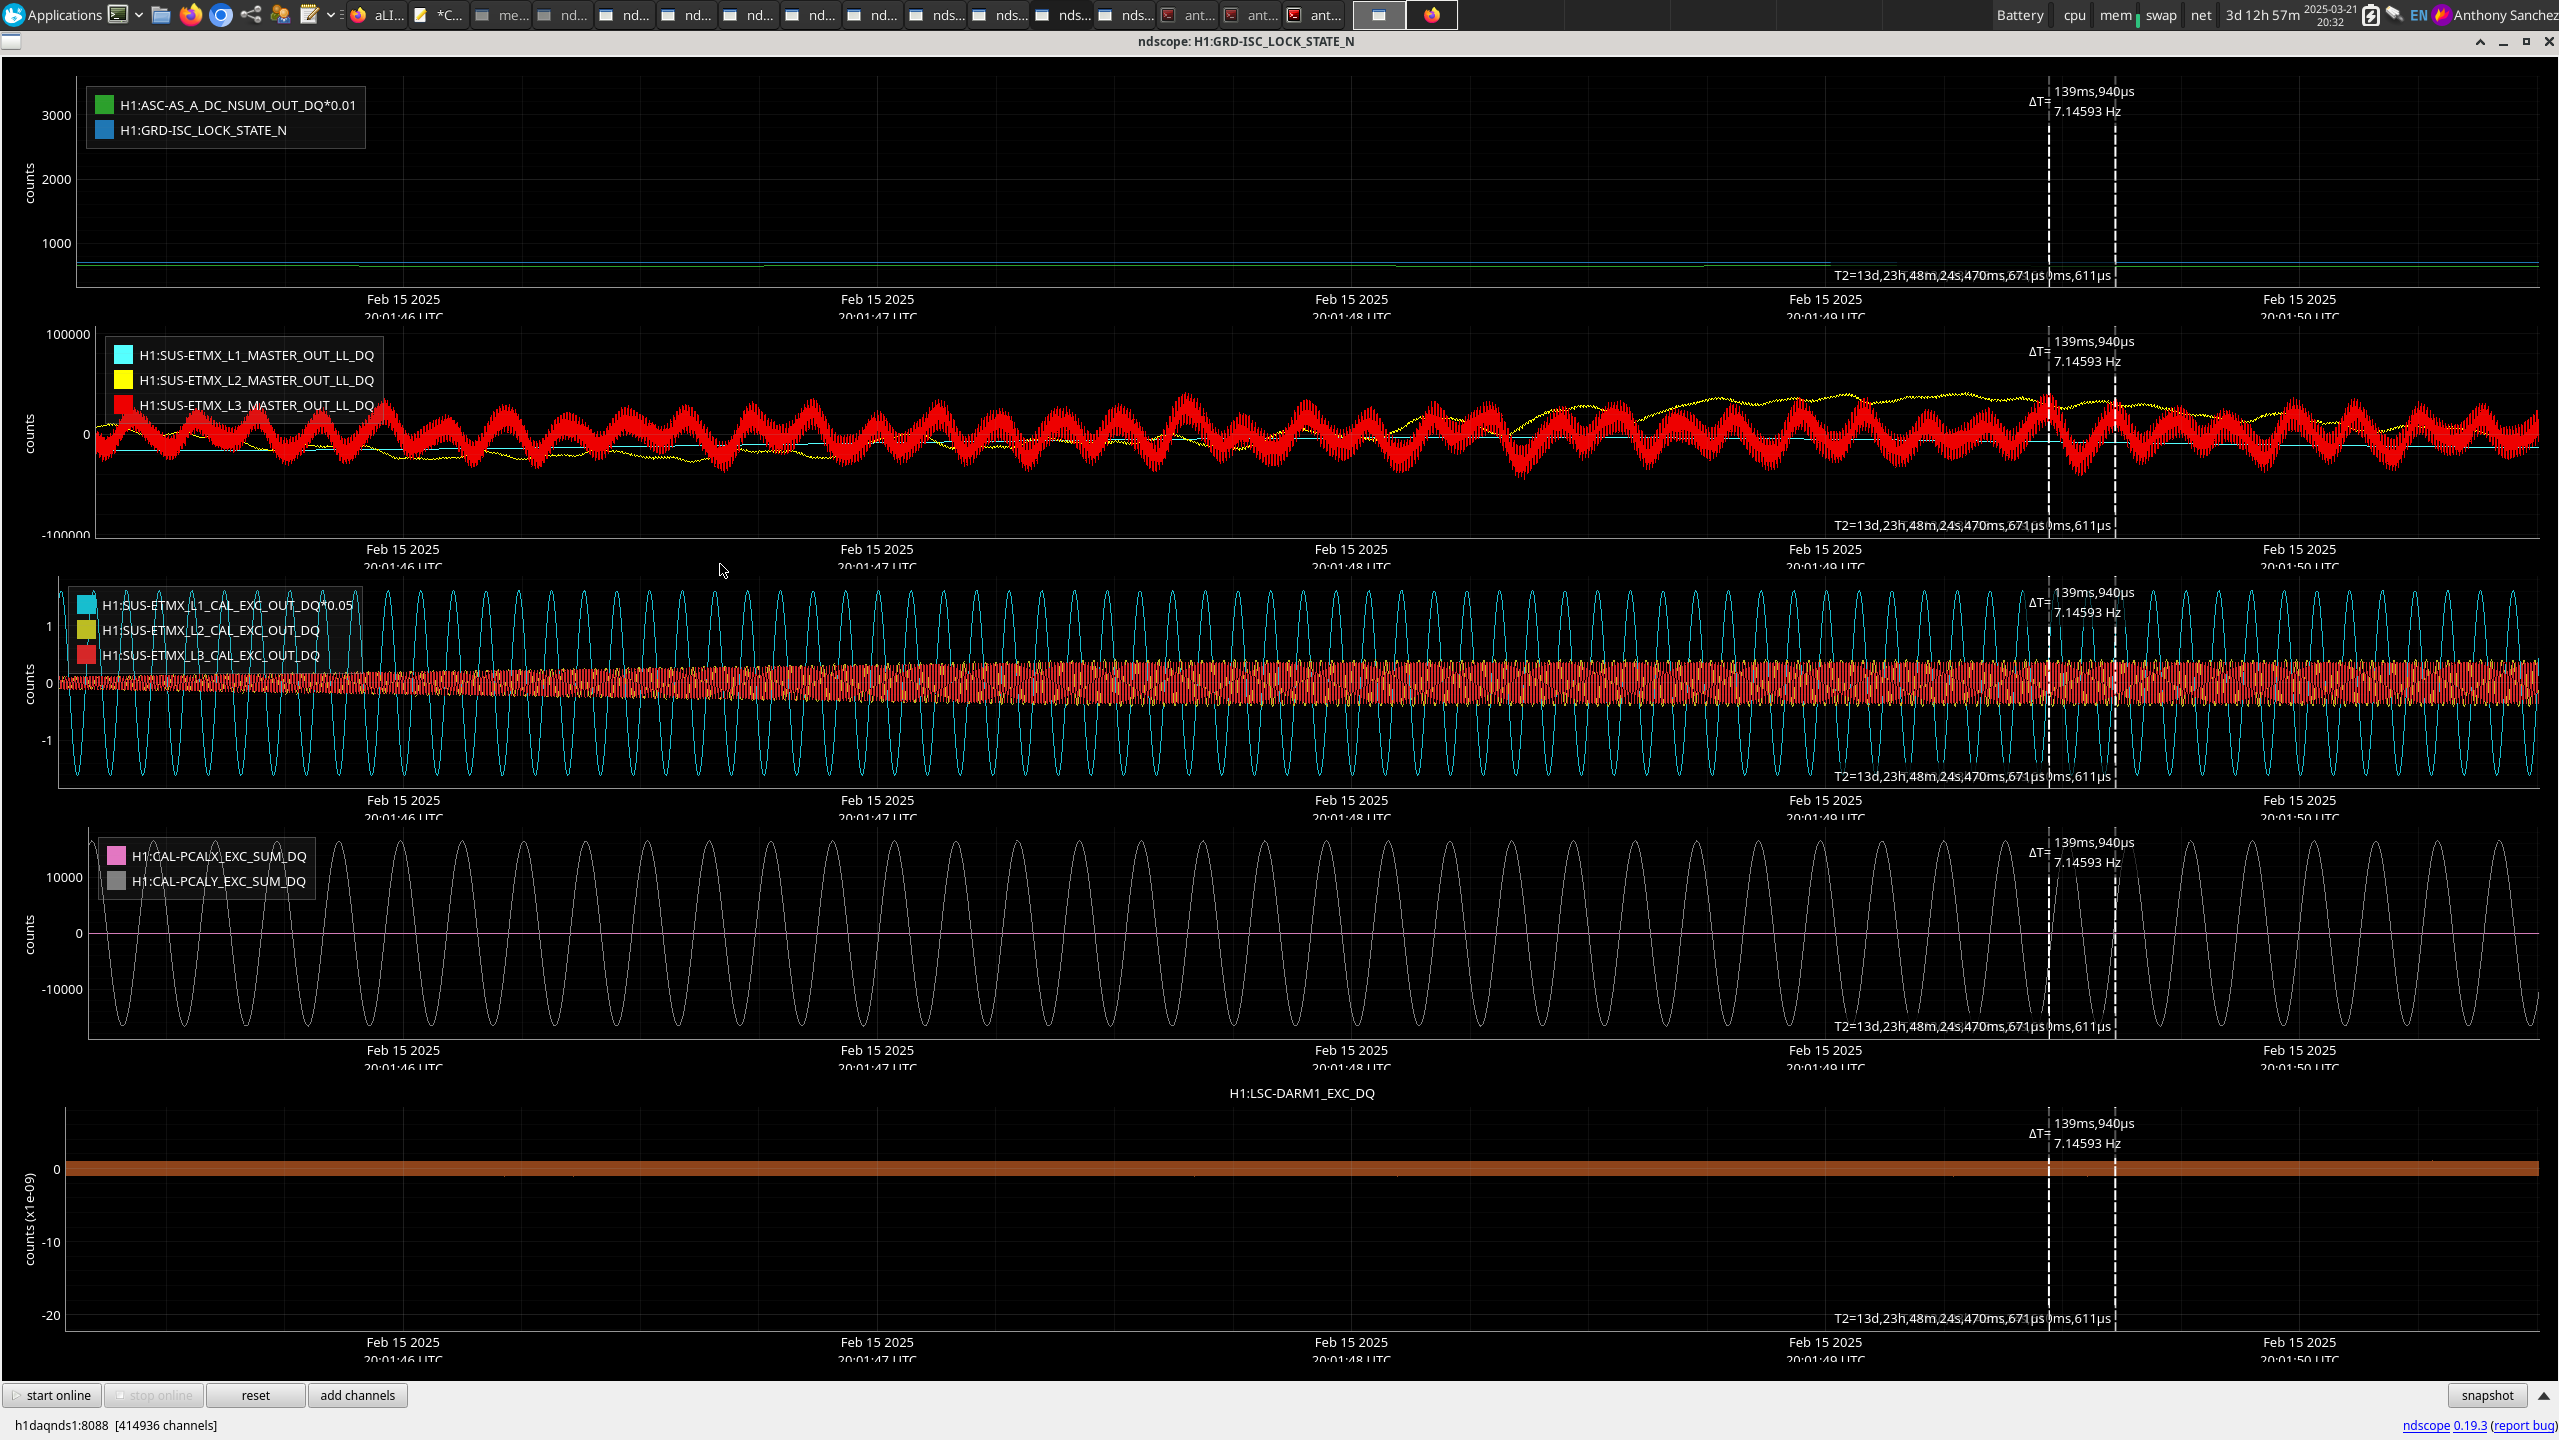
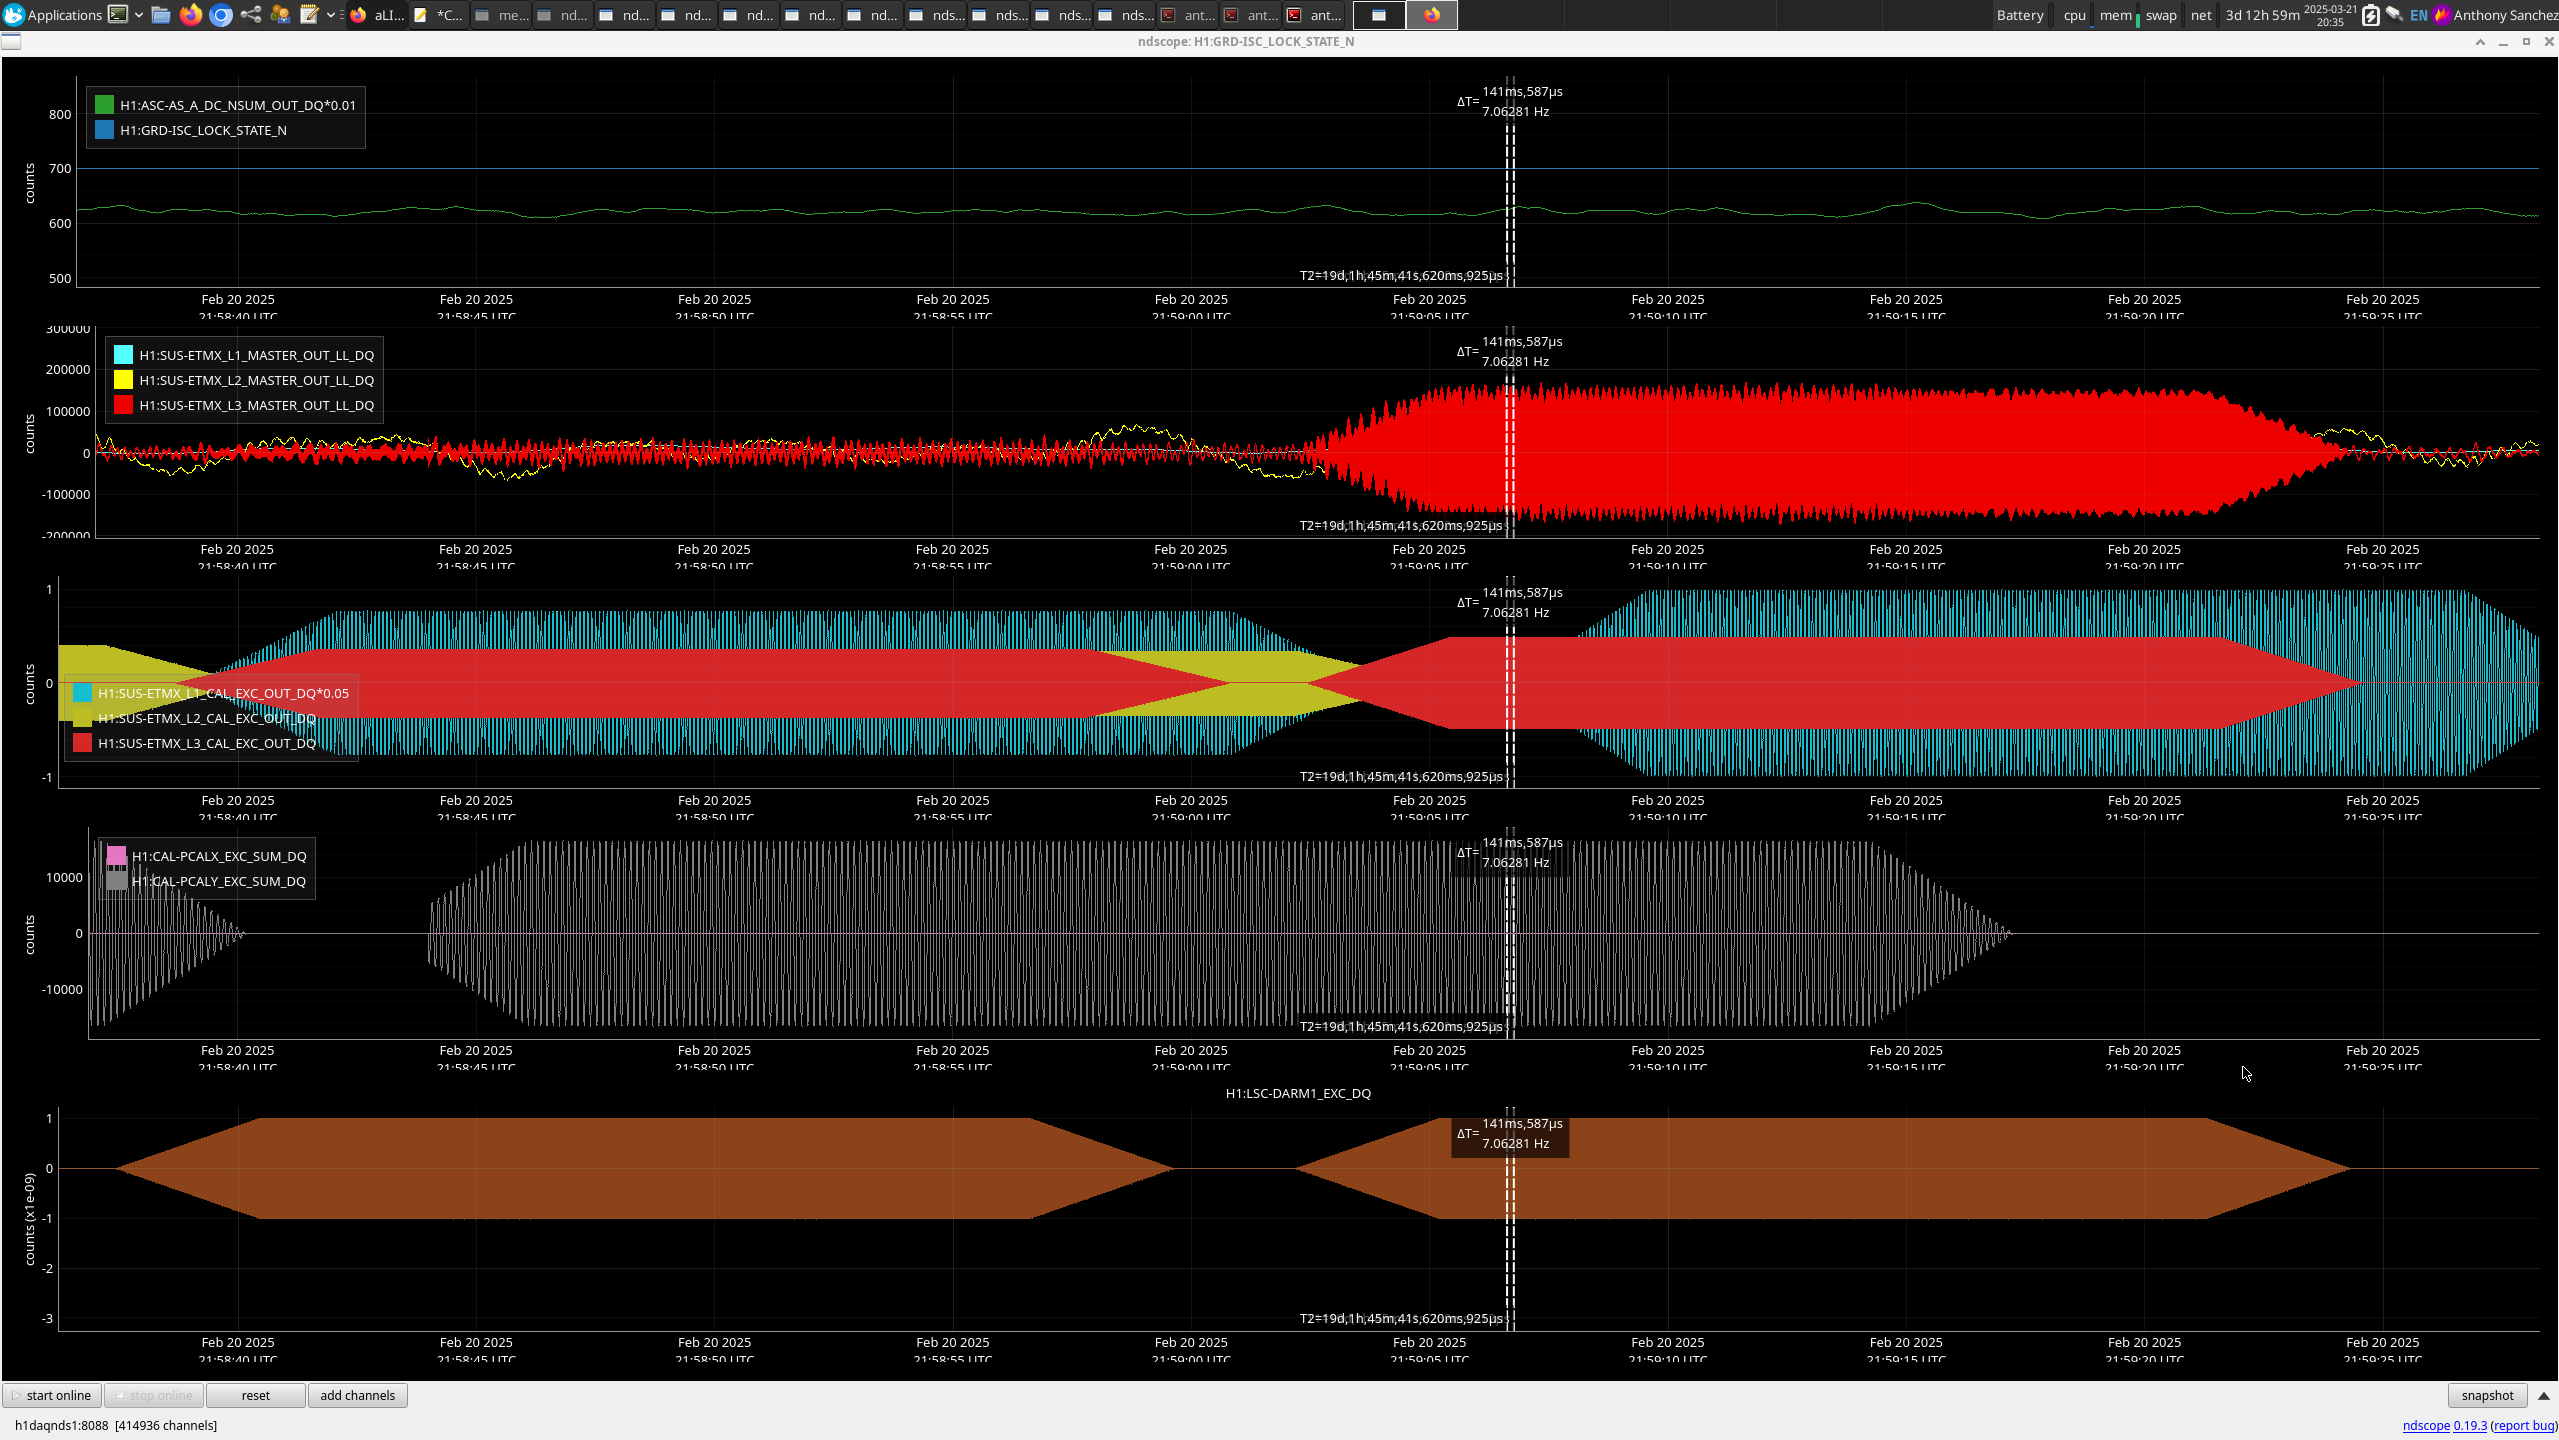
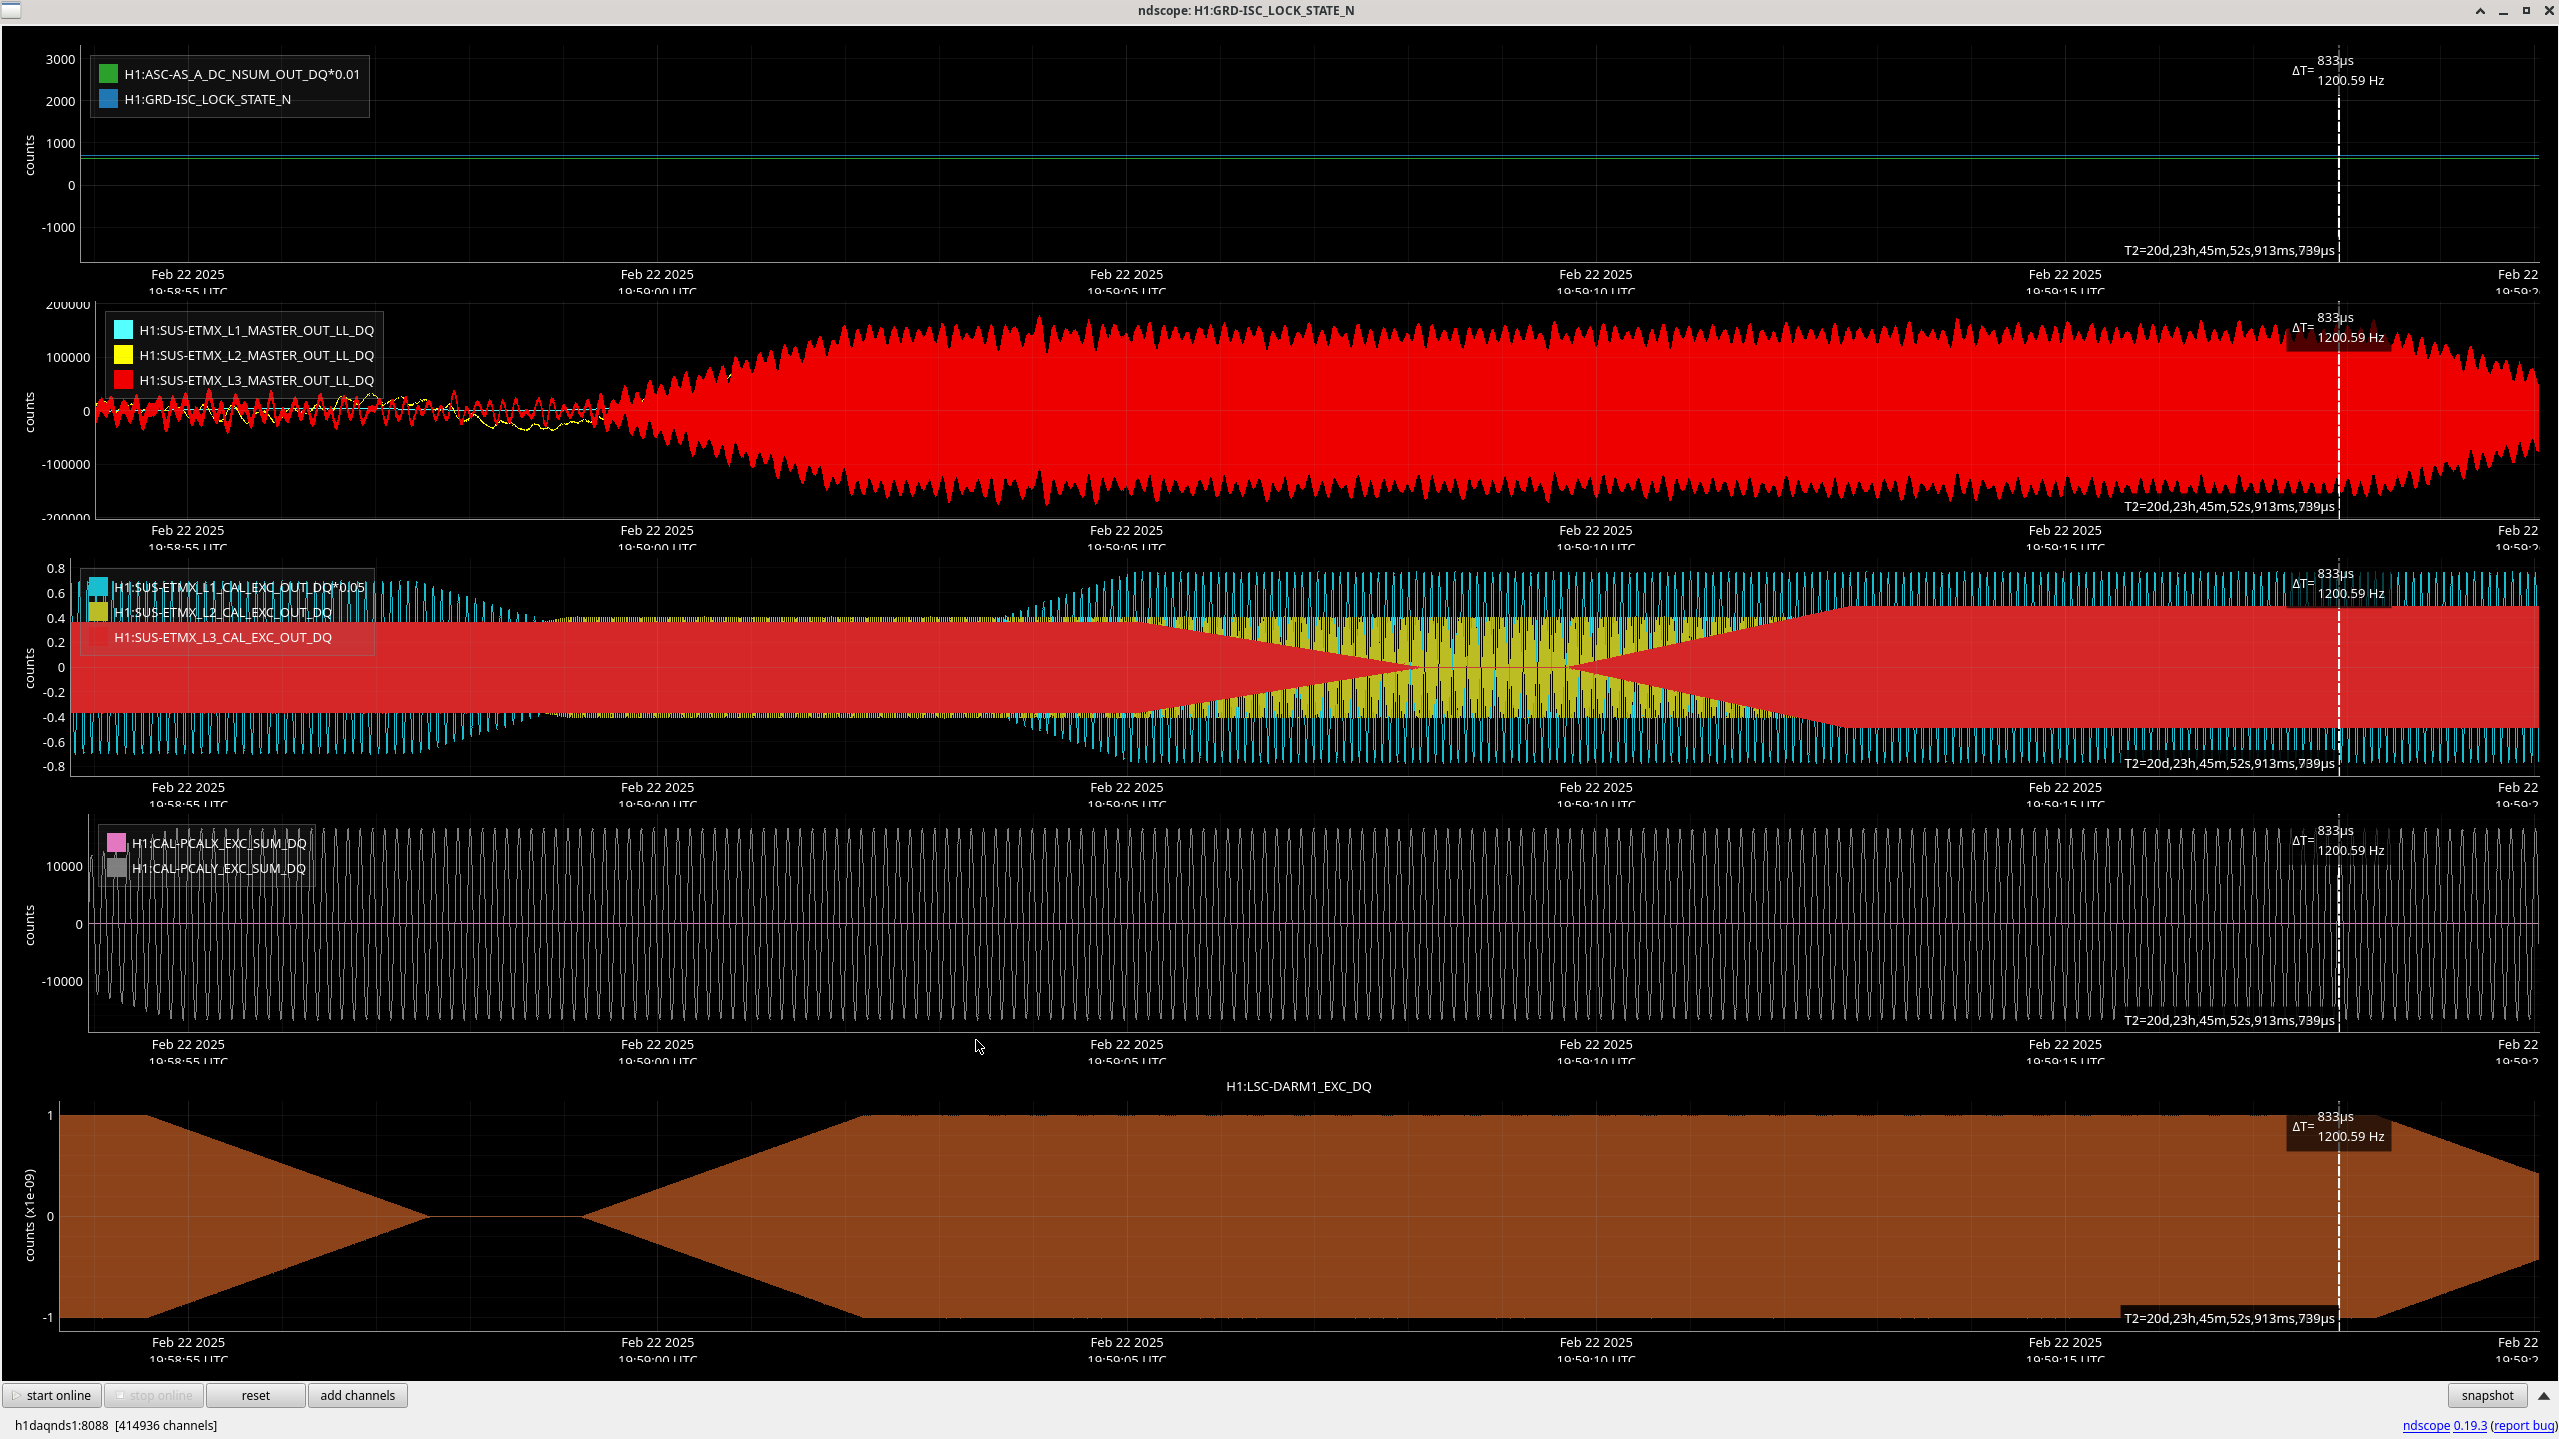
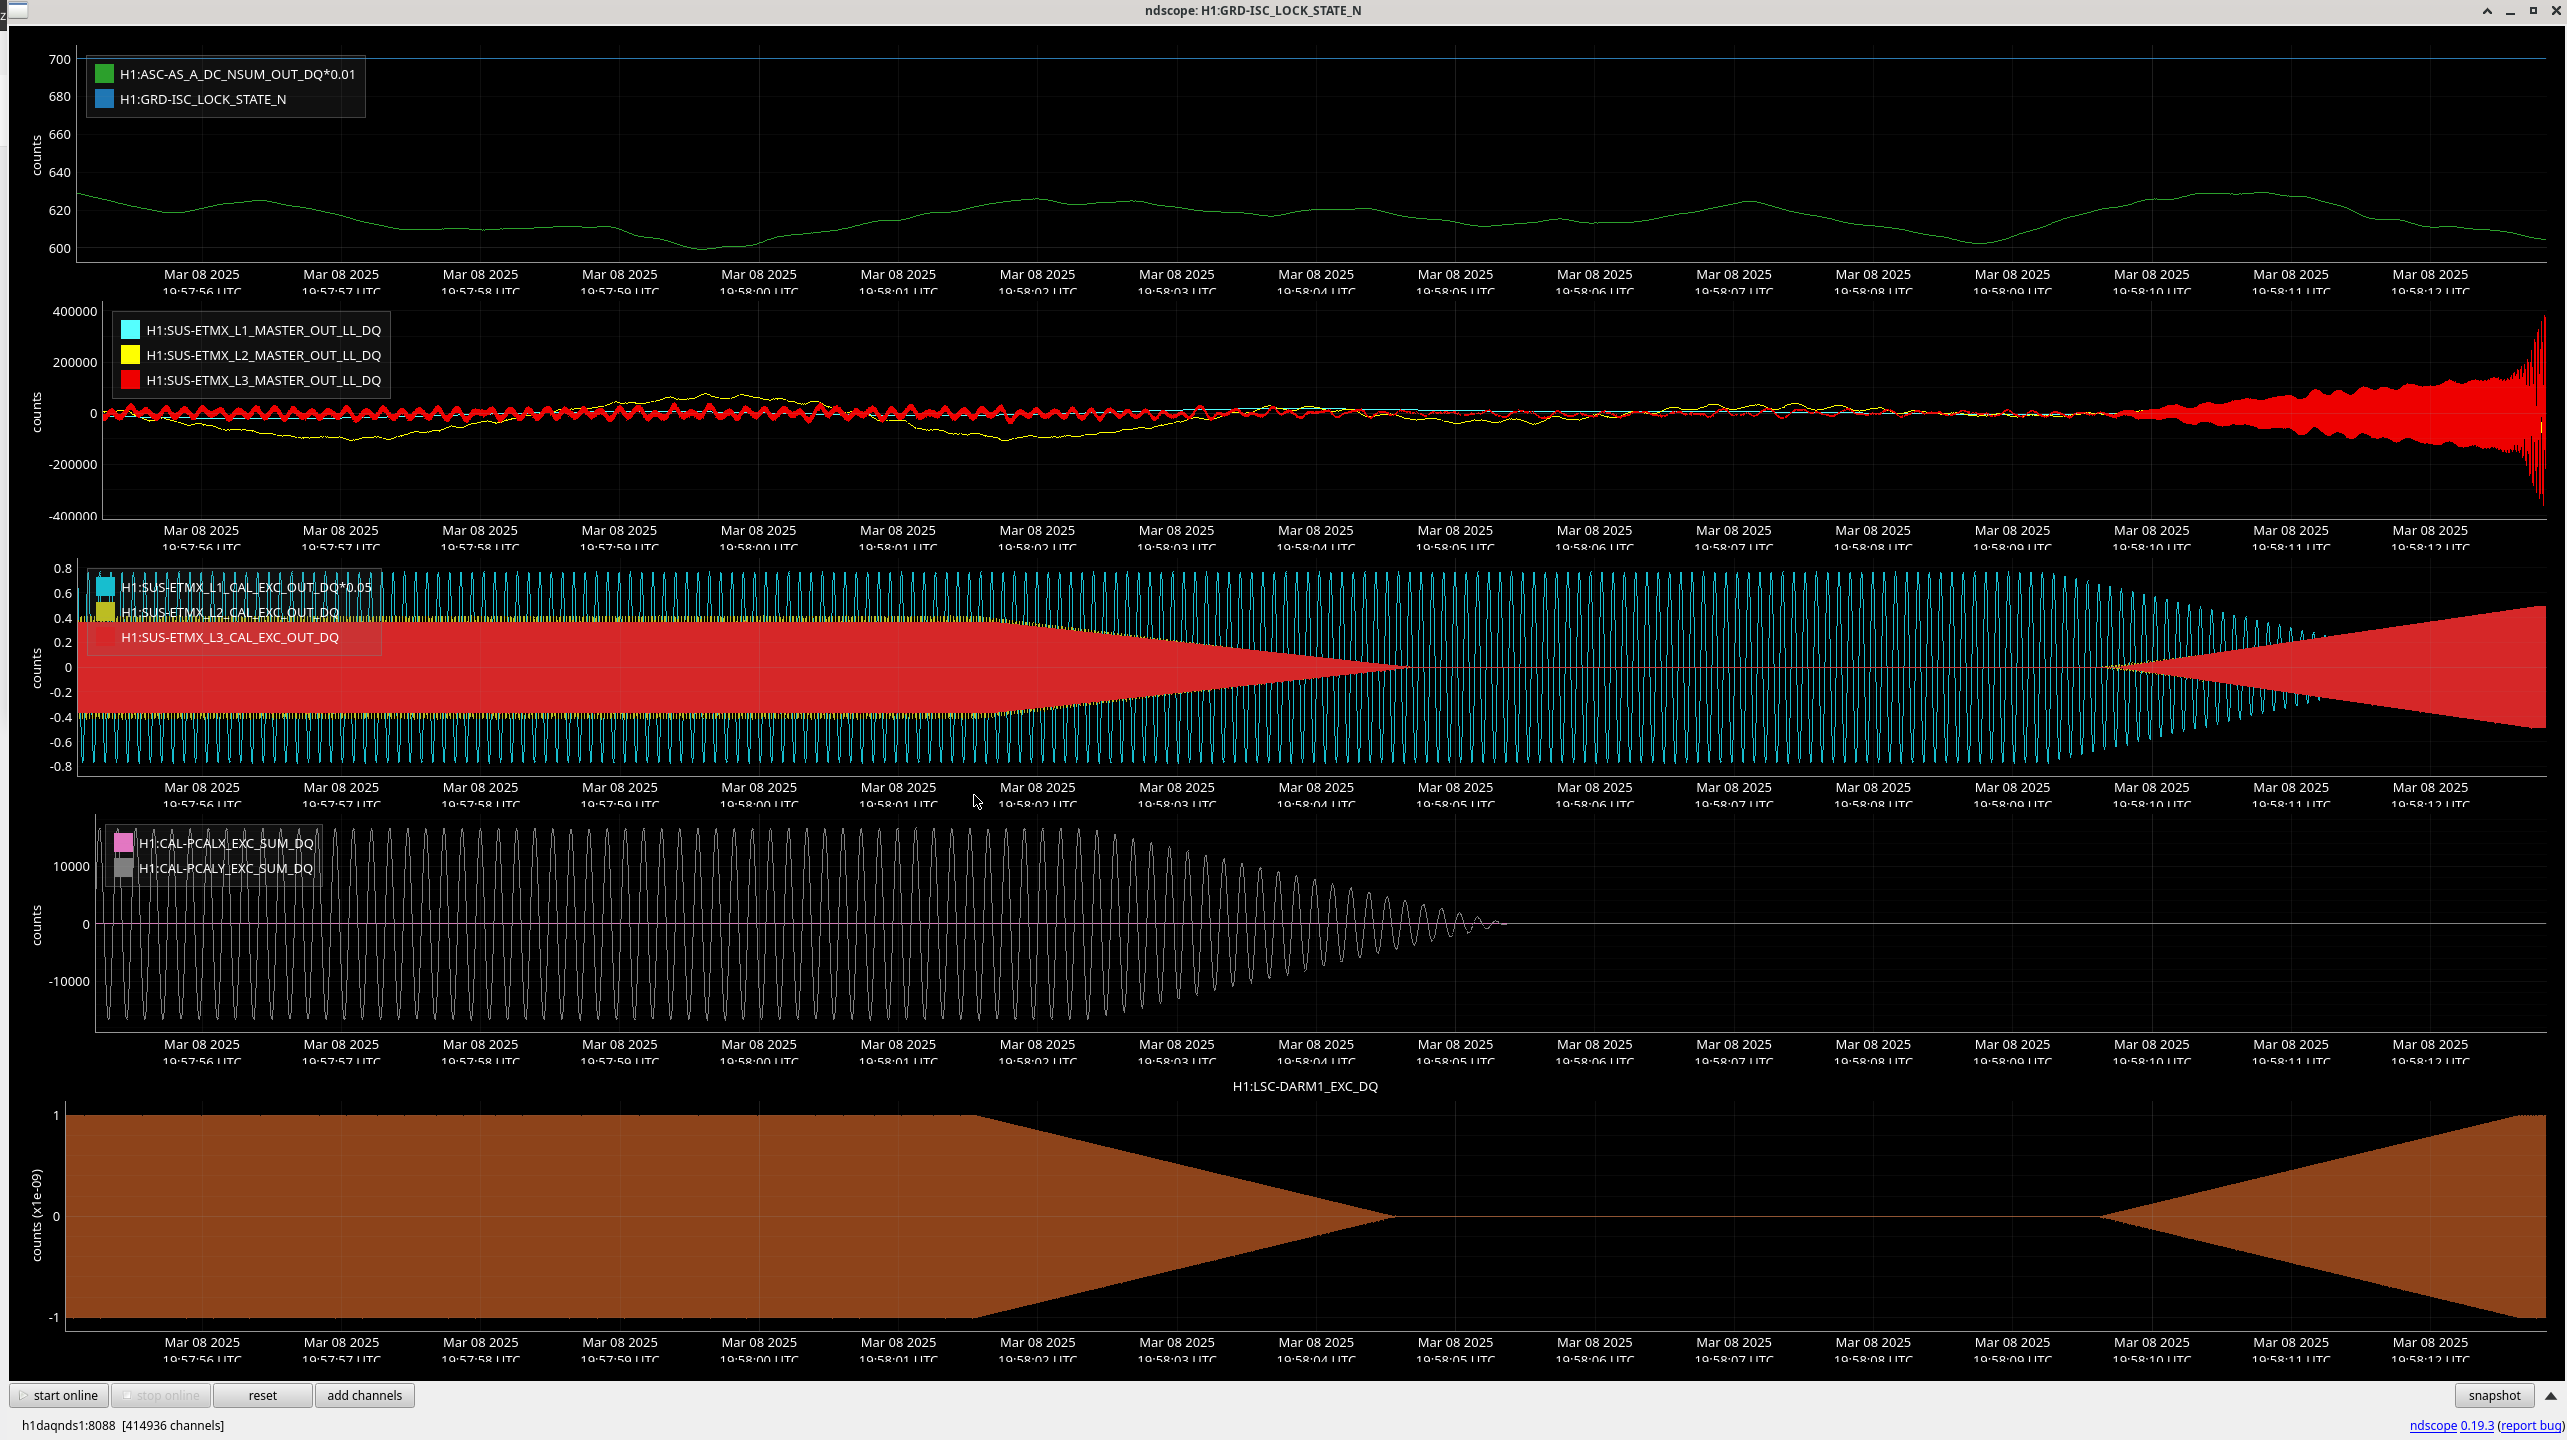
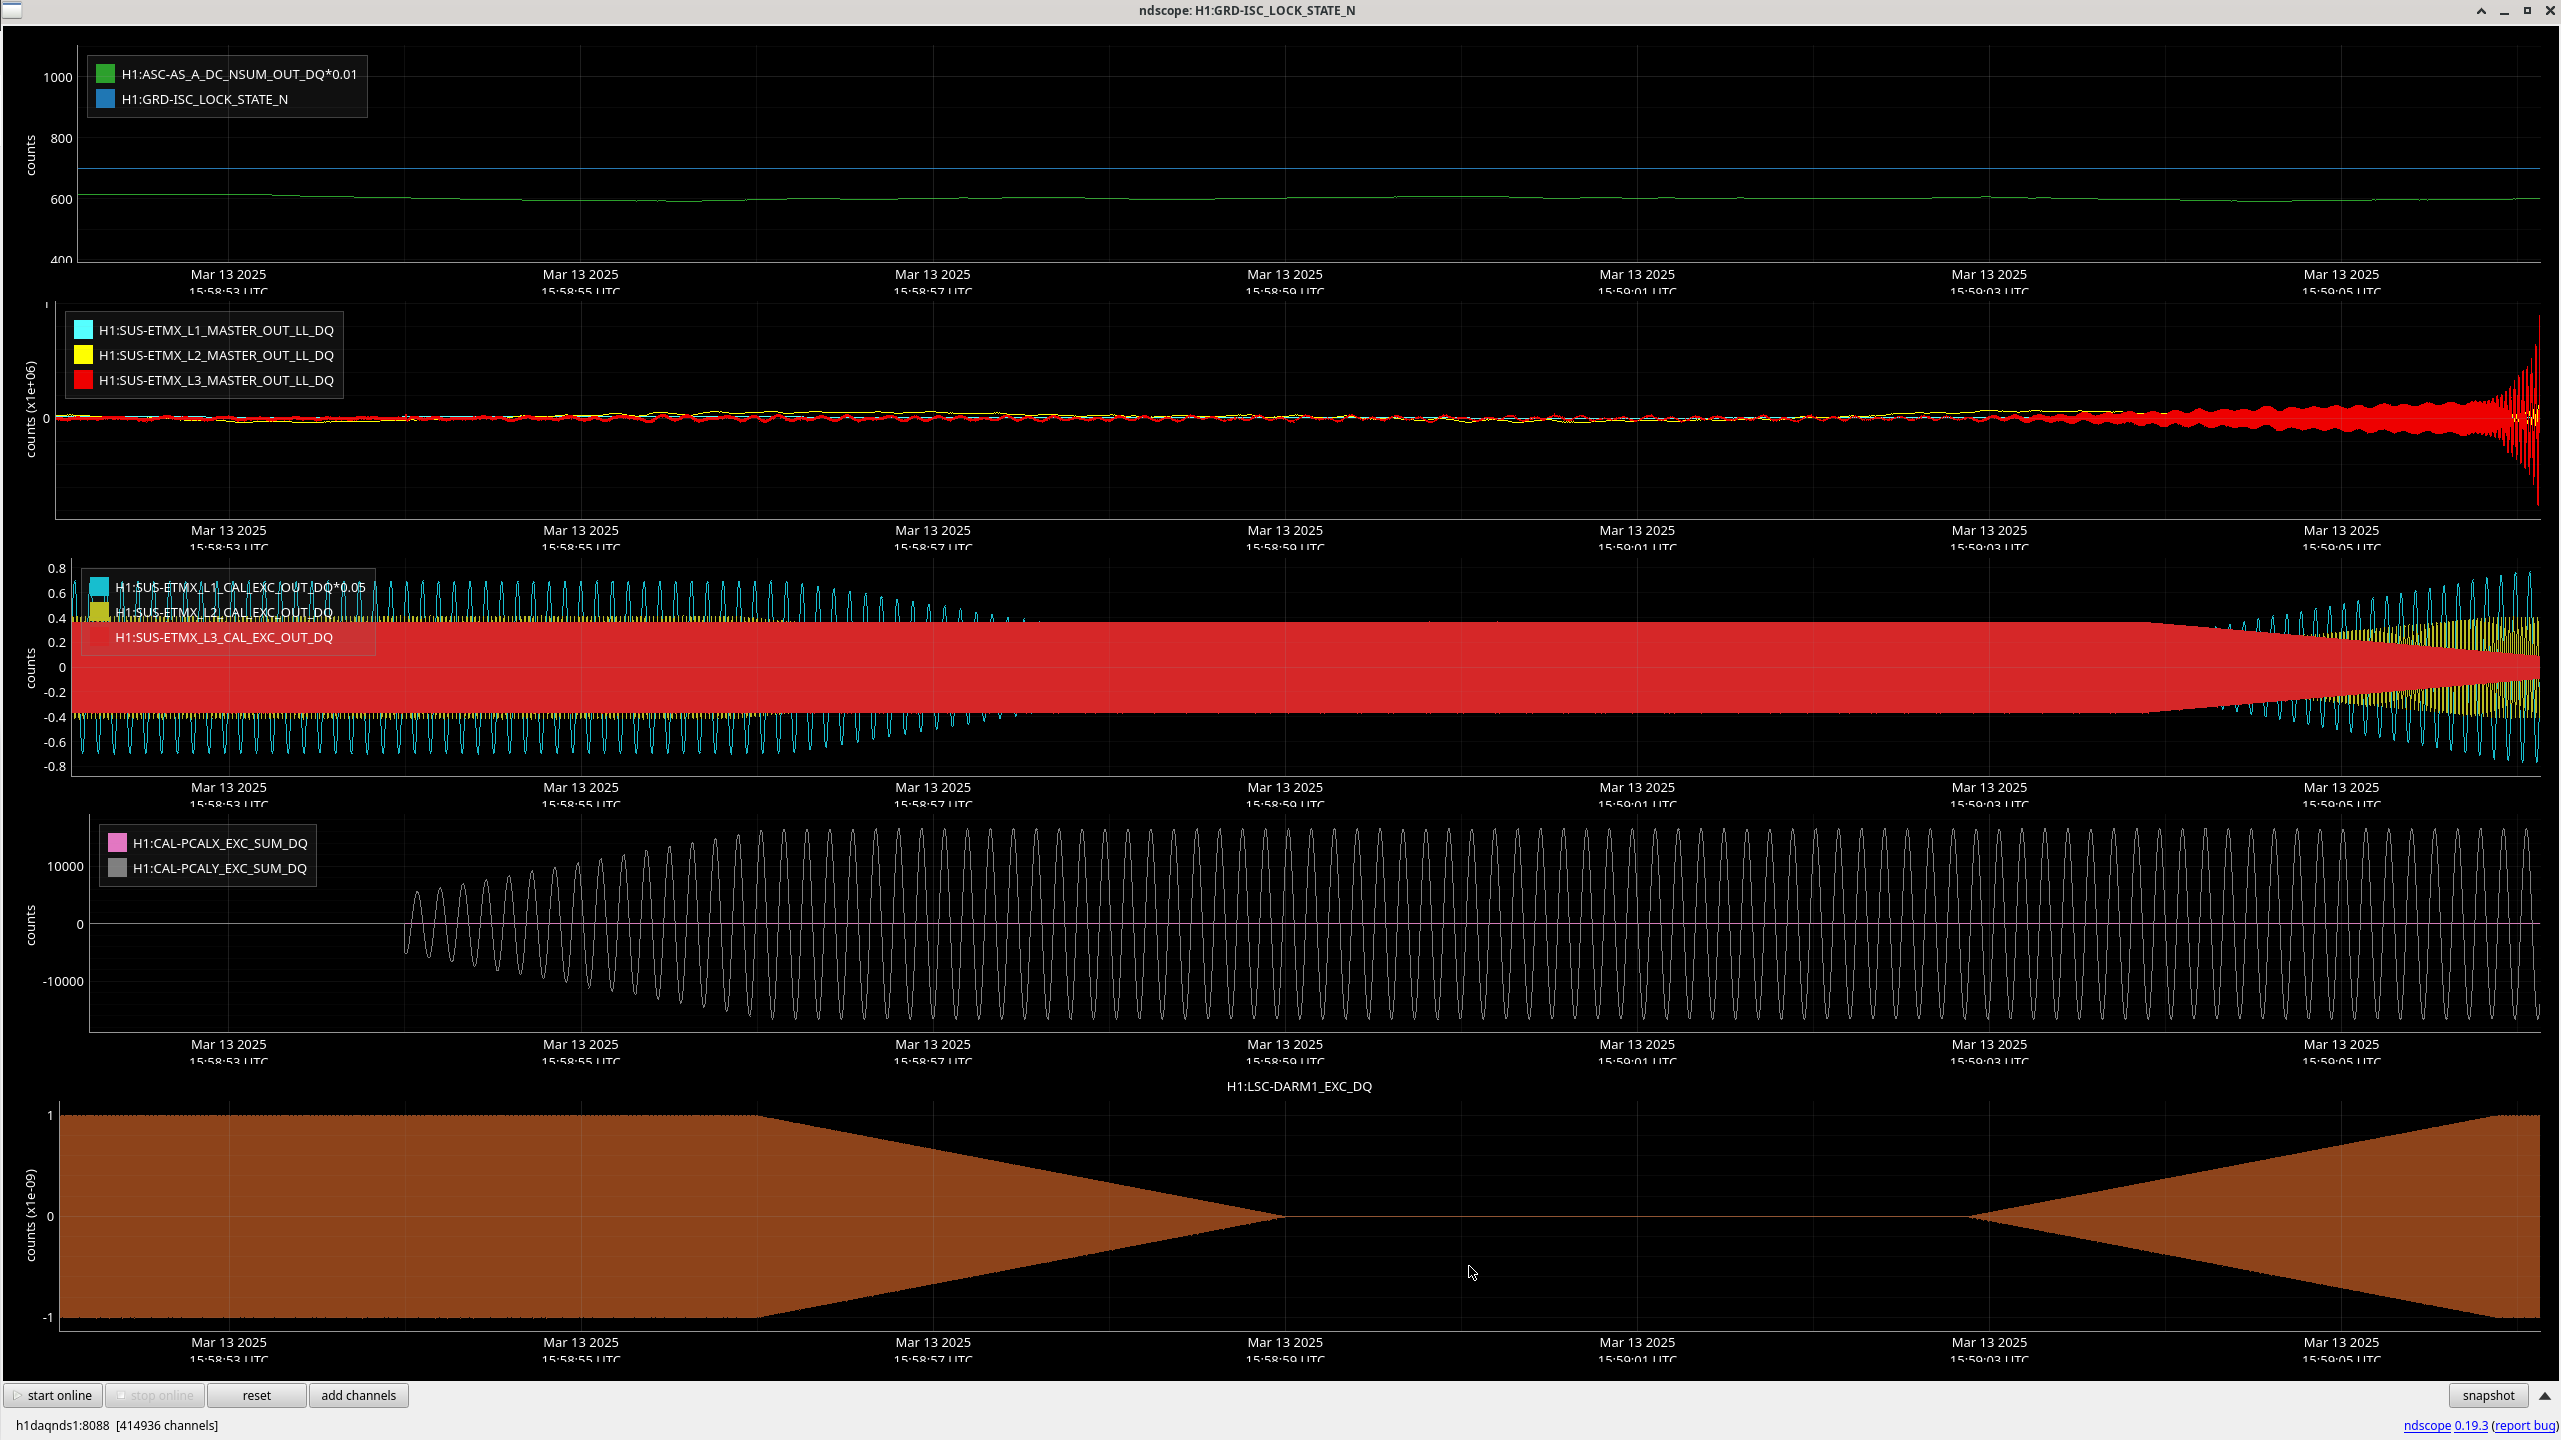
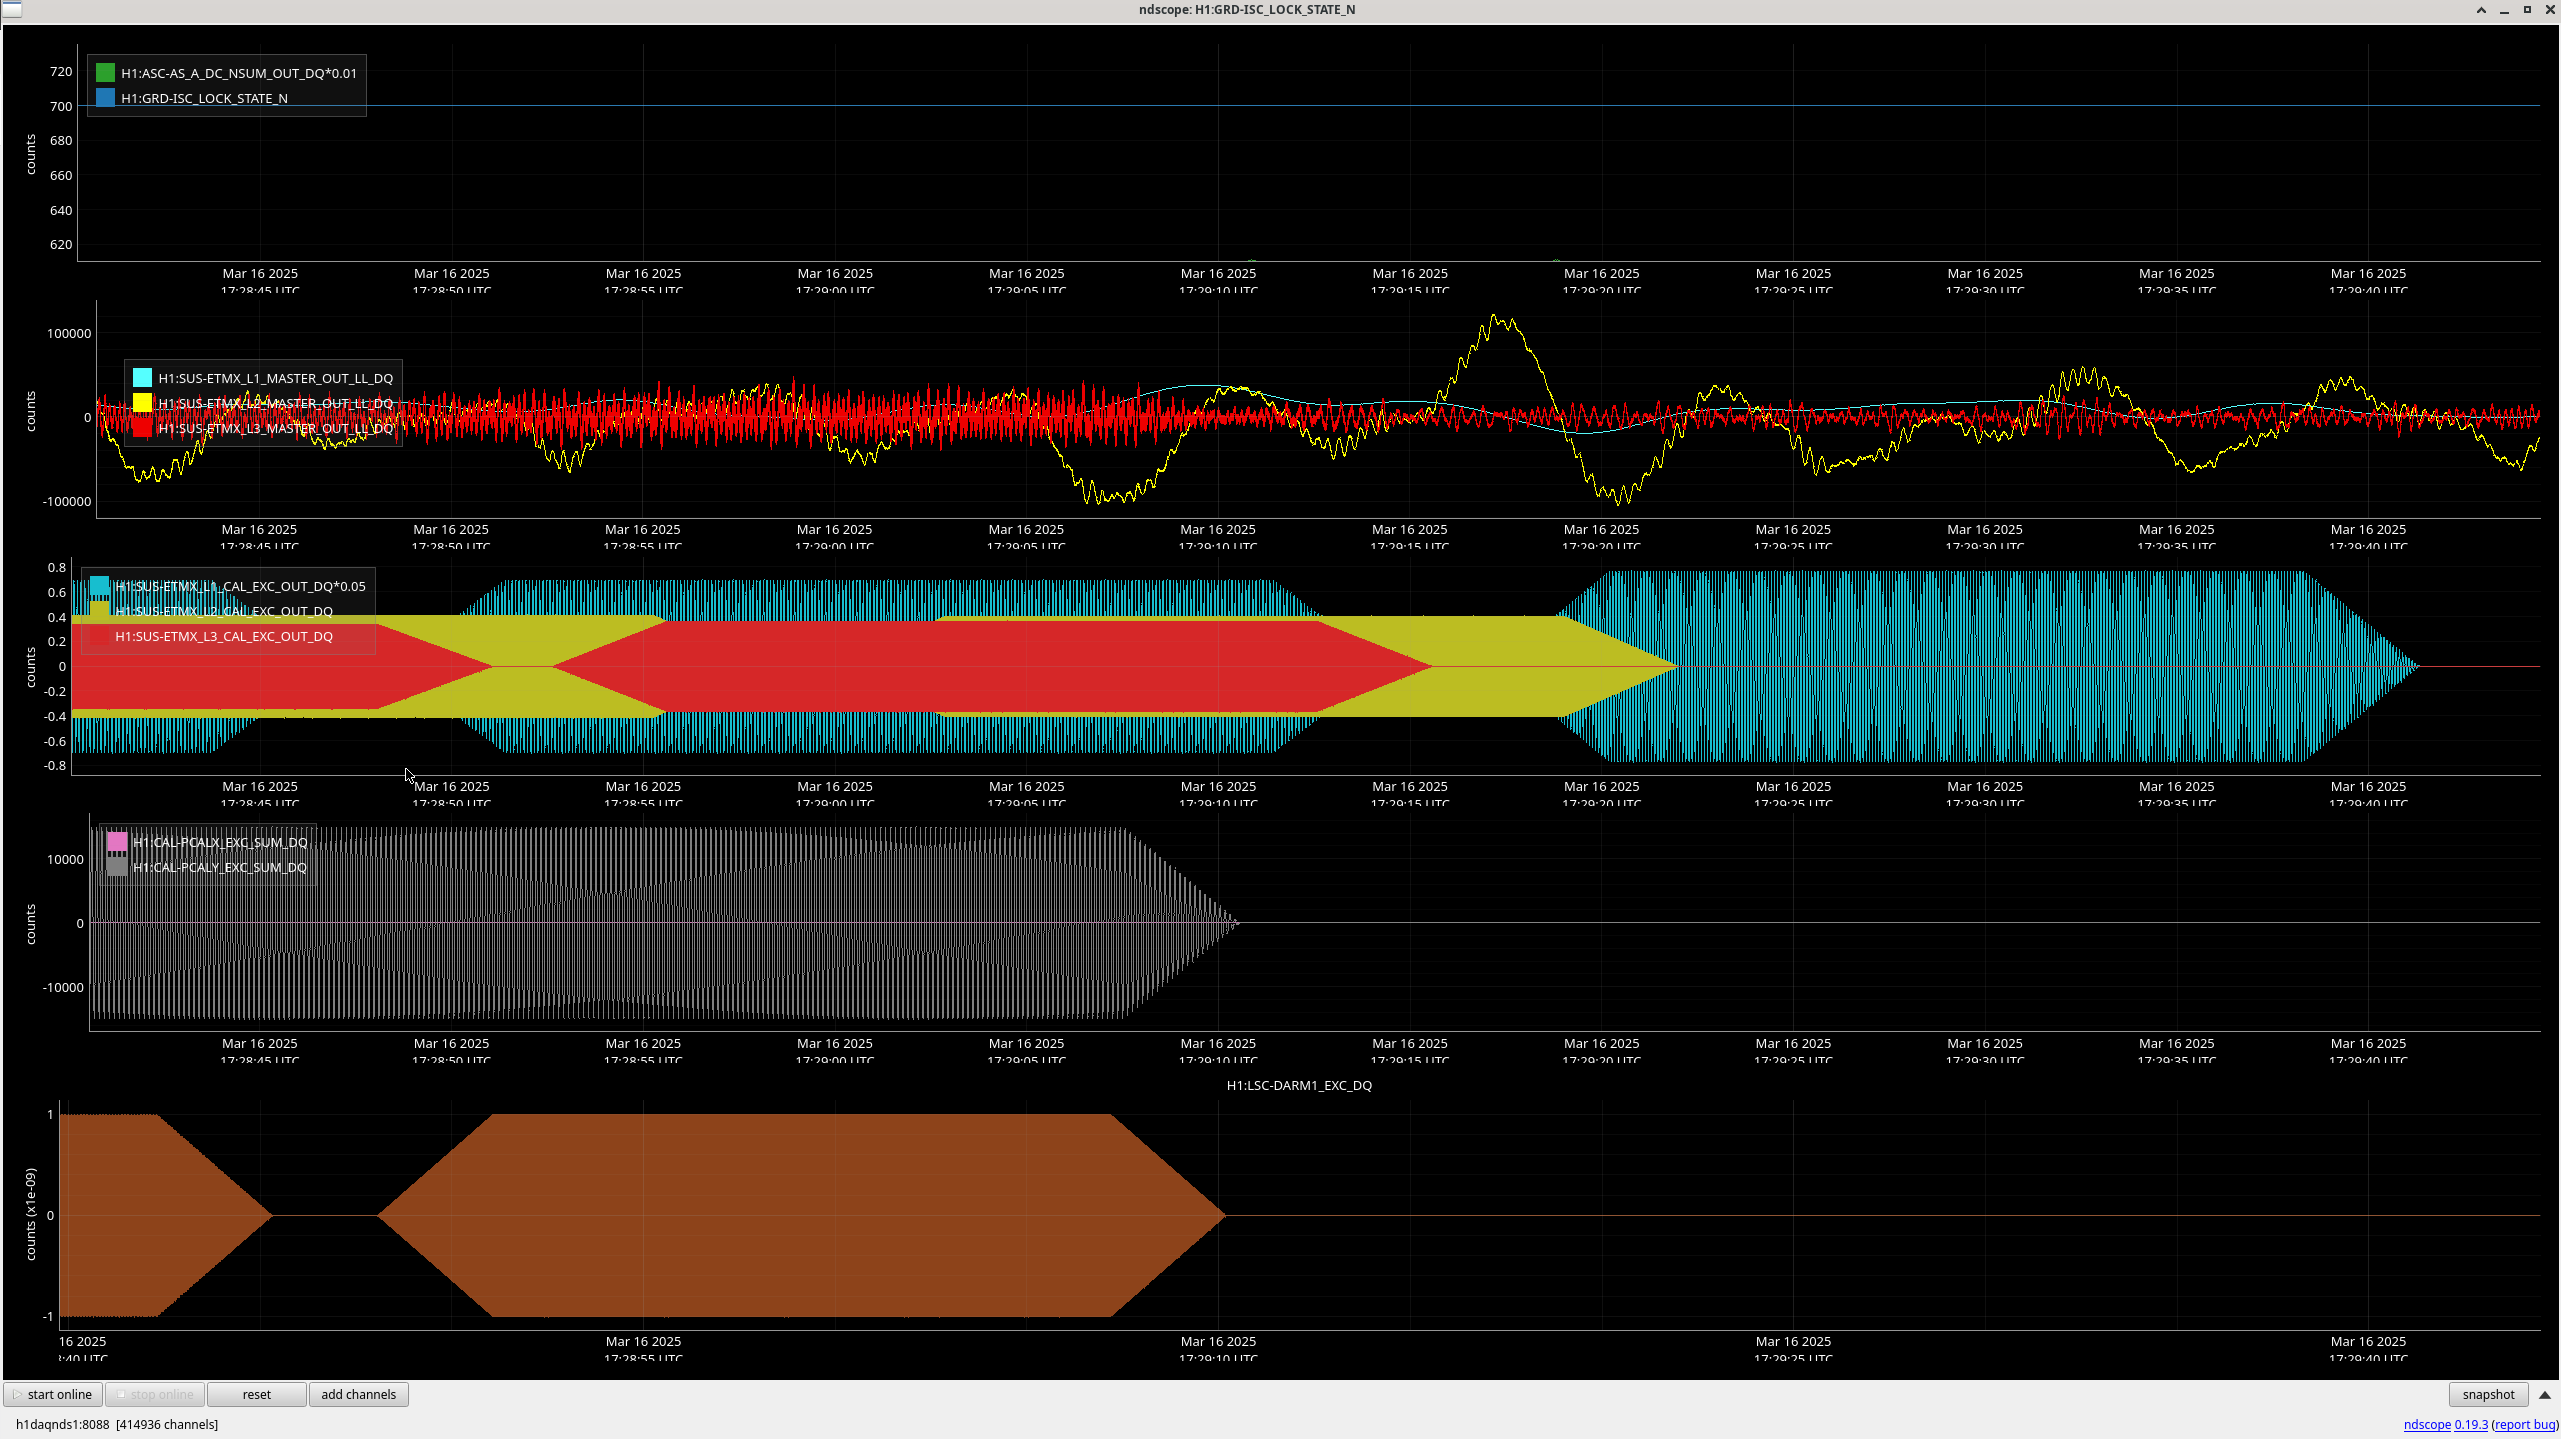
Created an nscope for viewing the calibration injections. ndscope /ligo/home/anthony.sanchez/Desktop/CALsweepEXCchans.yaml

Tried simply looking at time series data of a number of Calibration measurements,  and calibration excitation channels, trying to determine if there was something easy to find that would set apart the Cal sweeps that survive Vs the Locklosses.
I was also cross checking some of the injections with their Log files found here:
/opt/rtcds/userapps/release/cal/common/scripts/simuLines/logs/H1

I looked at 9 Different CAL measurements:
Things to Note:
As mentioned in Camilla's alog about the locklosses during Calibration, There does seem to be a 43.6hz Signal that is being found in ETMX_L3_MASTER that gets ramped up when we have a lockloss but Not when we survive the Calibration.
There is also a tendancy for the DARM1_EXC signal to Show up in ETMX_L3_MASTER_OUT but only at certain frequecies, I'm currently not sure if that is intentional or not.
 

Date LL/ Survived Well Staggered Gain Ramp ups? DARM1_EXC signal found in ETMX_L3_MASTER OUT? 43.6 hz Signal Found in ETMX_L3_MASTER?
Feb 1st Survived Yes, All gains Ramped up 1by1 and staggered. Yes, 1200 hz Not visible on time series, A 7 Hz signal is though.
Feb 6th LL Yes Yes 1200 Yes
Feb 15th LL No, L2& L3 CAL_EXC Ramp at the Same time. Yes 1098 hz Lost lock at 1098 Hz on this one Not visible on time series, A 7 Hz signal is though.
LL Looks different than the rest.
Feb 20th Survived No, DARM1_EXC and ETMX_L3_CAL Yes, 1200 hz Not visible on time series, A 7 Hz signal is though.
Feb 22nd Survived Well Staggered Yes 1200HZ Not visible on time series, A 7 Hz signal is though.
Mar 6th LL No, ETMX_L2_CAL & DARM1 Ramp up at the same time yes 1200 hz Yes
Mar 8th LL No ETMX_L2 & L3_CAL & DARM1 Ramp at the same time Yes 1200 hz yes
Mar 13th LL No ETMX_L2 & L3_CAL & DARM1 Ramp at the same time Yes 1200 yes
Mar 16th Survived Yes very well staggered Ramp times No 1200 HZ line was run at all No


I don't feel like this was all that fruitful to me, but hopefully someone else might find this useful?

Images attached to this report
H1 SQZ (SQZ)
corey.gray@LIGO.ORG - posted 19:58, Friday 21 March 2025 (83497)
OBSERVING Drop: SQZ SHG Fiber Rejected Power Has Been High Since Mon (3/17) Night

H1 just had a drop from OBSERVING due to the Squeezer's OPO_LR.  The Squeezer came back on its own in less than 2-min.

We do have the following message for the SQZ_OPO_LR node: 

"pump fiber rej power in ham7 high, nominal 35e-3, align fiber pol on sqzt0"

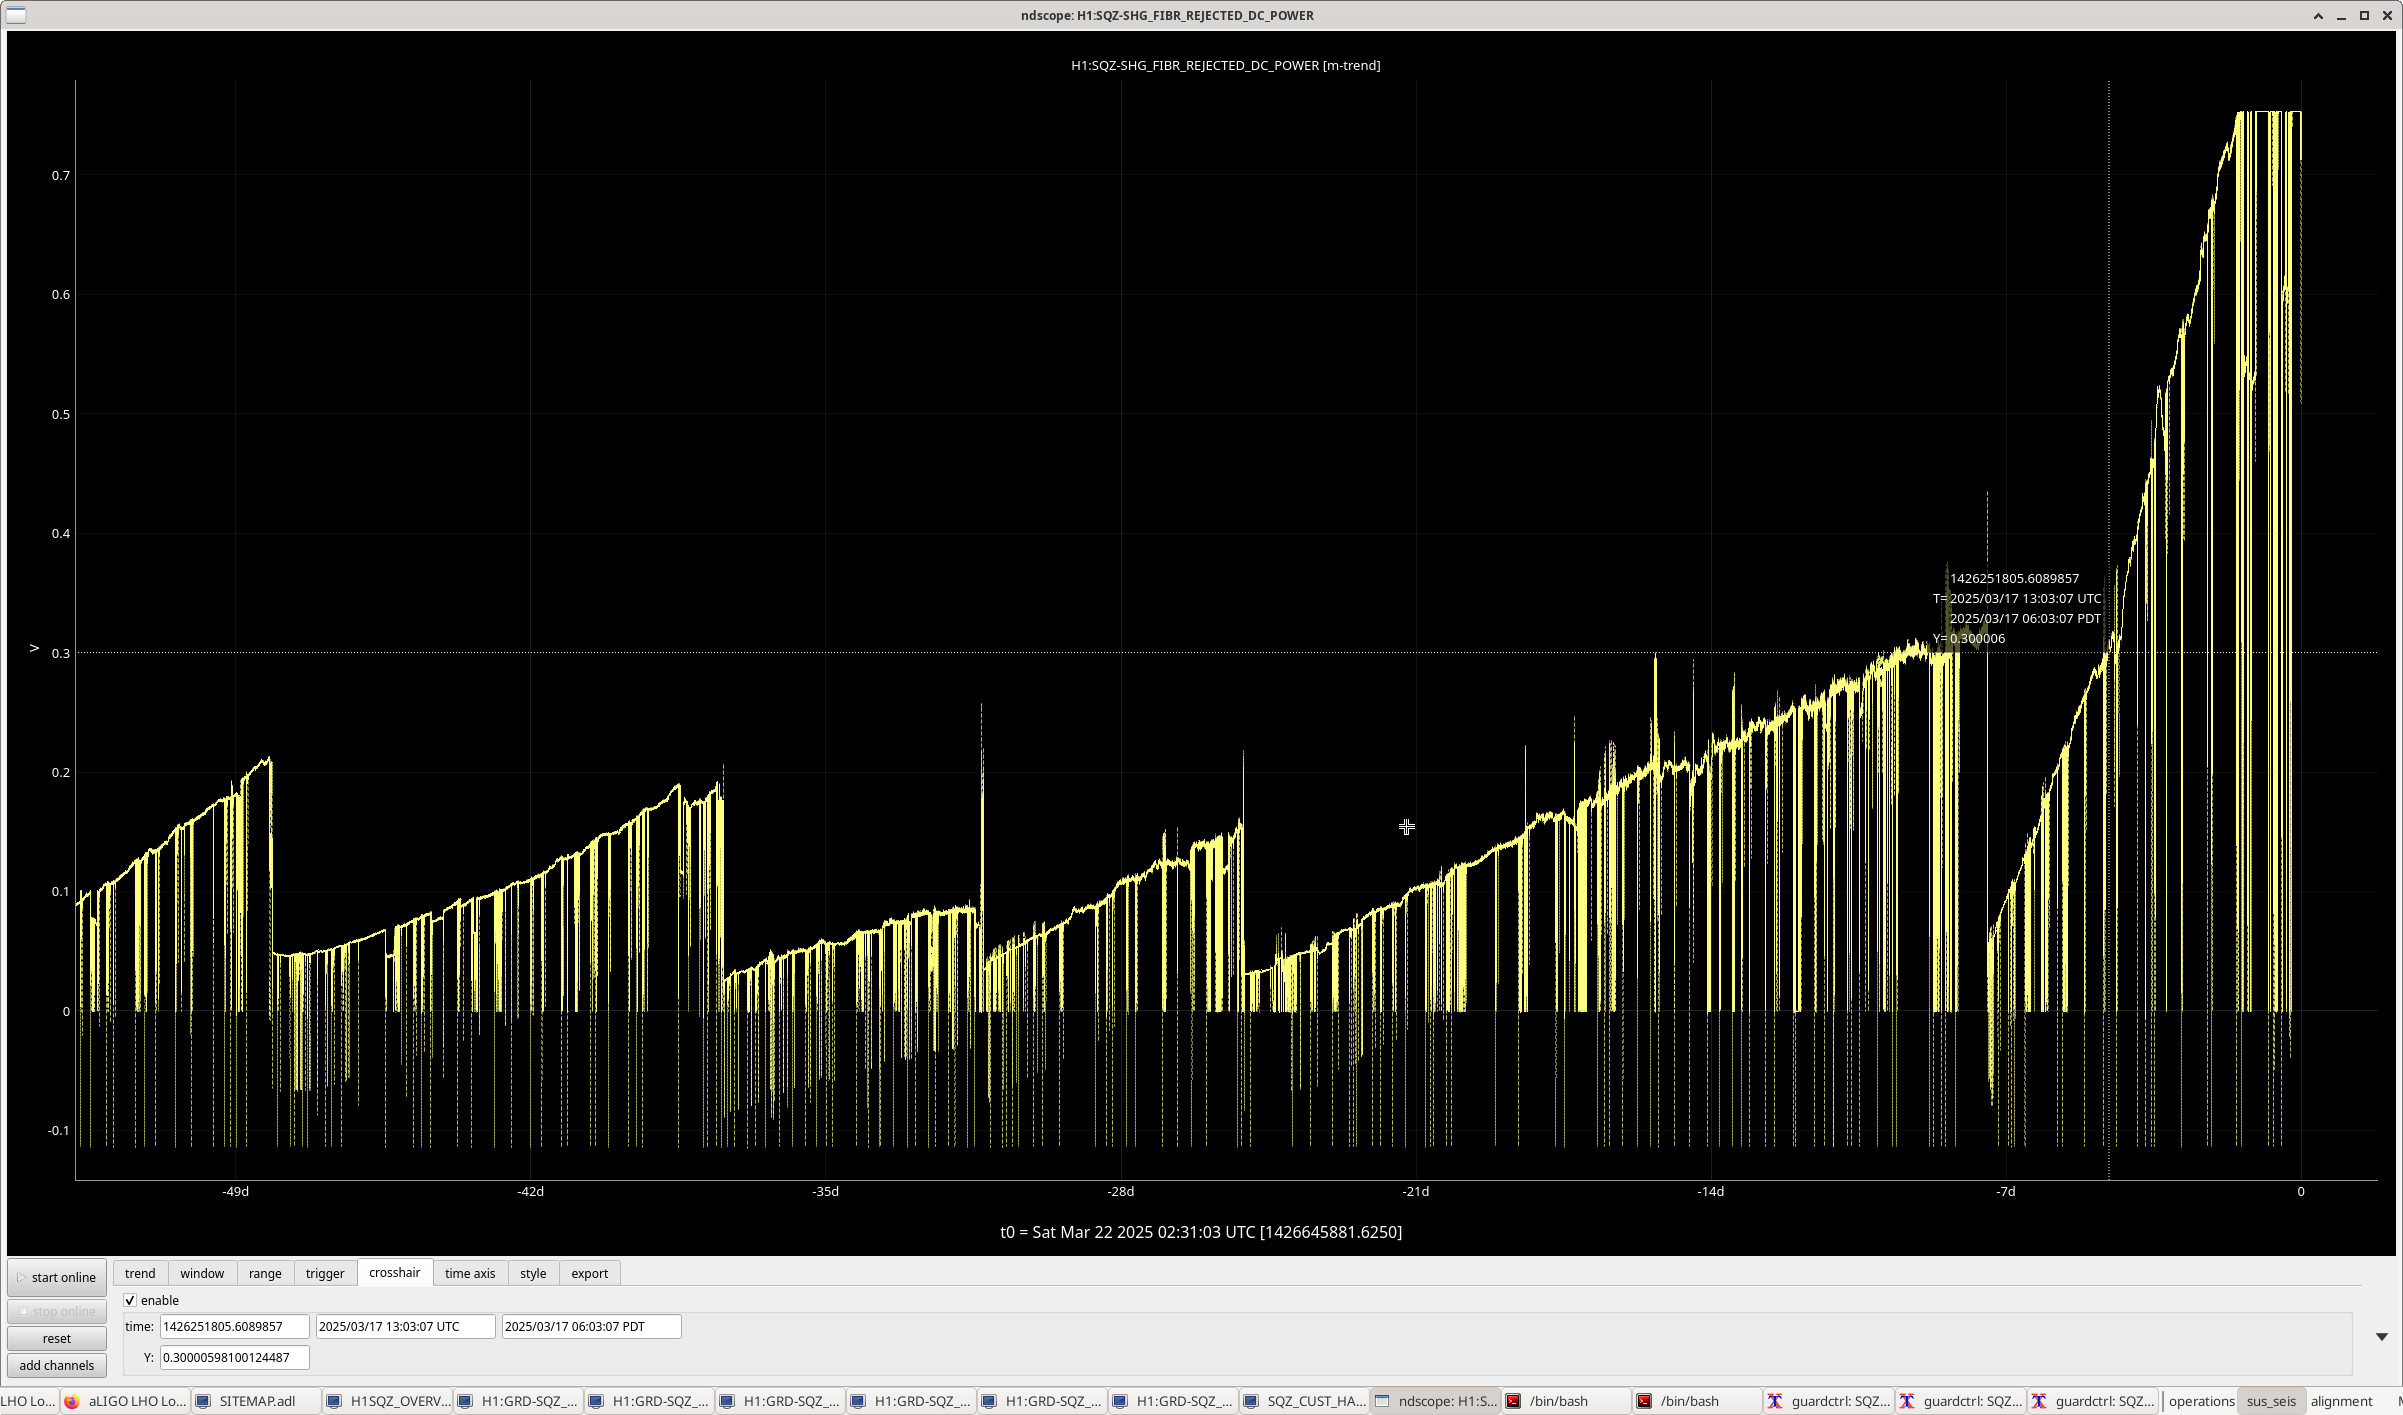
And it looks like SHG Fiber Rejected Power has had a high value (over 0.350 counts) since Mon (see RyanC's alog83406) and has been railing at 0.753 the last few days. (see attached).   Trending back further shows that this Rejected Power hasn't had this sustained railing since way back in Aug-Oct 2023.

Since H1's been (1) running like this the last few days, (2) SQZ came back quick, and the (3) H1 range looks "normal (around 150Mpc)----took H1 back to Observing and tagging SQZ.

Images attached to this report
H1 PSL (ISC)
jennifer.wright@LIGO.ORG - posted 18:36, Friday 21 March 2025 (83491)
Checking Alignment of all 8 PDs on ISS array

Mayank, Jennie, Siva, Keita


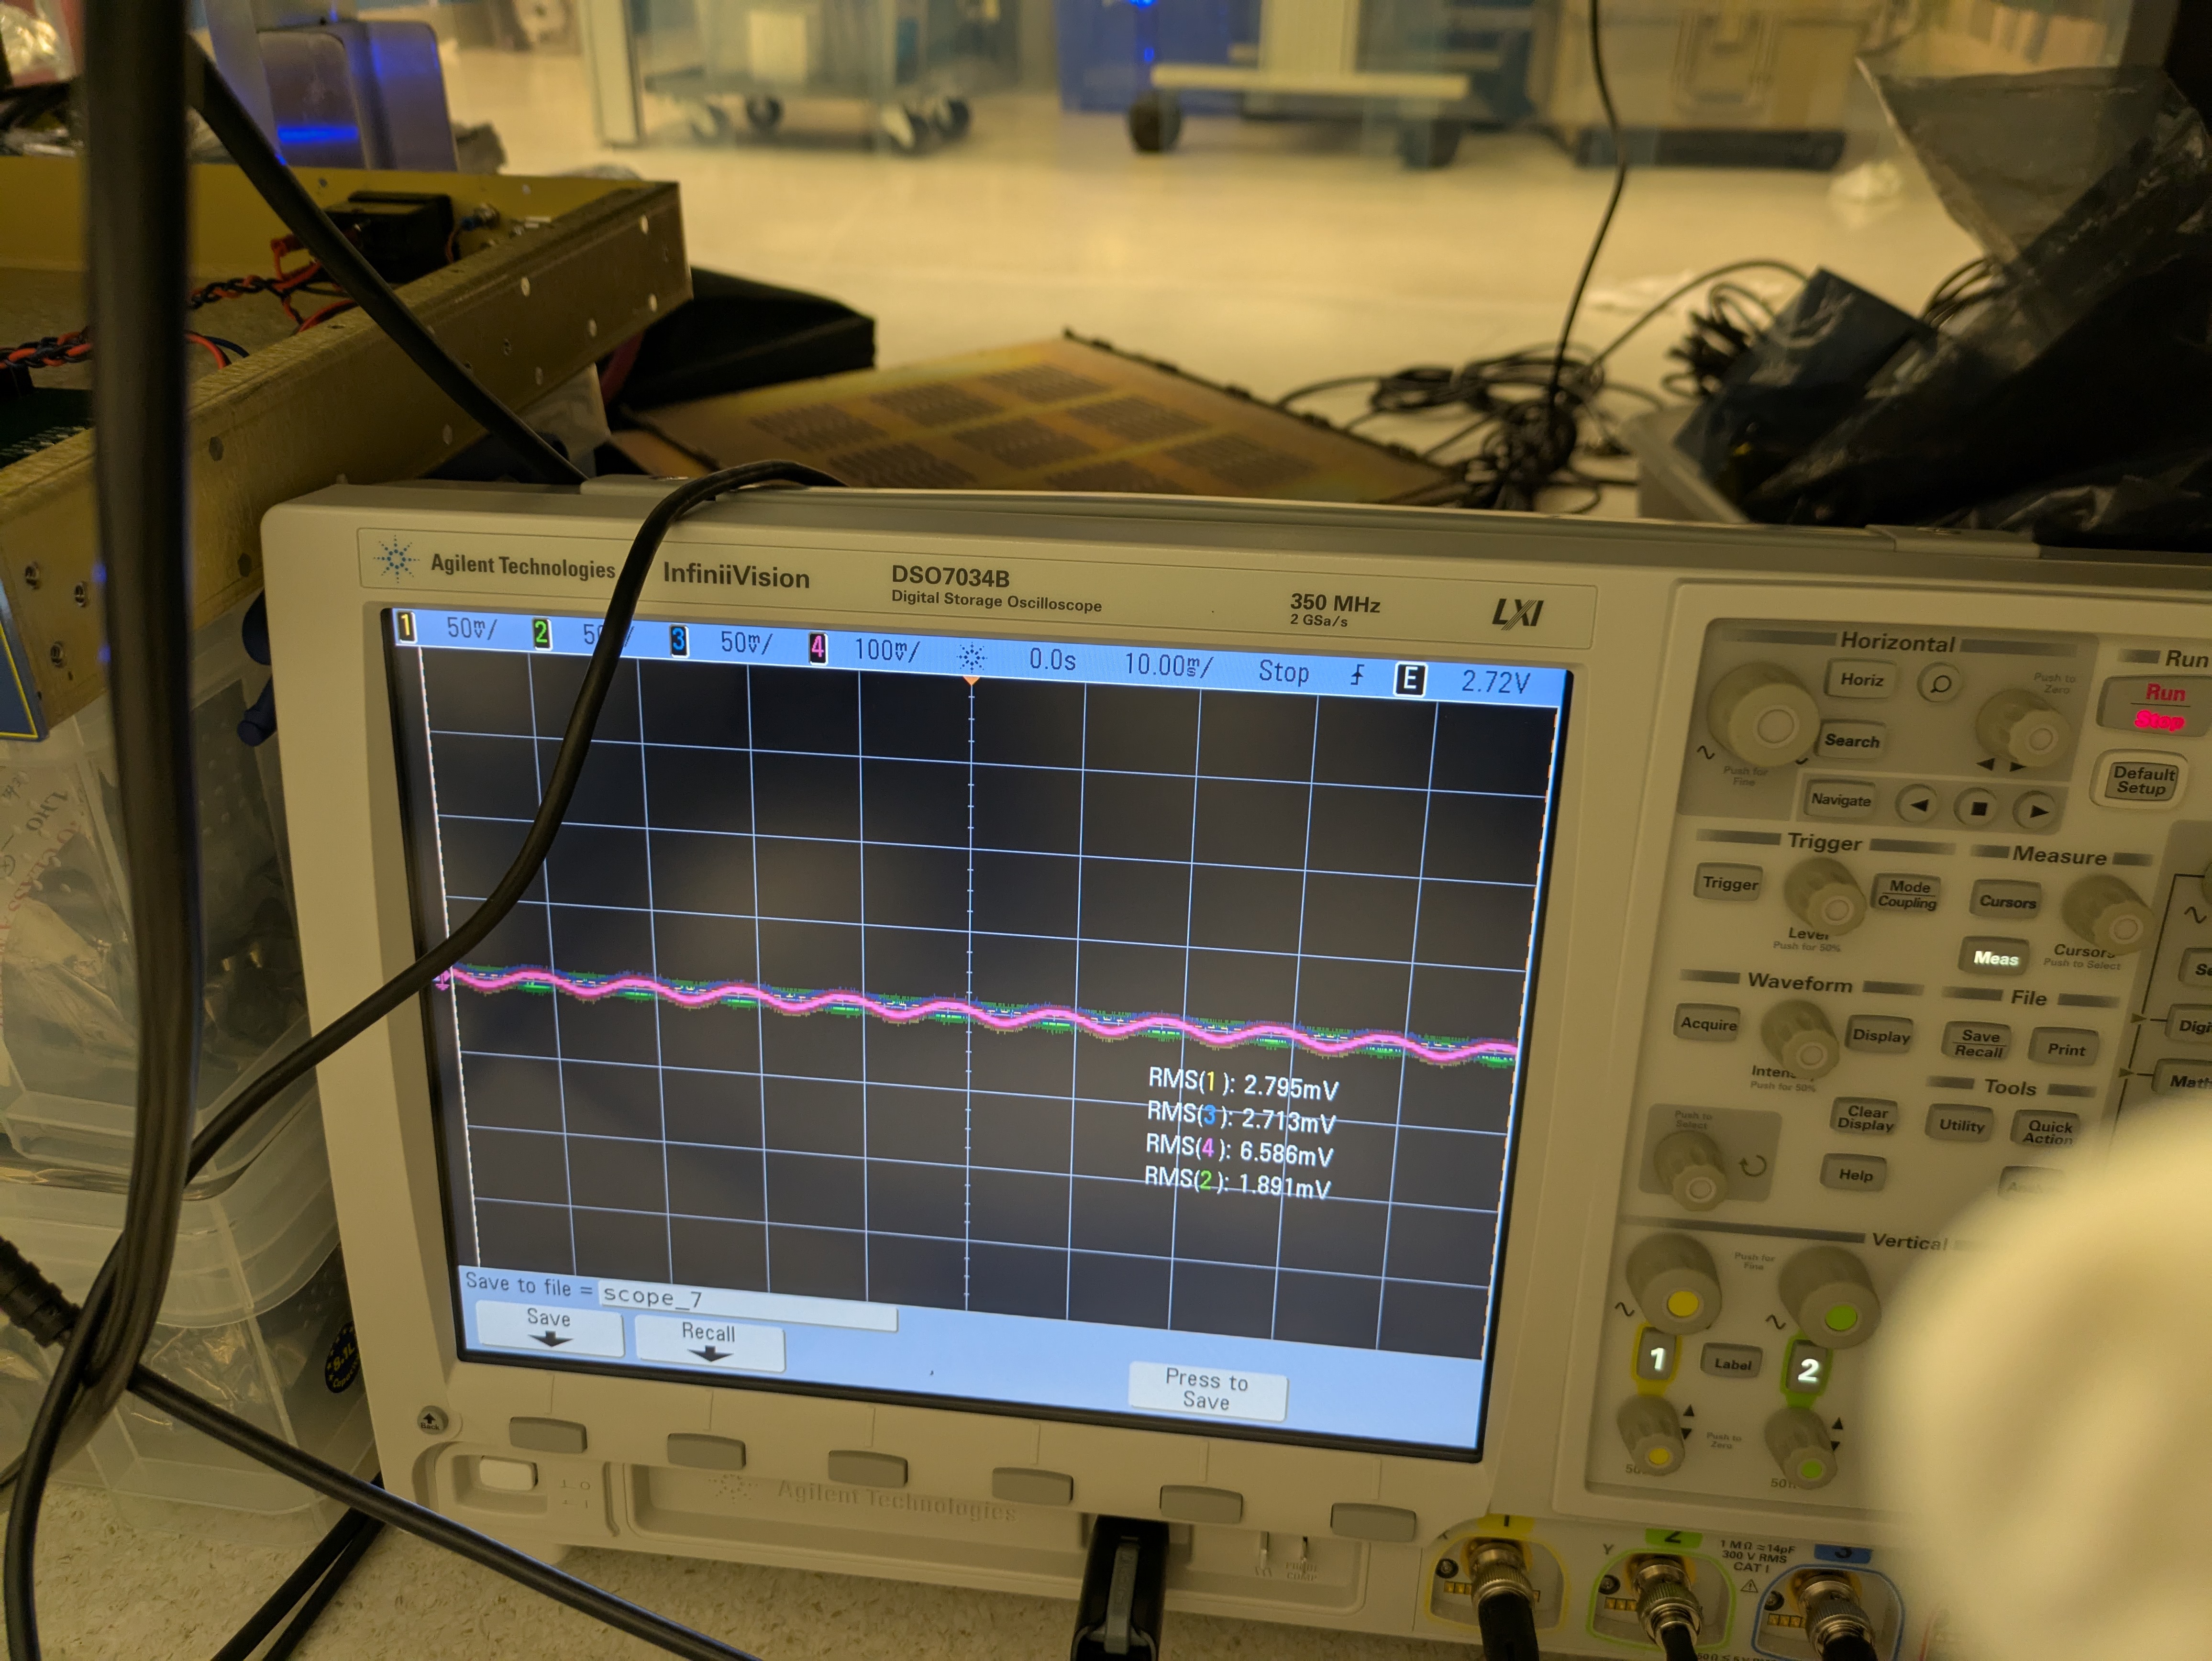
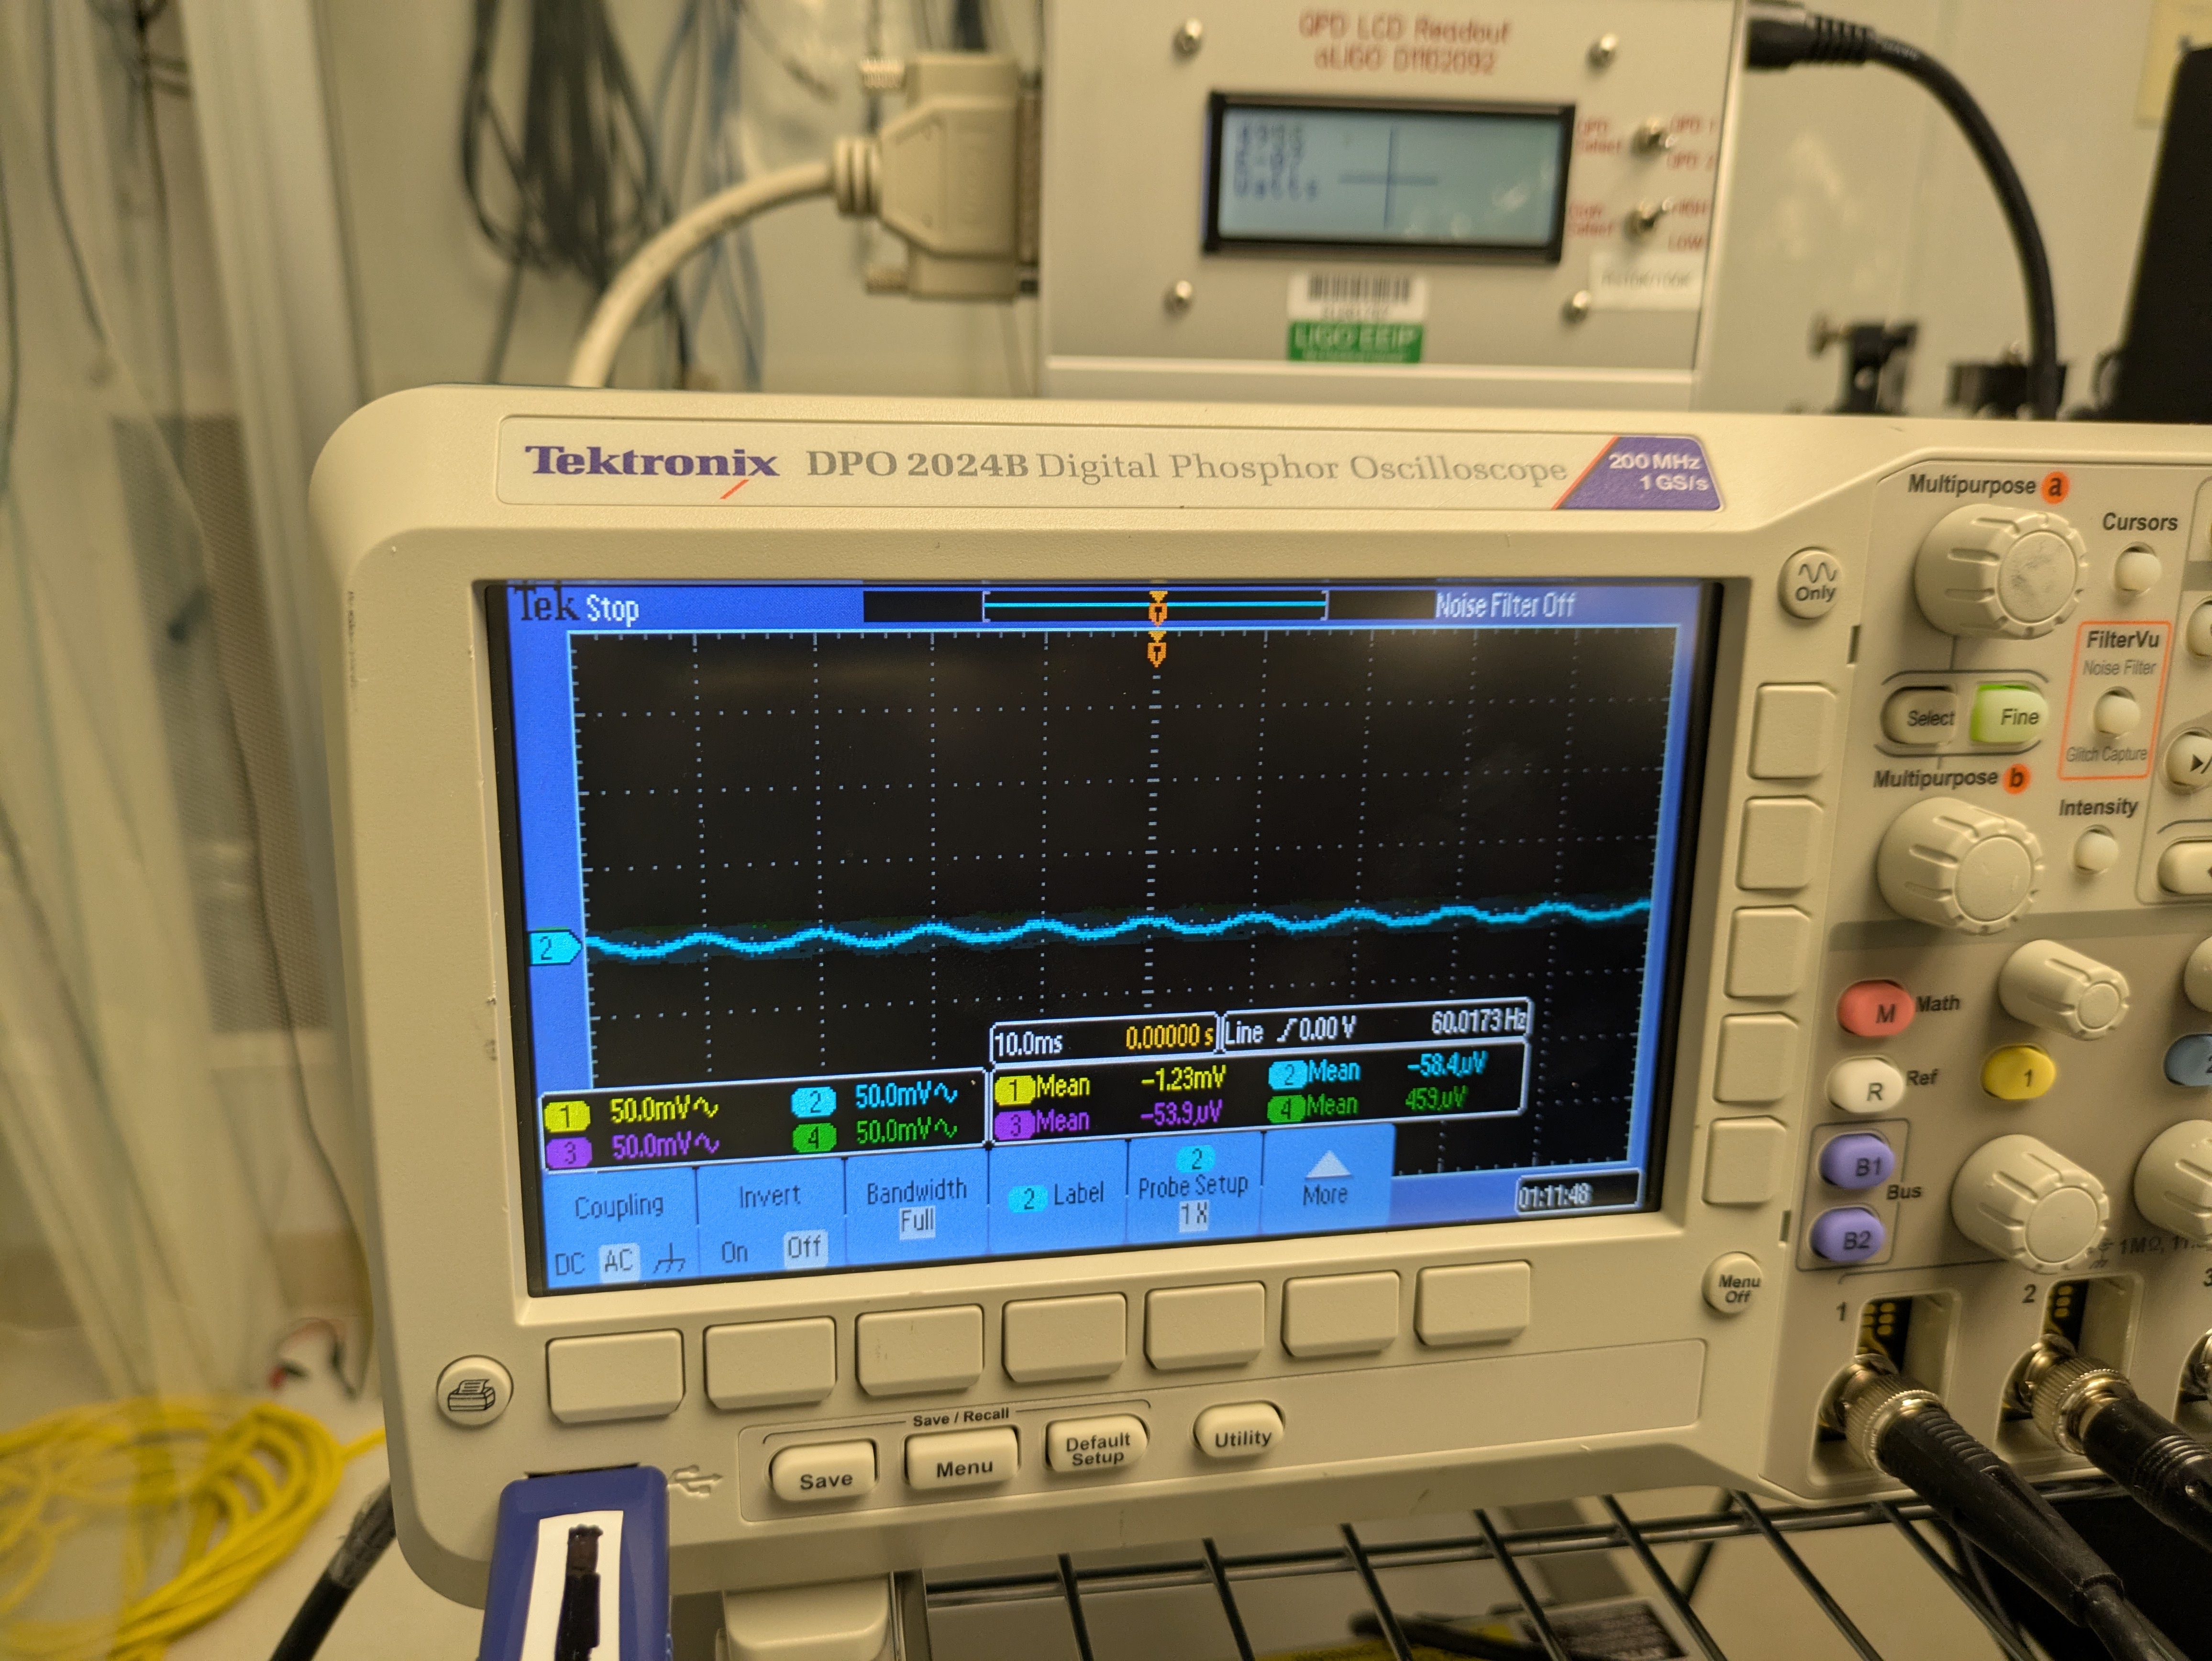
Continuing measurements carried out on the ISS arrray in alog 83077 (between that alog and today Siva and Mayank had set up measurements of the first four ISS array PDs with oscilloscopes).

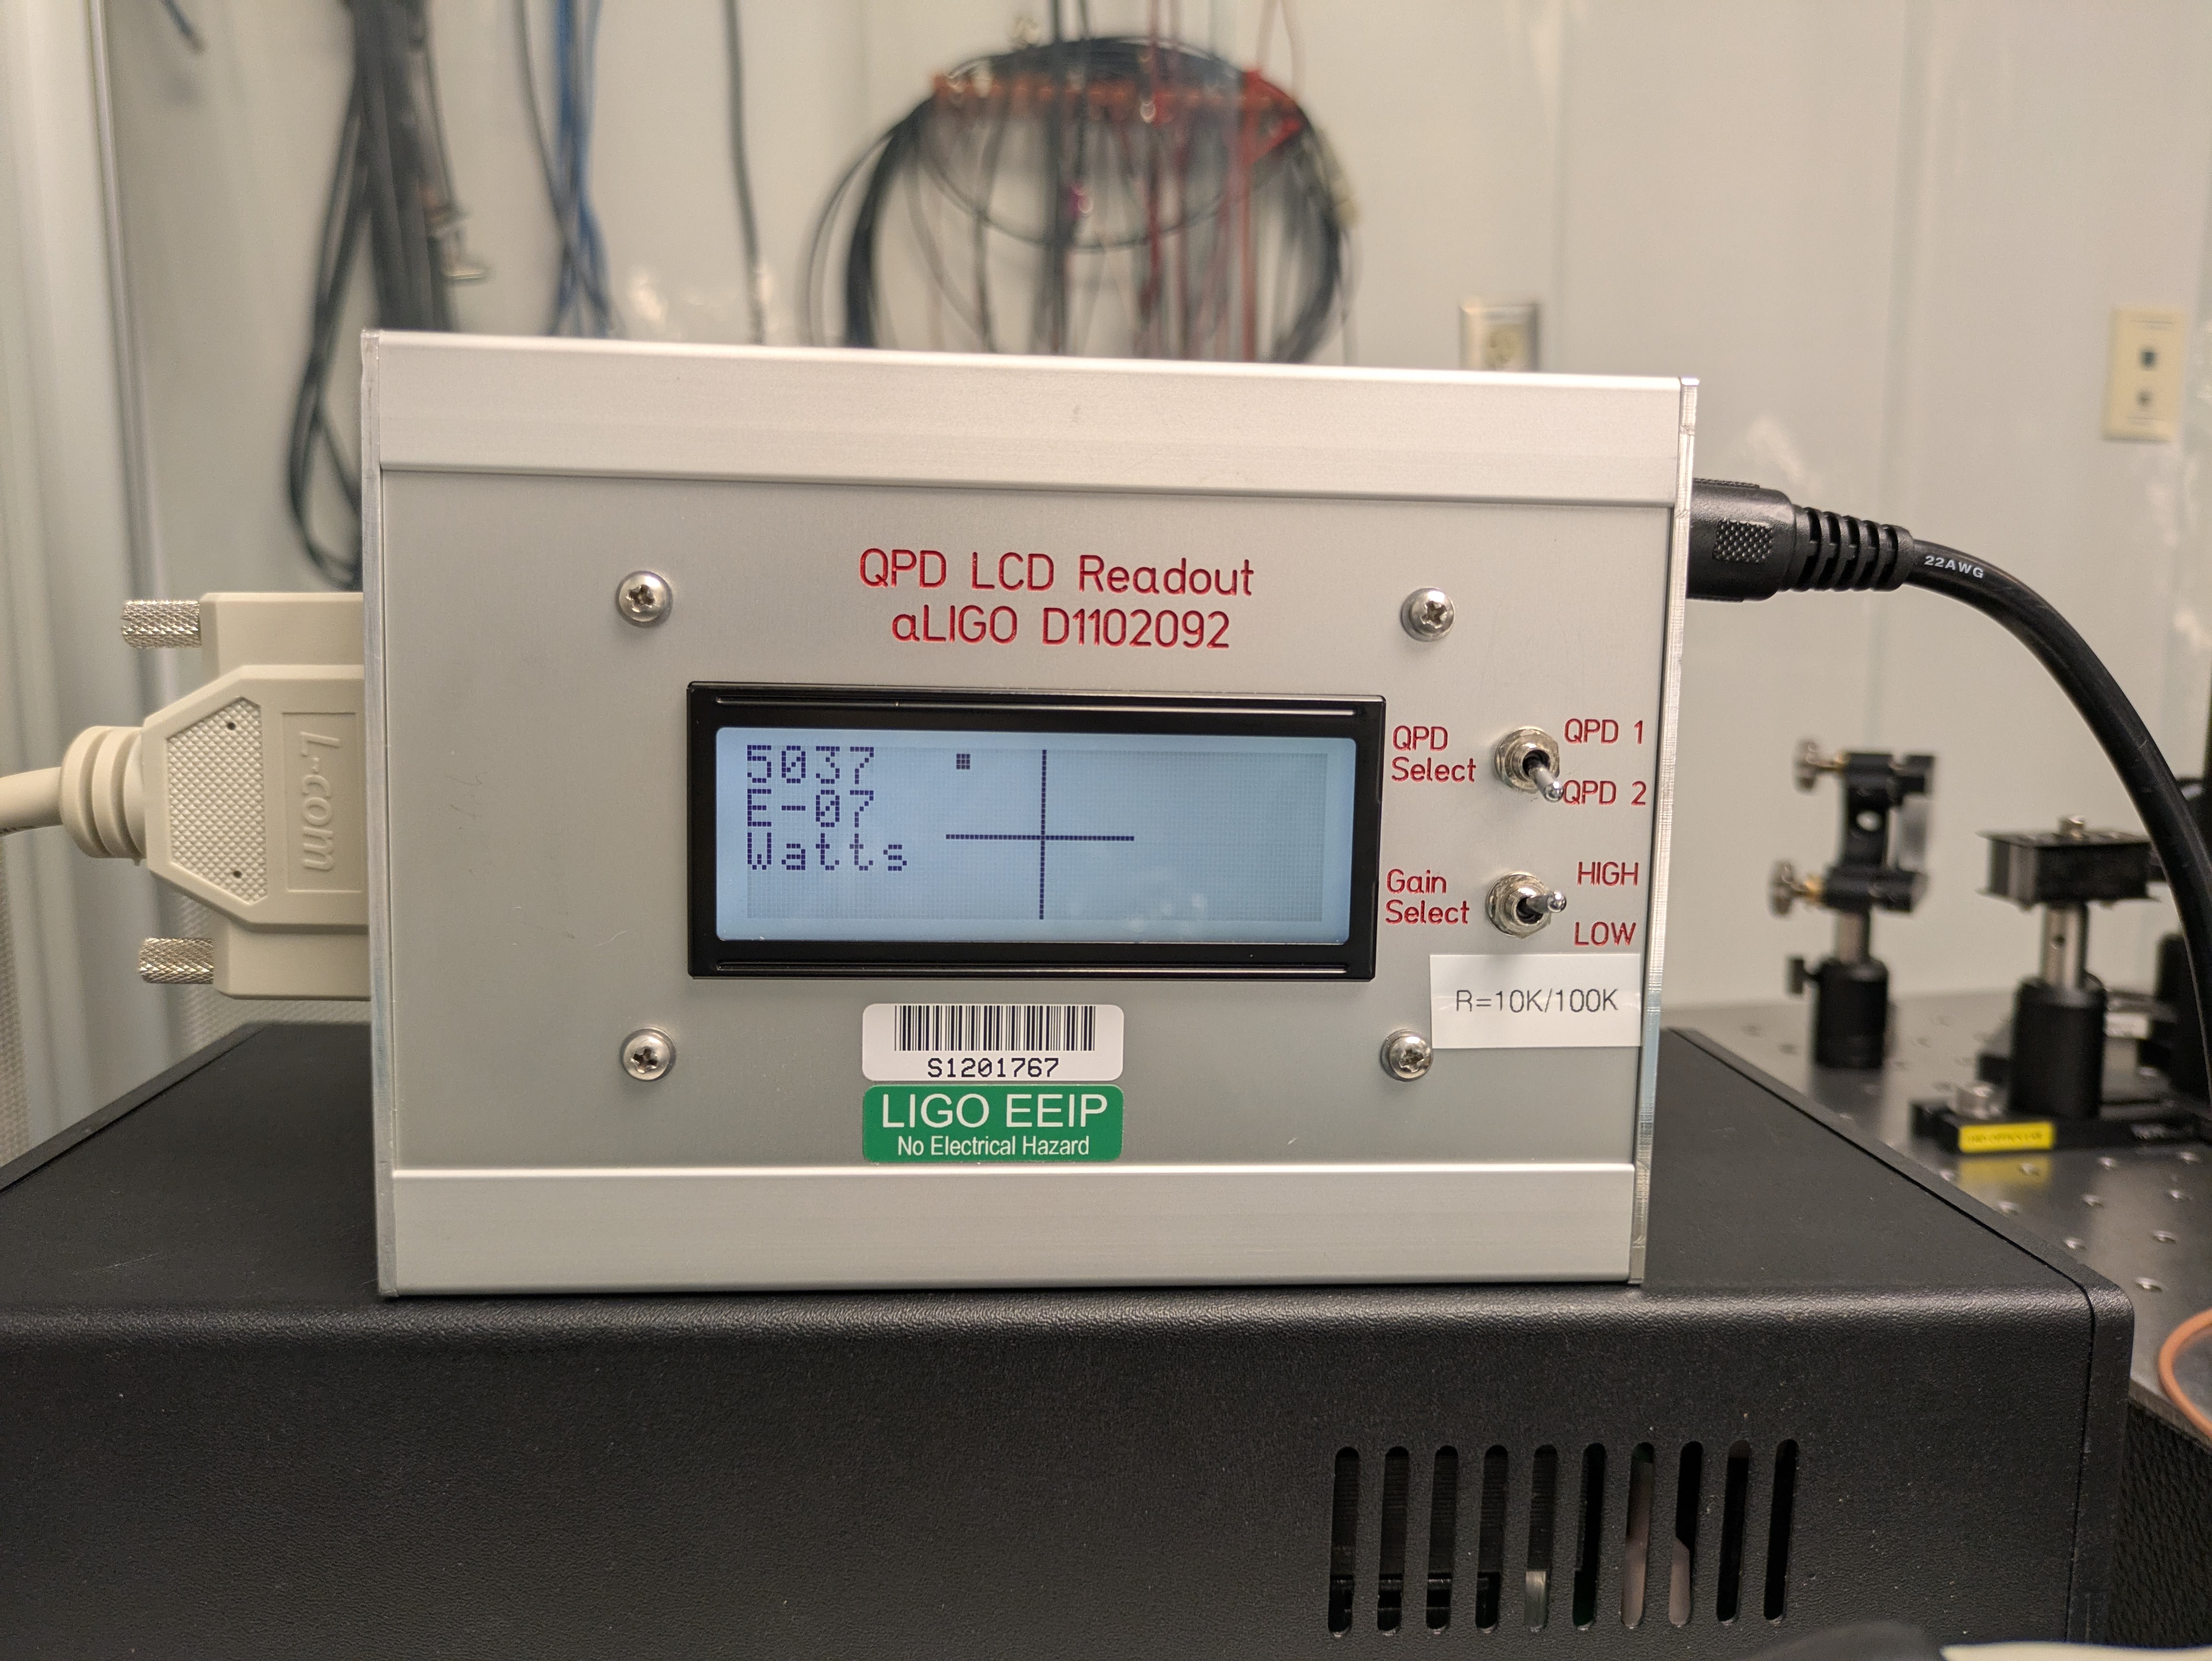
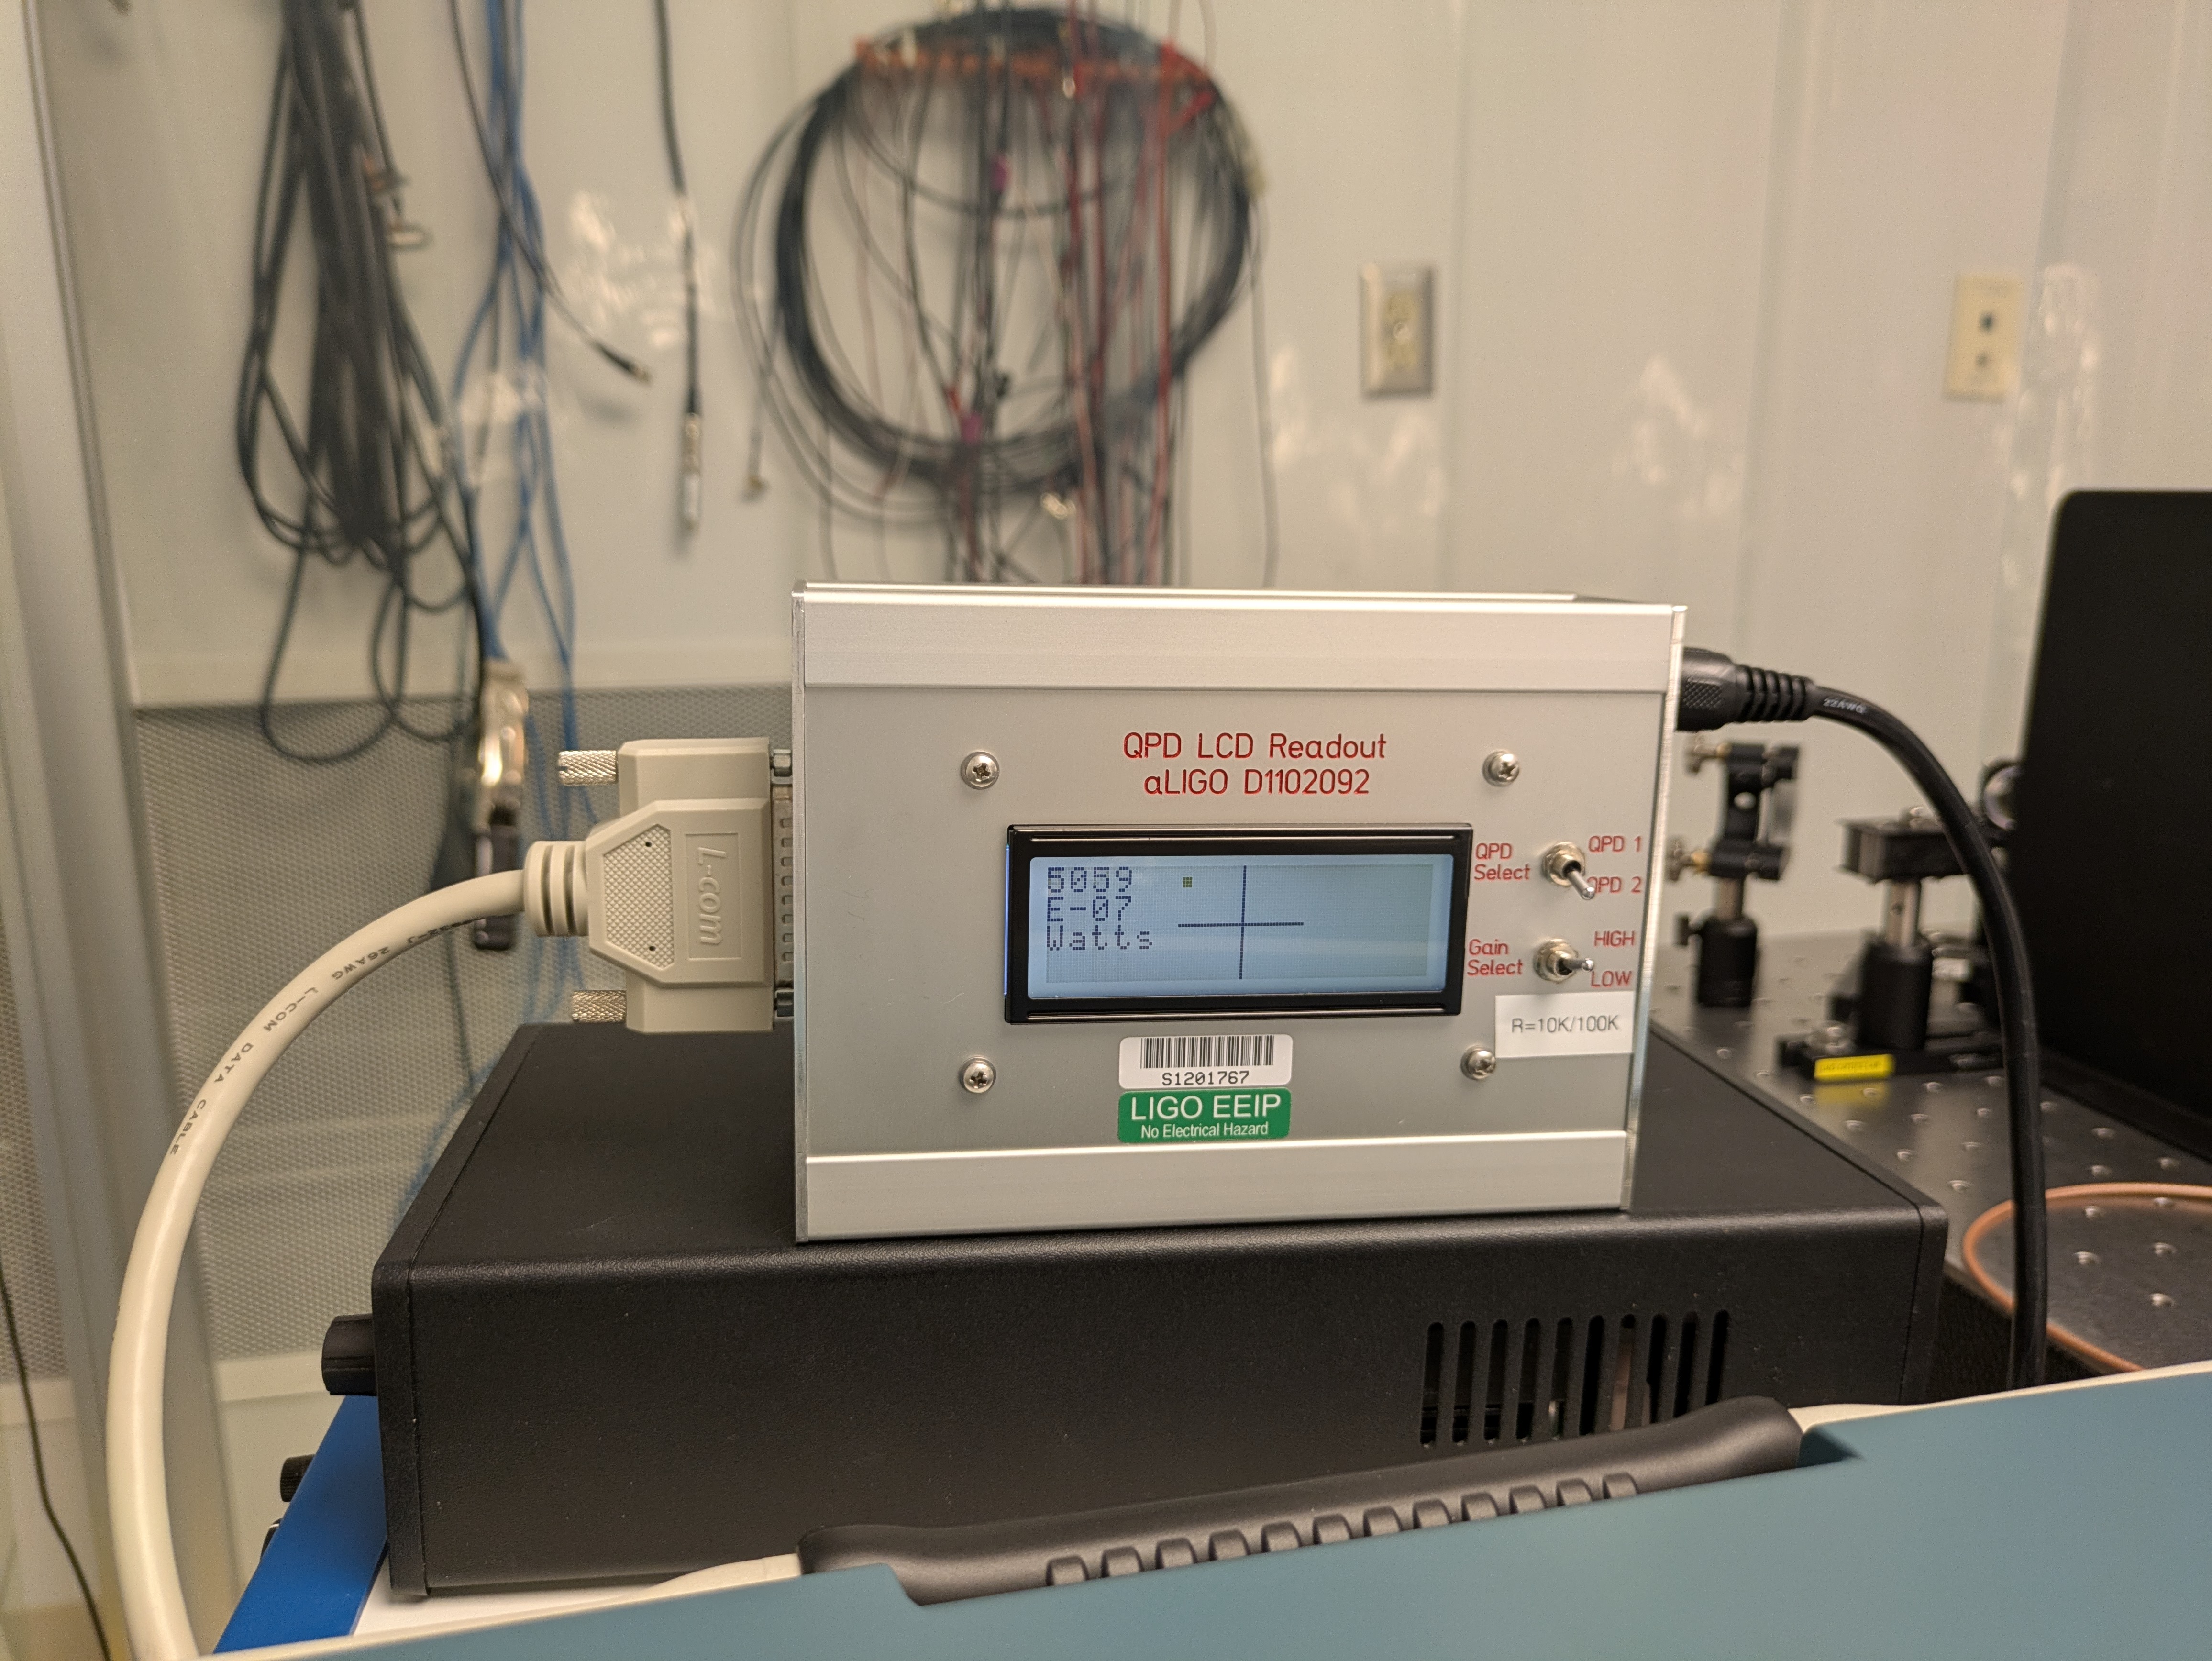
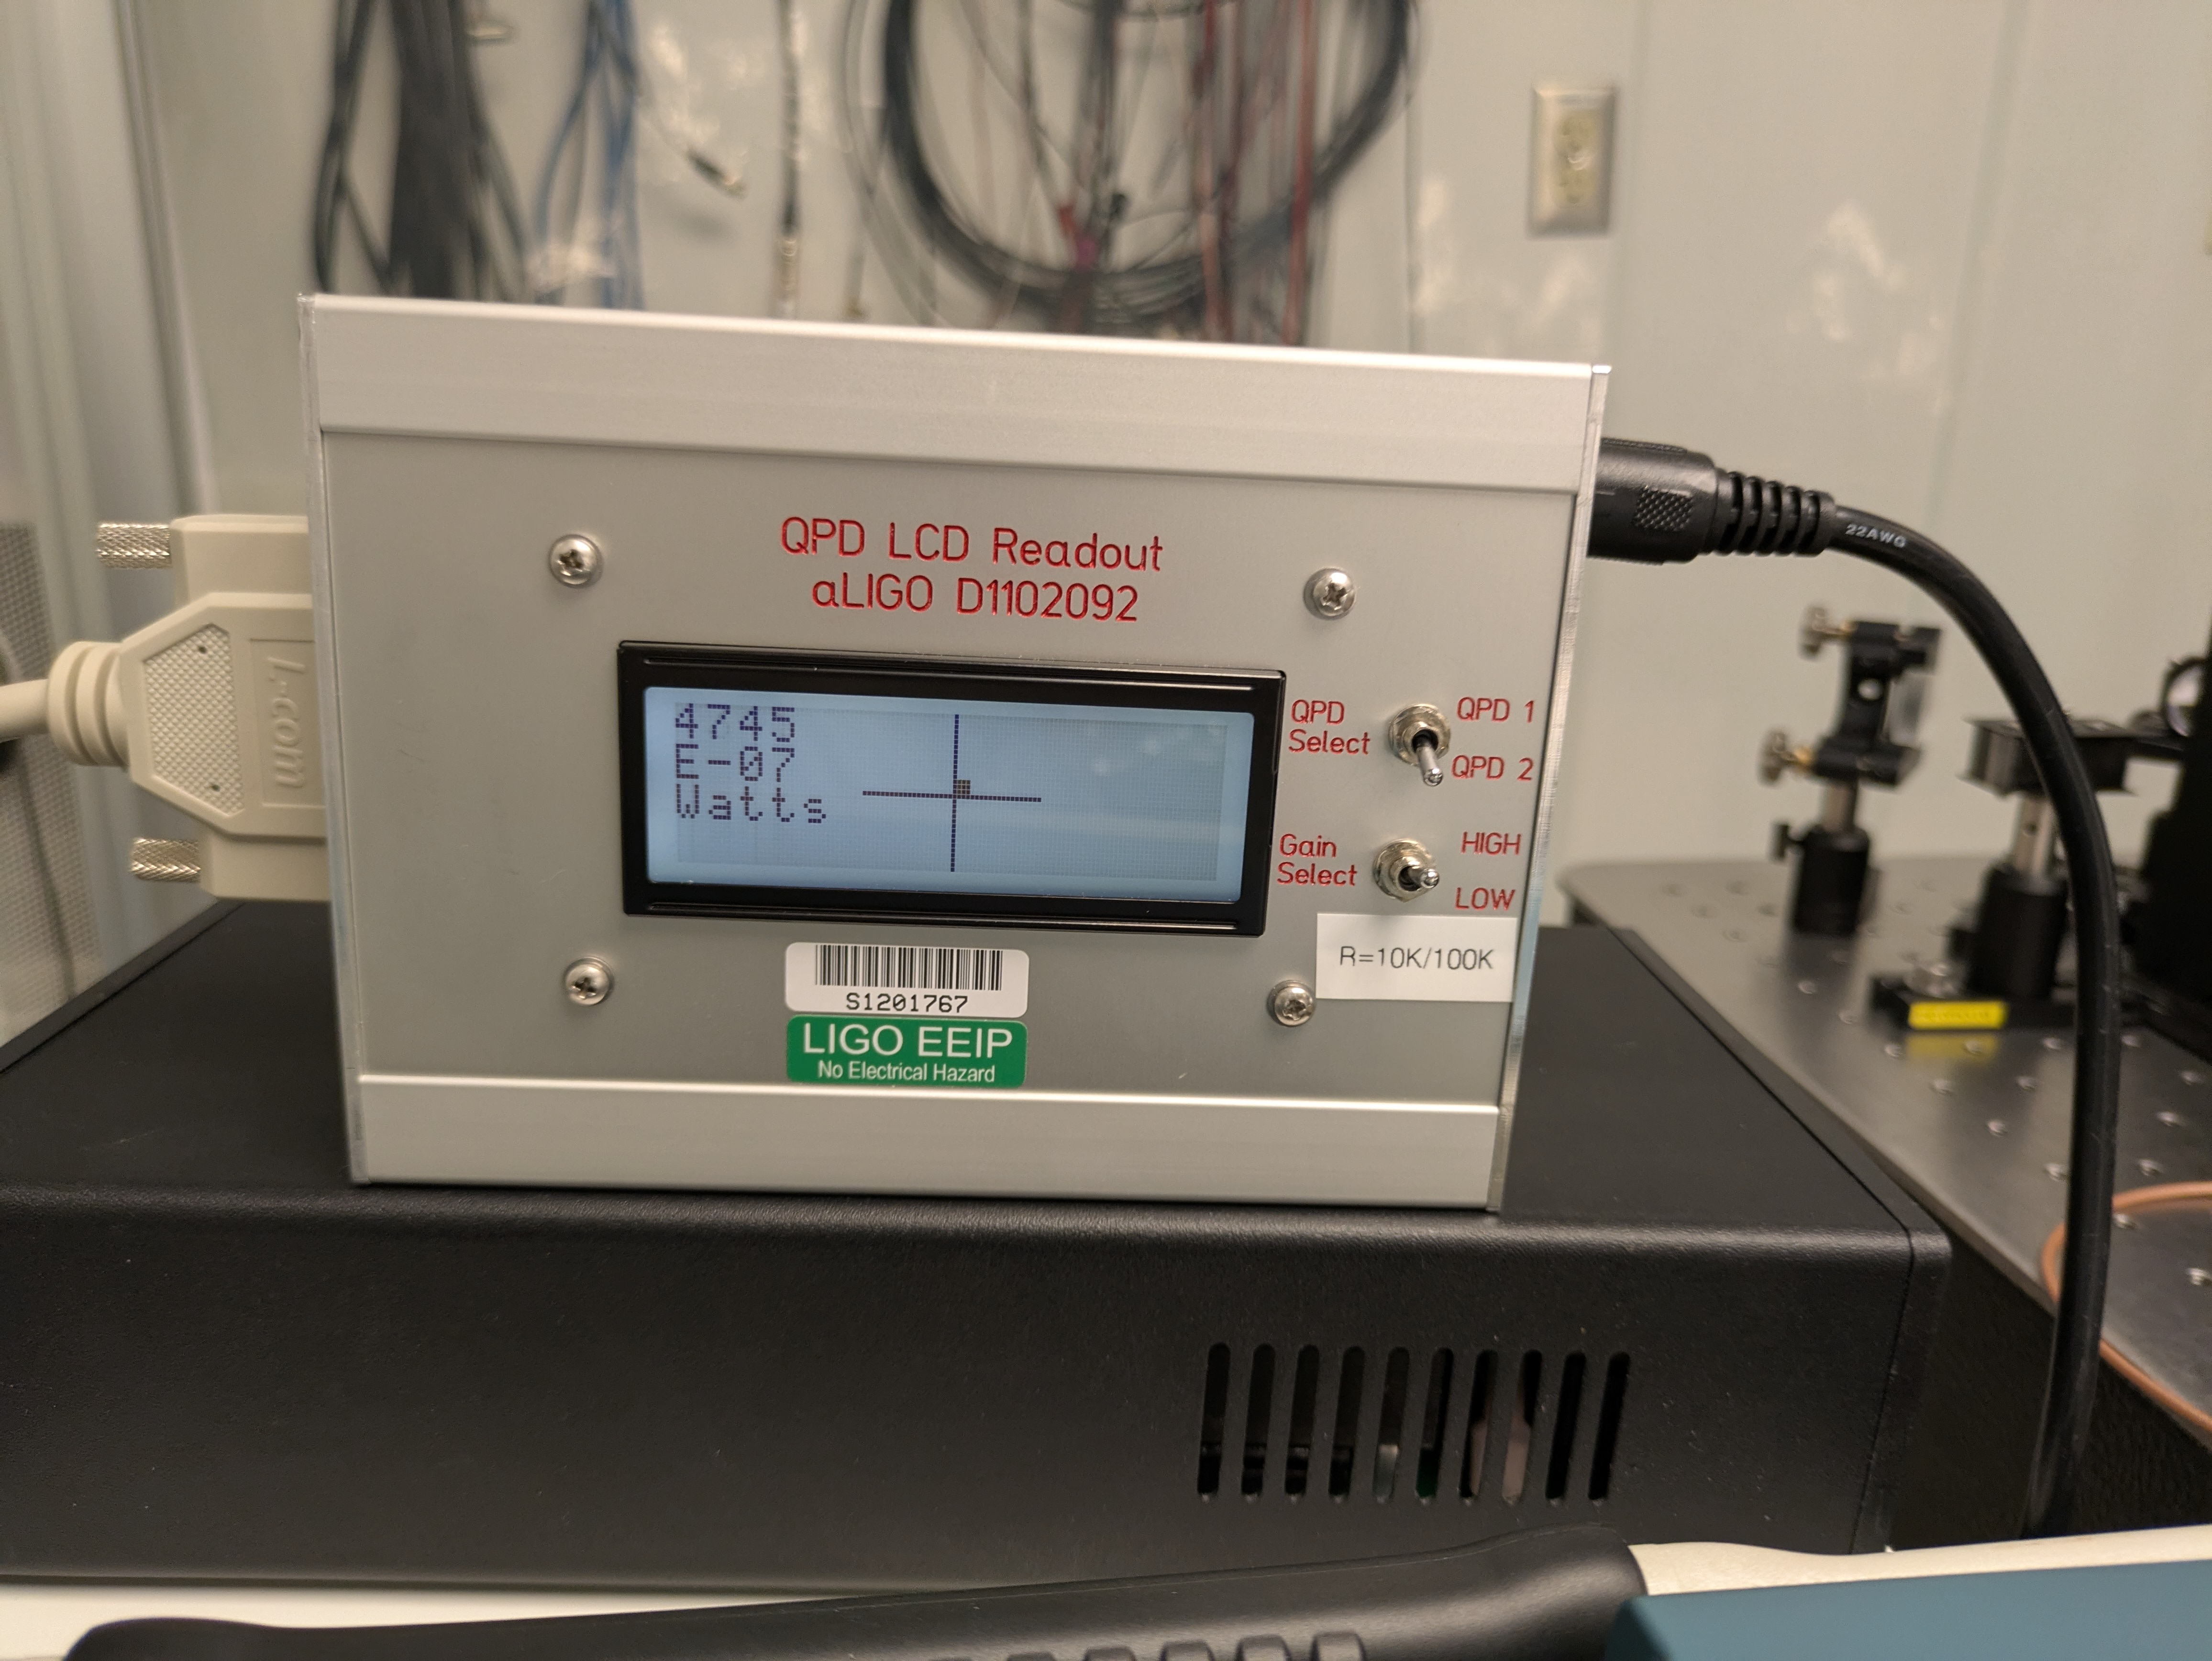
One problem emerging was that the QPD (shown in this image) readout doers not give a number for how far from centre the QPD is in our lab setup (it uses an old LCD output box with a microcontroller we can't find the documentation for). Another is that the four PDs are best aligned away from the centre of the QPD. So after testing it may be neccessary to move the QPD for best alignment.


This morning Siva and Mayank setup the readout for all 8 PDs and also added a polarising beamsplitter between the PZT controlled mirror used for dithering the alignment to the array, and the aperture on the array assembly input. This was to ensure the polarisation was not affecting the measurement.


Mayank and I measured the AC and DC signals for all 8 PDs using a horizontal dither on the PZT controlled mirror before the polarising beamsplitter, when:

1: the light was centered on the QPD and

2: when it was in the observed 'best alignment' when the coupling from the dither to the PDs was mininimised.

Changing the DC alignment is done with the pitch and yaw screws on the PZT mirror mount.

After the first couple of measurements we tried to get a time when the laser was not in a noisy state this could be because it keeps running multi-mode or some pickup in the measurement cables - not sure so further investigation needed.

It does seem possible to obtain a spot where all the 8 PDs are minimised in the top left-hand quadrant of the QPD for.

We also repeated measurements 1 and 2 with a vertical dither on the PZT. This is the LCD screen when aligned at its best alignment on the PDs for vertical dither on the PZT mirror. This is the readout for PDs 1-4 and 5-8 at this position. This is the LCD screen when the input alignment is such that the QPD is centred.

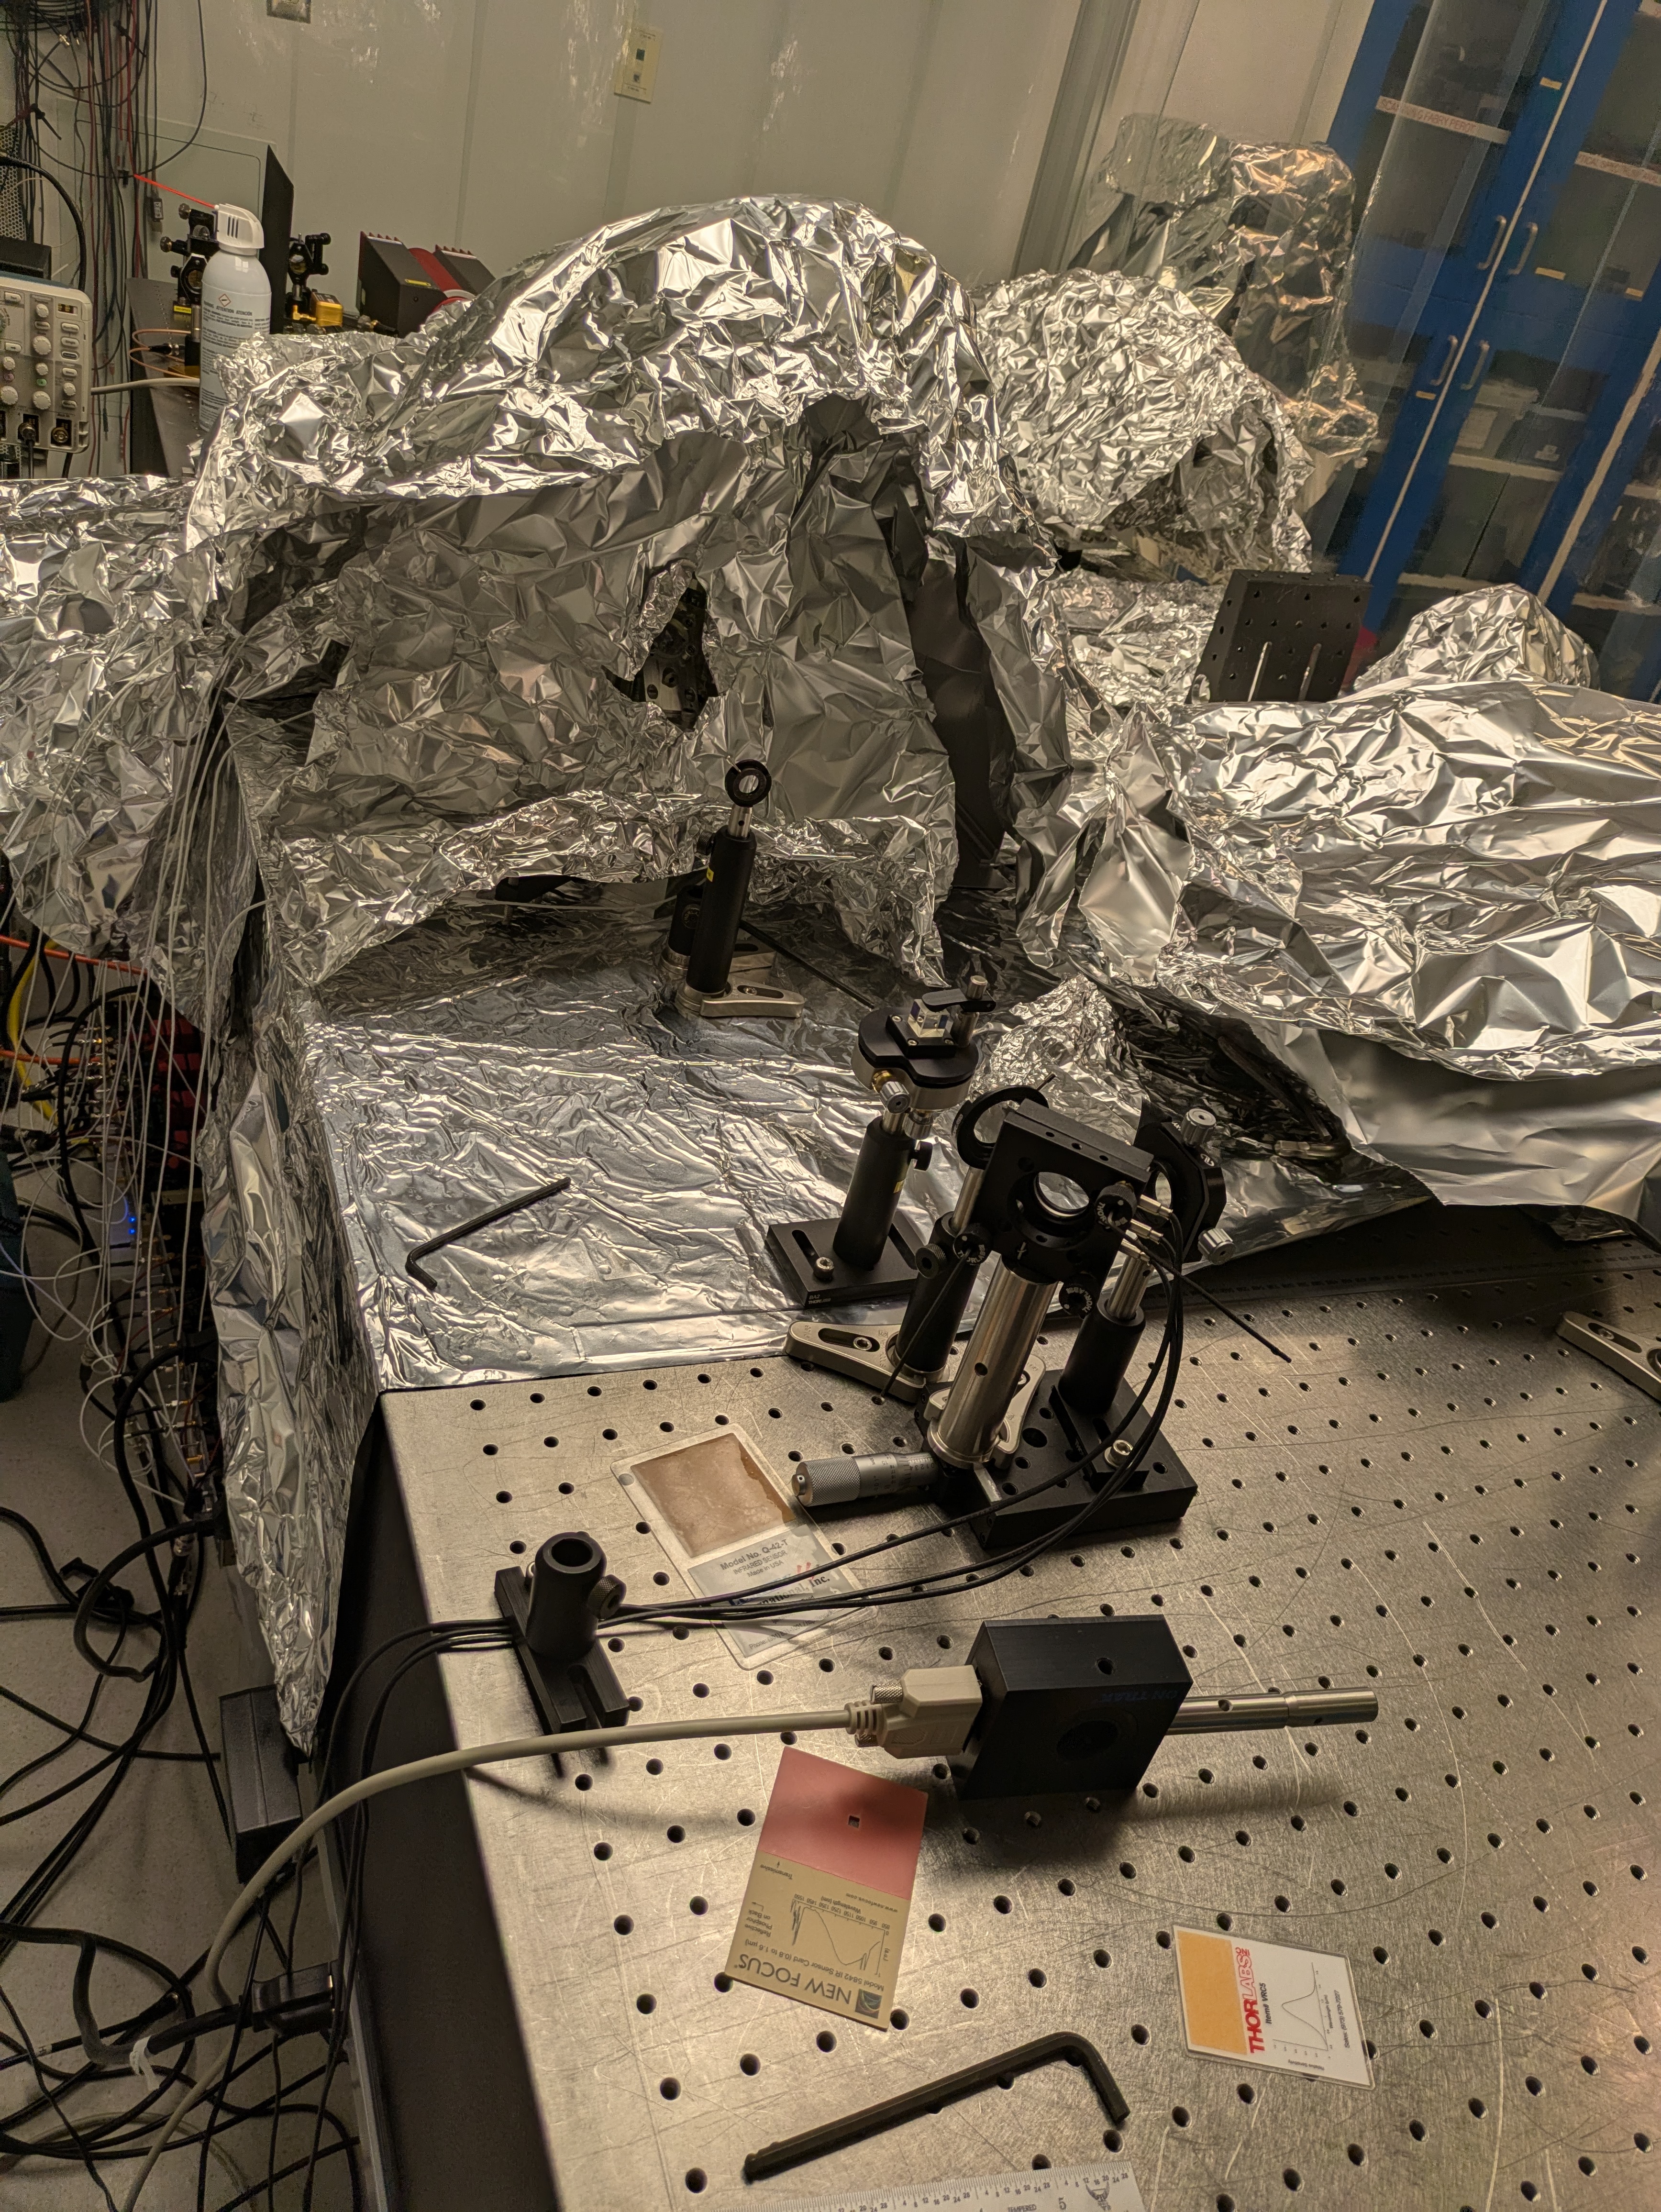
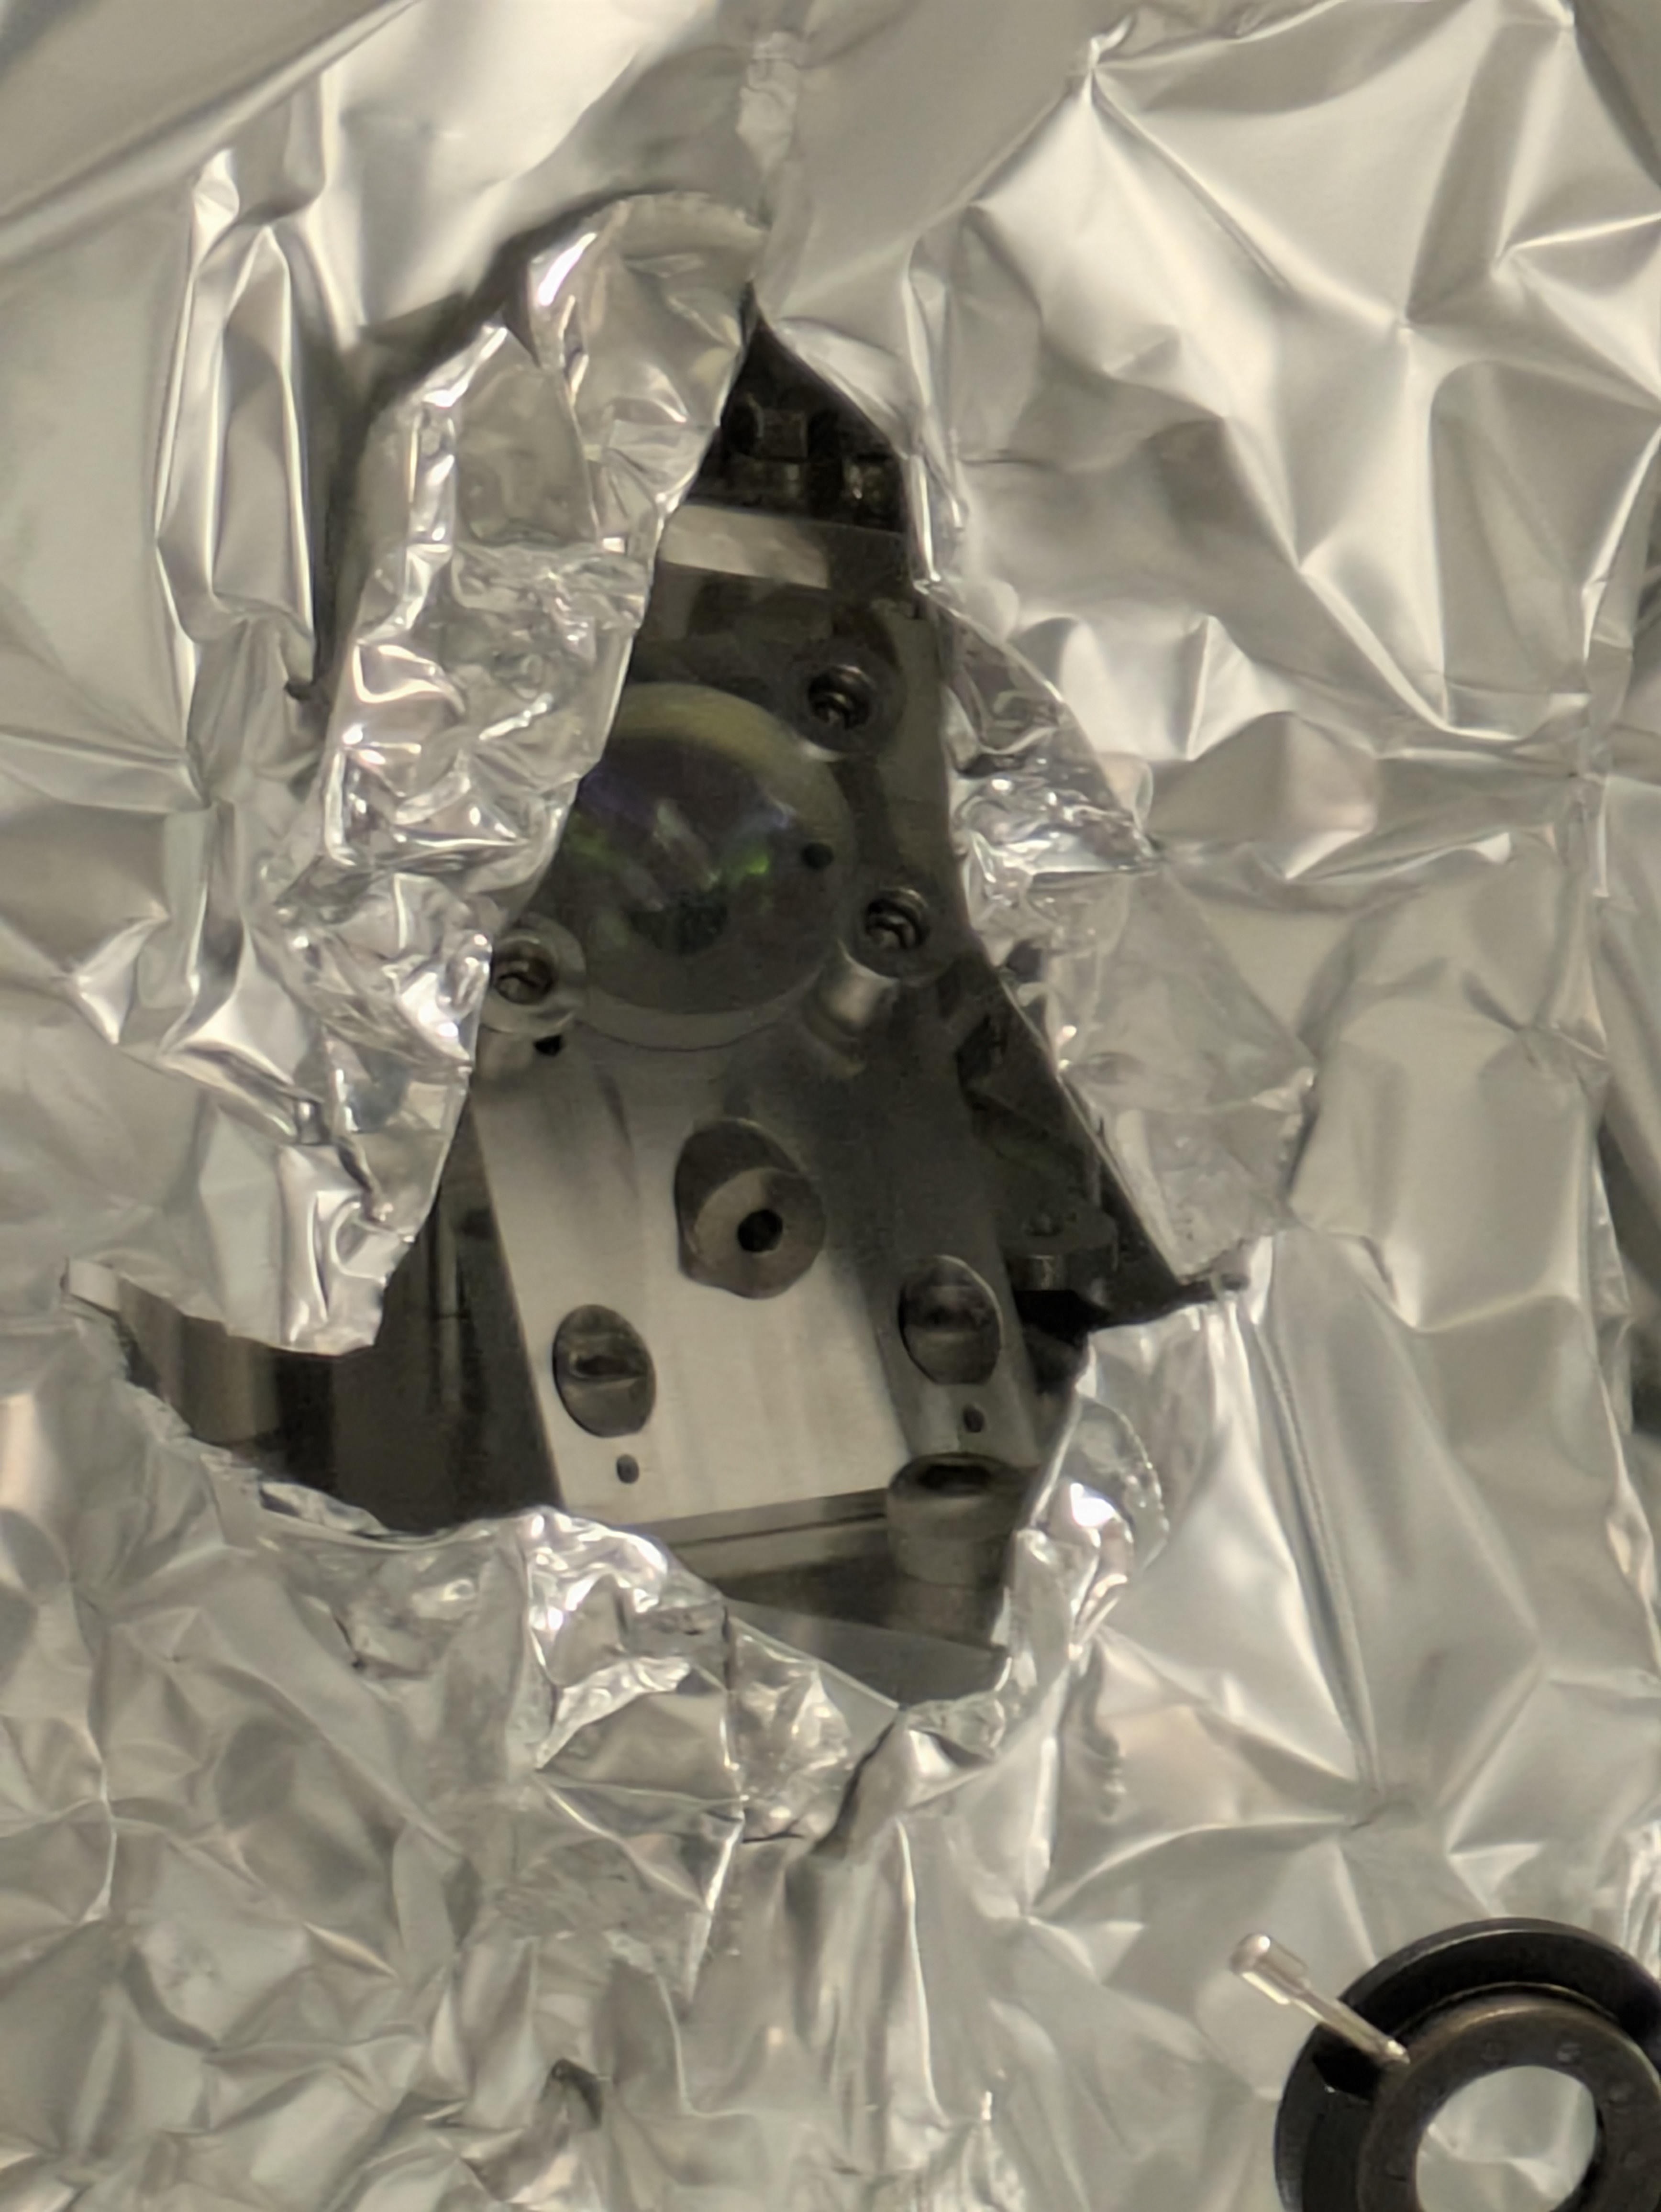
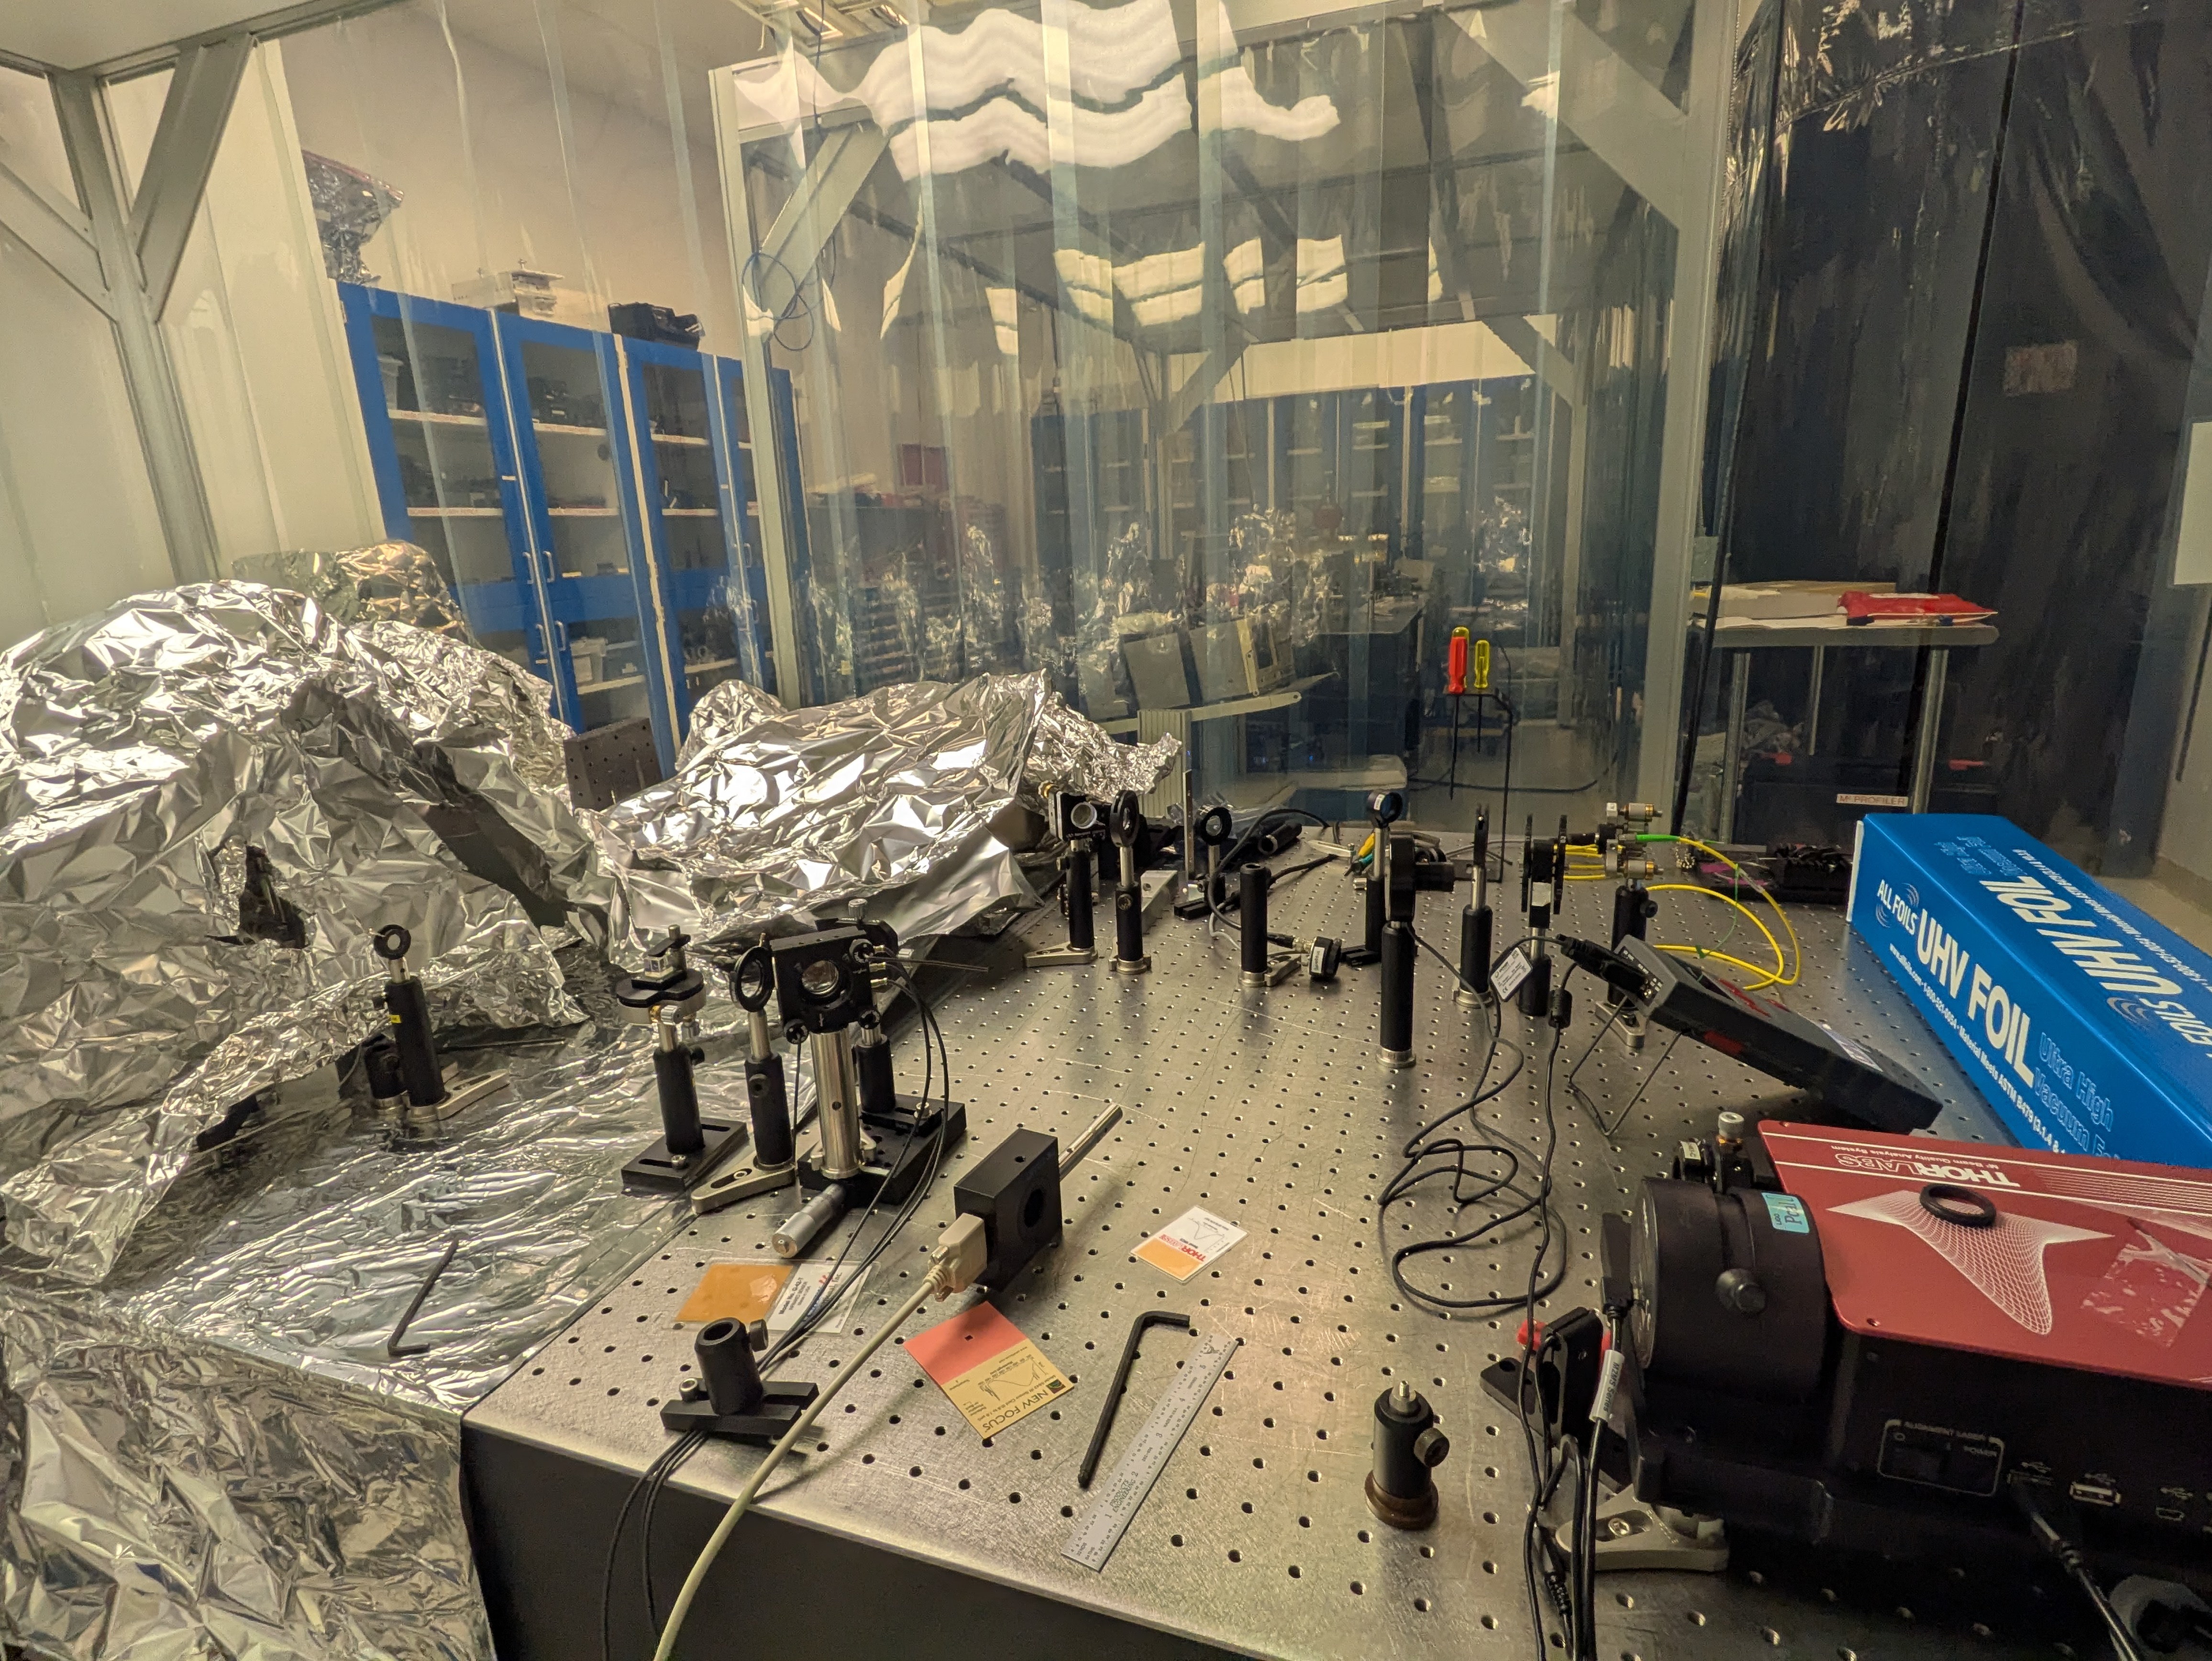
I have attached our data file references for the measurements and some photos.

Keita also tuned the laser temperature control thermistor from a resistance of 10 kOhms to 9.602 kOhms which seems to stop the laser mode-hopping and becoming noisy. Siva has also hooked up a cable between the QPD and a different QPD readout box which we can get oscilloscope readouts from. More measurements to follow...

Images attached to this report
Non-image files attached to this report
LHO FMCS (PEM)
corey.gray@LIGO.ORG - posted 17:32, Friday 21 March 2025 (83496)
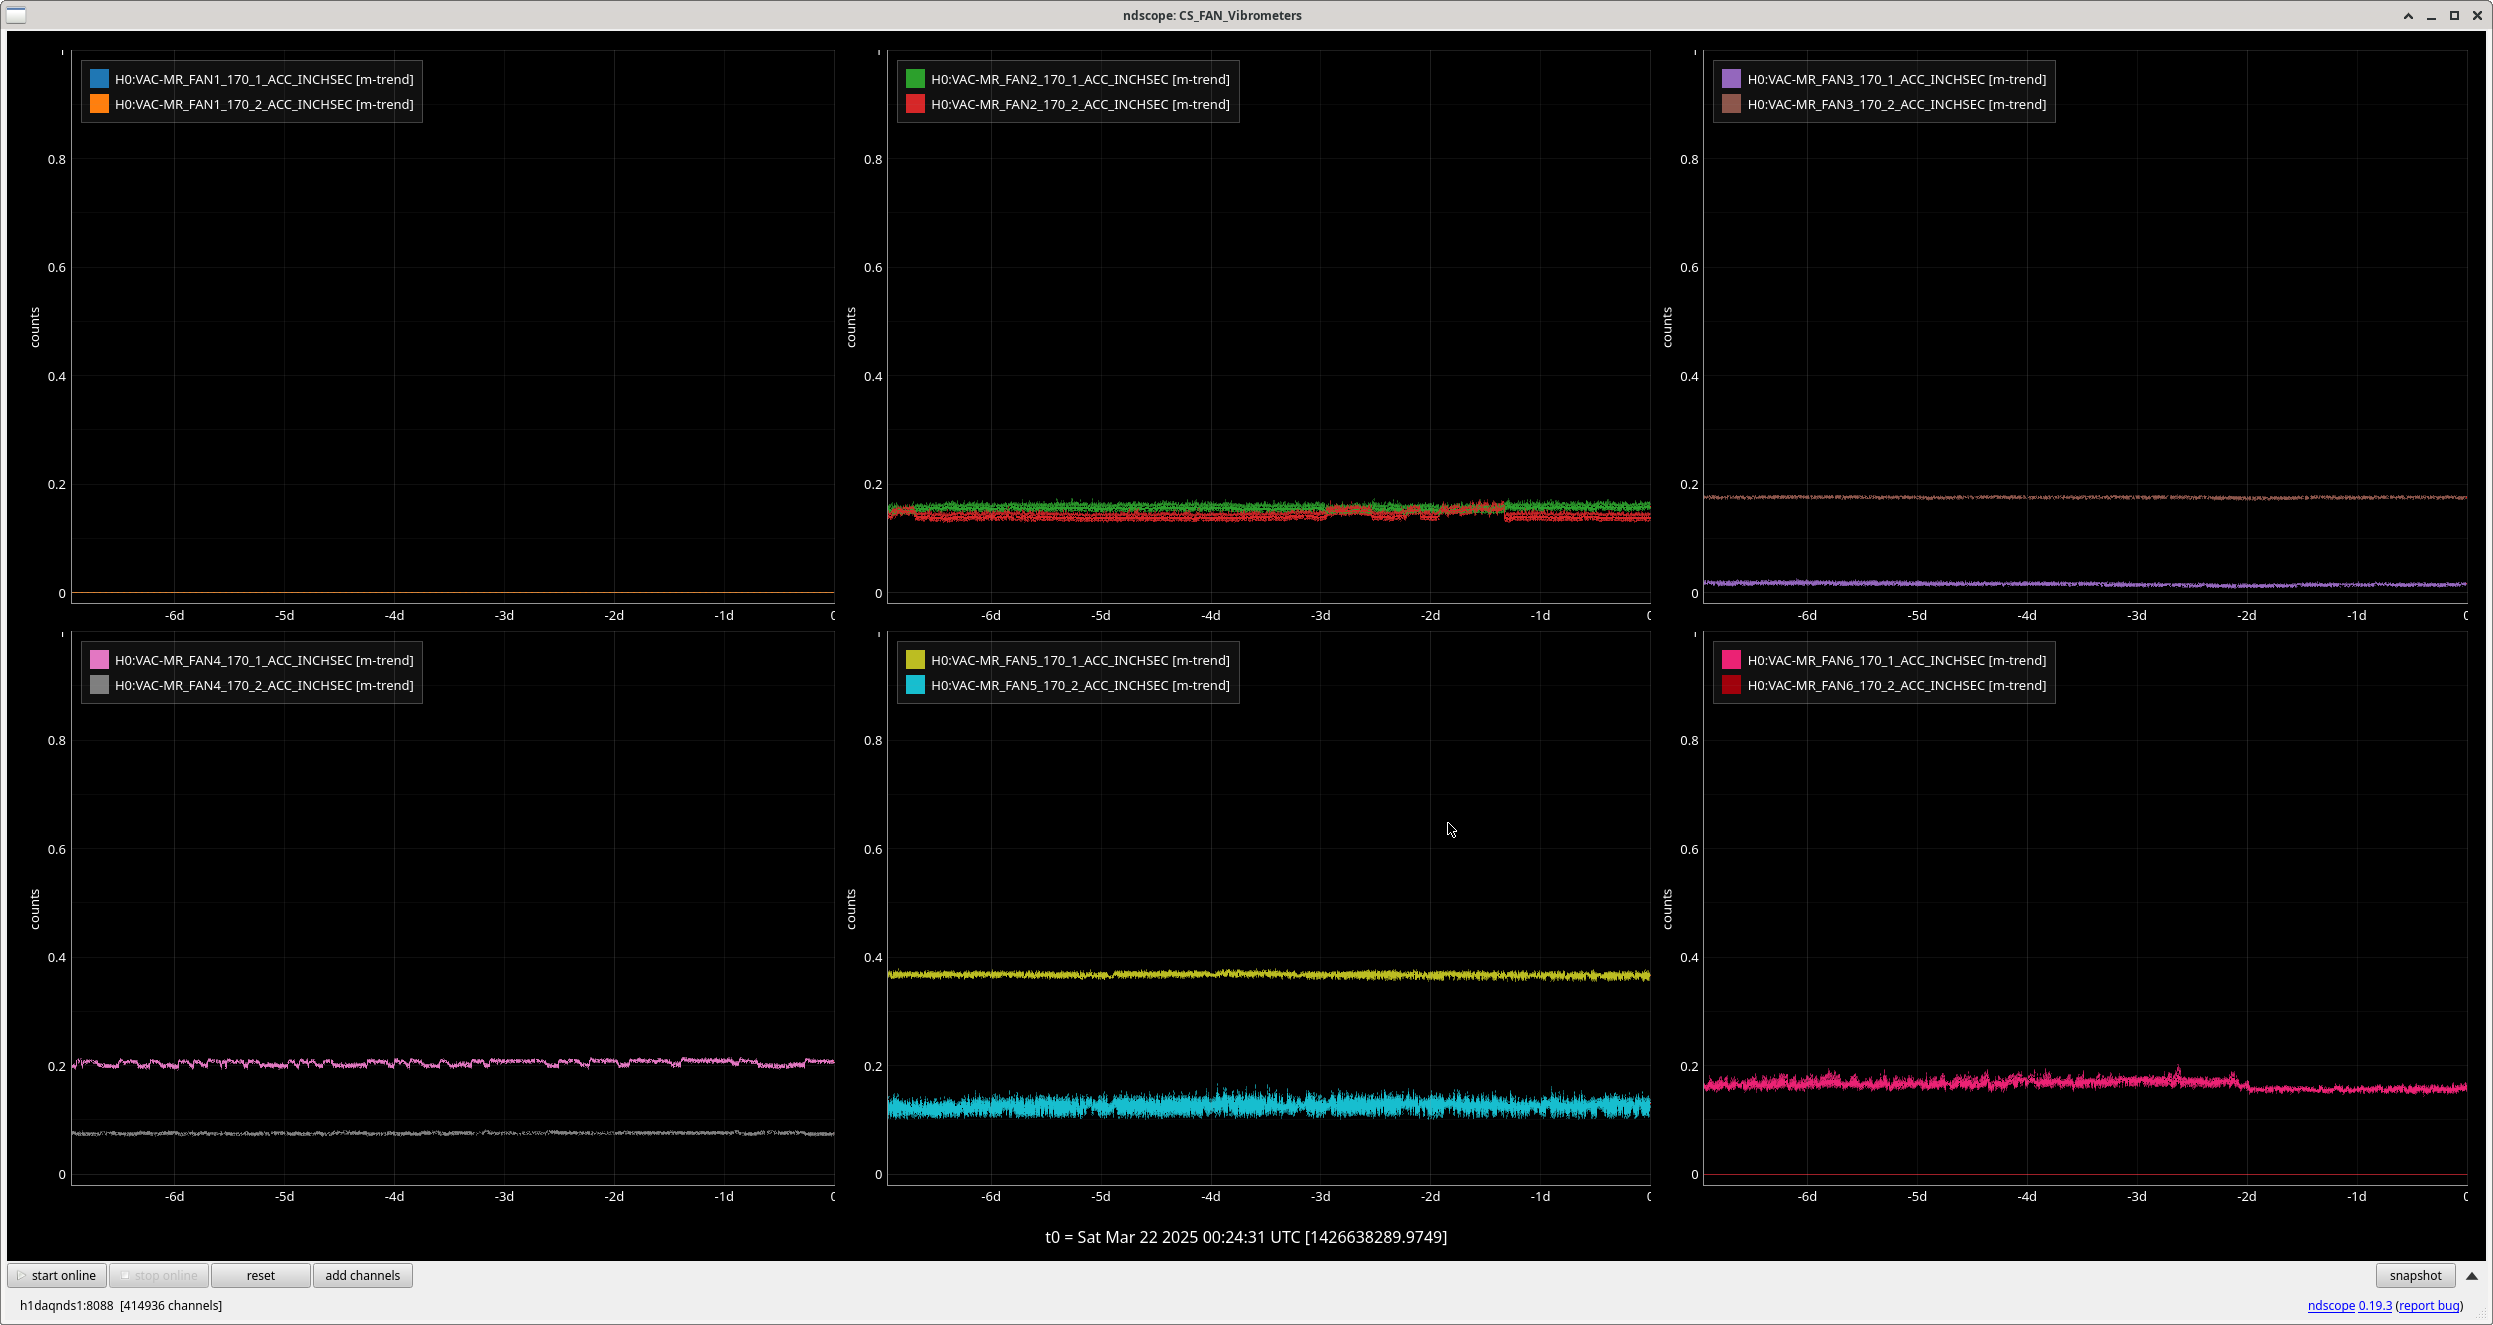
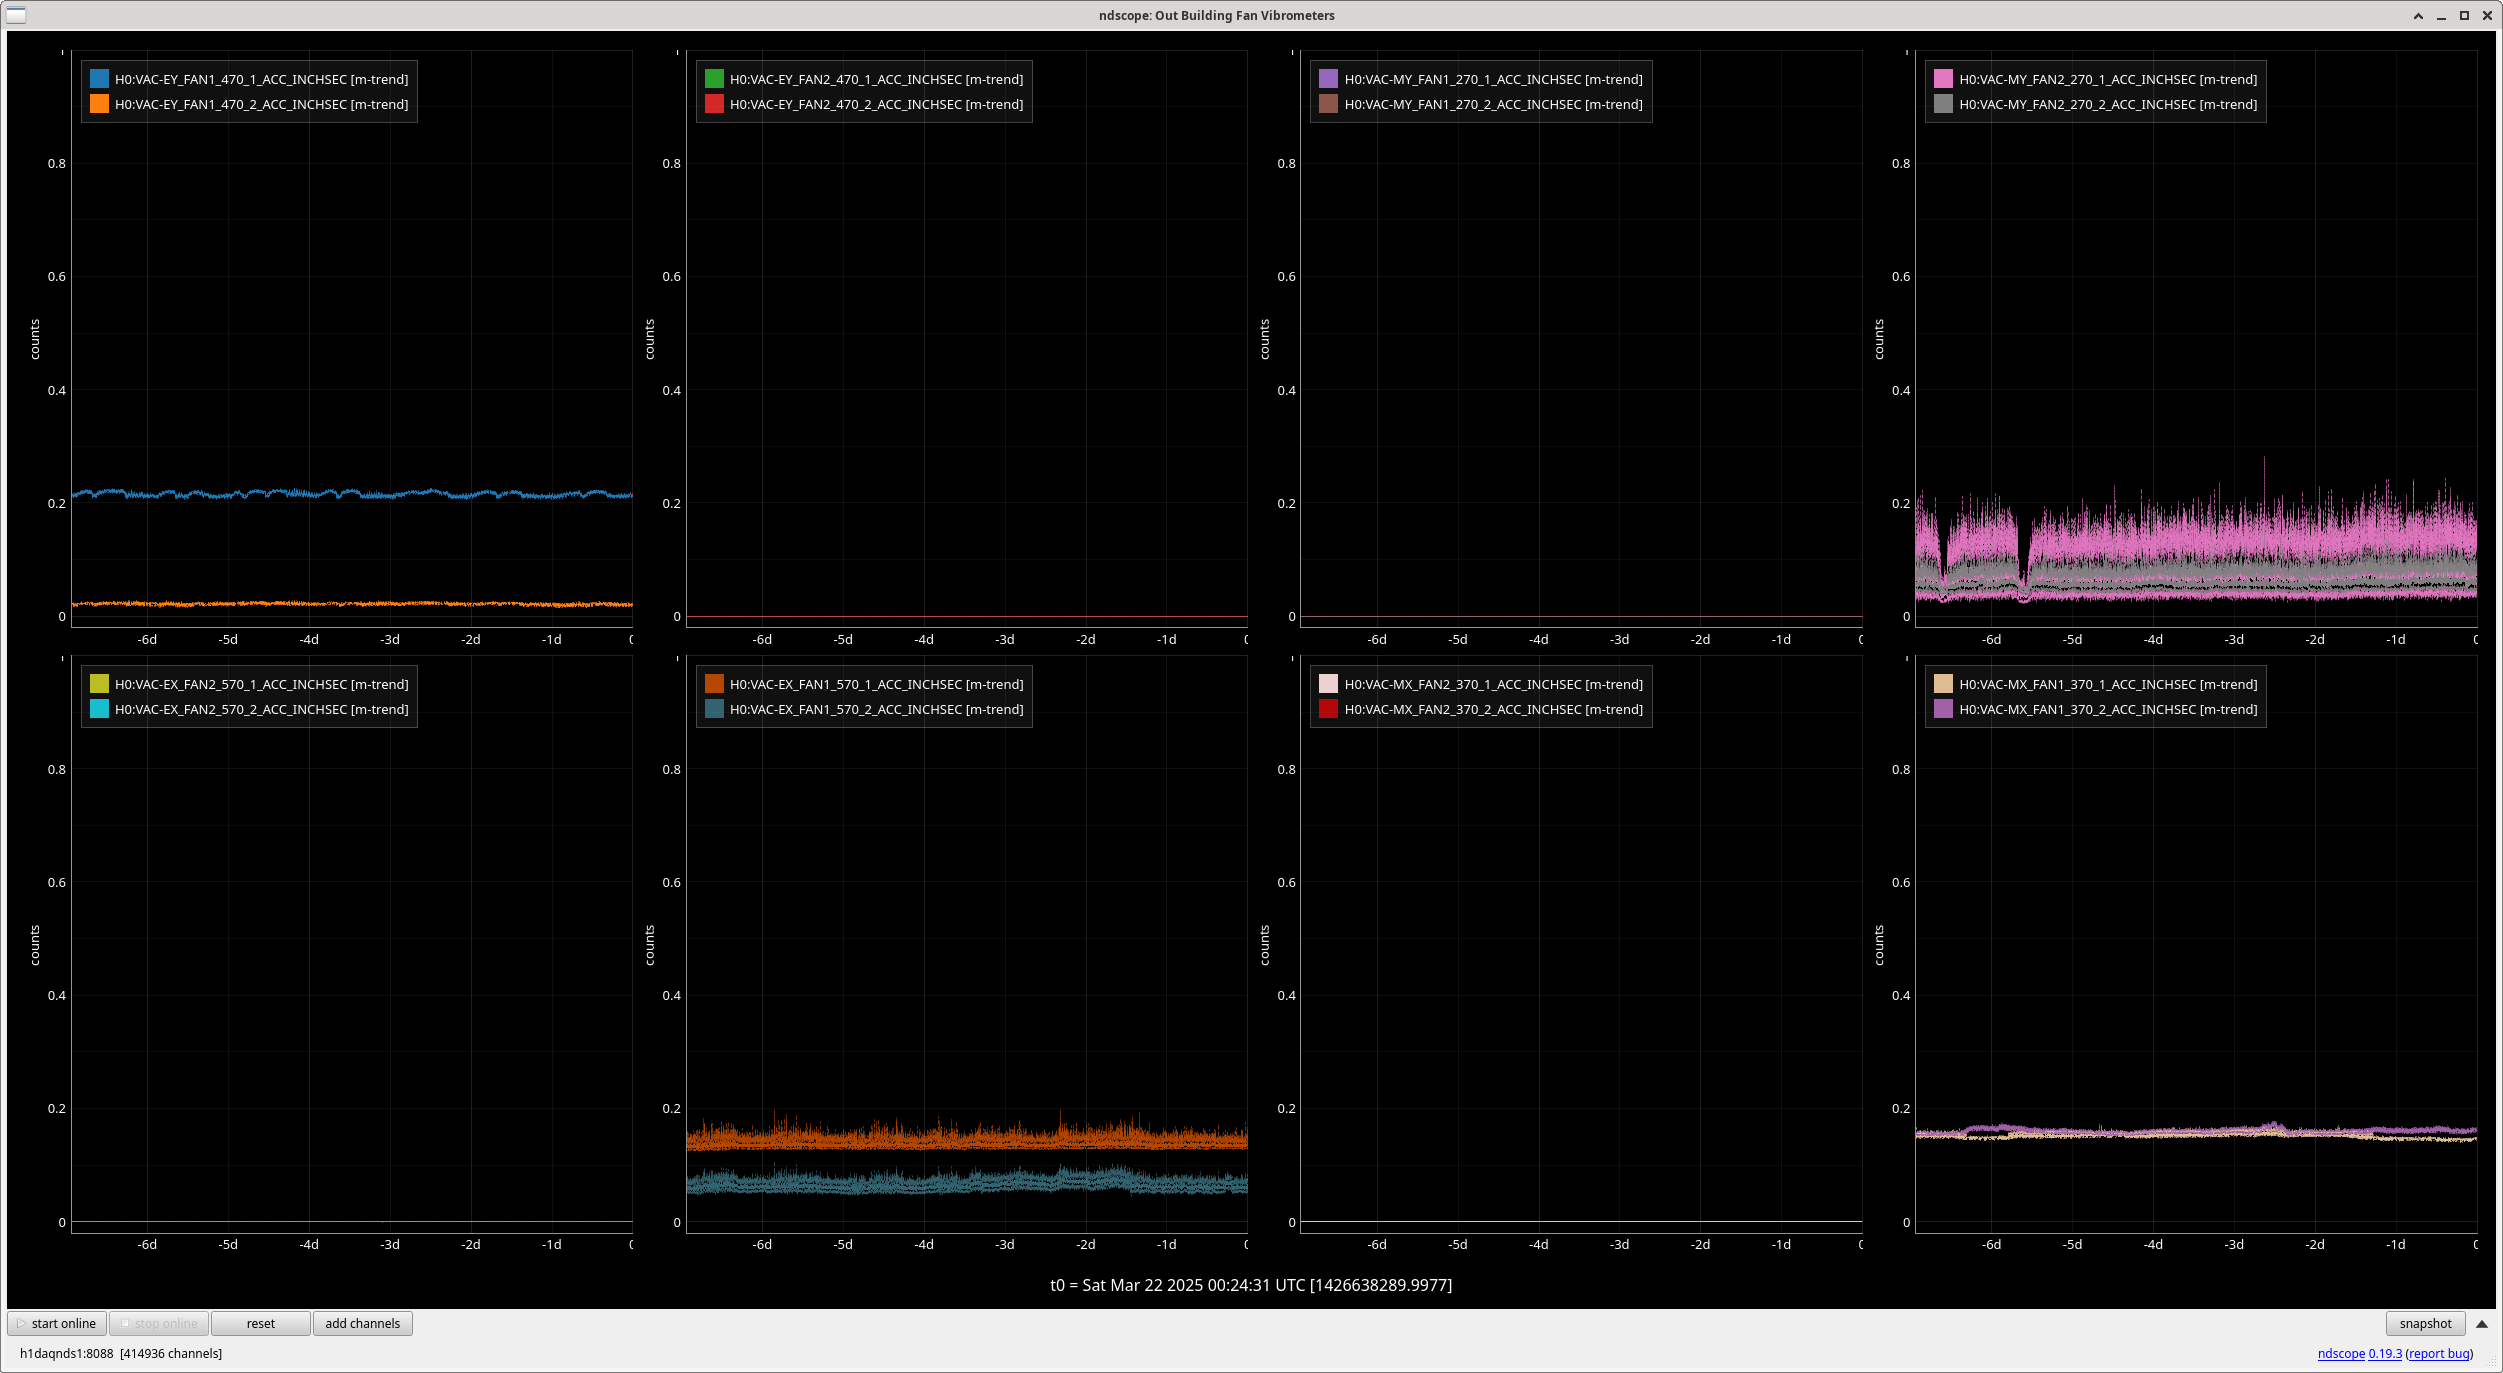
HVAC Fan Vibrometers FAMIS Check (FAMIS 26368)

For FAMIS #26368:  All looks well for the last week for all site HVAC fans (see attached trends).

Images attached to this report
LHO General
ryan.short@LIGO.ORG - posted 16:30, Friday 21 March 2025 (83493)
Ops Day Shift Summary

TITLE: 03/21 Day Shift: 1430-2330 UTC (0730-1630 PST), all times posted in UTC
STATE of H1: Observing at 146Mpc
INCOMING OPERATOR: Corey
SHIFT SUMMARY: Several hours of downtime today thanks to some earthquakes this morning and high winds this afternoon. Eventually we were able to relock, and so far H1 has been observing for about 1.5 hours. Quiet day otherwise.
LOG:

LHO General
corey.gray@LIGO.ORG - posted 16:20, Friday 21 March 2025 (83494)
Fri Ops Eve Transition

TITLE: 03/21 Eve Shift: 2330-0500 UTC (1630-2200 PST), all times posted in UTC
STATE of H1: Observing at 149Mpc
OUTGOING OPERATOR: Ryan S
CURRENT ENVIRONMENT:
    SEI_ENV state: CALM
    Wind: 12mph Gusts, 7mph 3min avg
    Primary useism: 0.03 μm/s
    Secondary useism: 0.33 μm/s
QUICK SUMMARY:

H1's been Observing for 90min and so far the environment looks decent for evening operations (winds mostly under 10mph); it's been raining the last few hours.  Ryan passed on how locking went for him and there is an opportunistic Observing-Drop for Robert---if L1 is out of Observing.

H1 General
ryan.short@LIGO.ORG - posted 14:55, Friday 21 March 2025 (83490)
H1 Back to Observing

H1 returned to observing at 21:53 UTC after several hours of downtime due to earthquakes and high winds. The wind has calmed down enough that I was able to relock after an initial alignment.

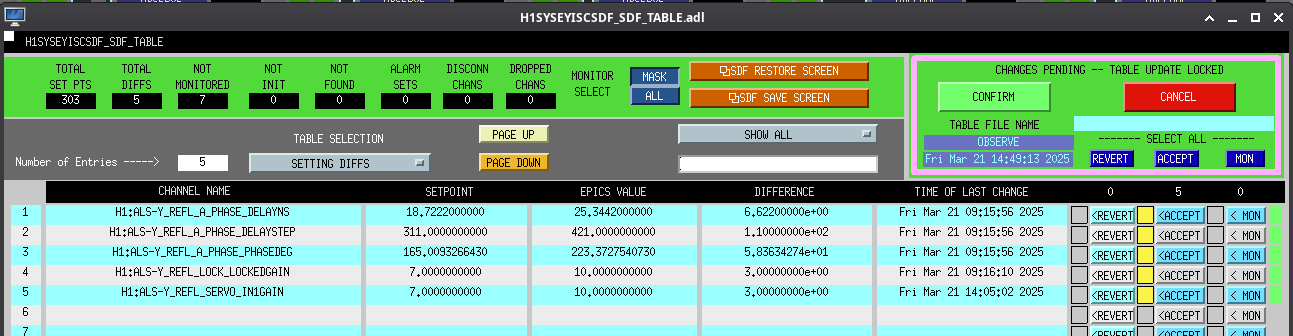
I accepted the SDF diffs Sheila predicted in alog83483 before going to observing, screenshot attached.

Images attached to this report
H1 SUS (SEI)
brian.lantz@LIGO.ORG - posted 16:23, Wednesday 05 March 2025 - last comment - 12:03, Monday 31 March 2025(83200)
cross-coupling and reciprocal plants

I'm looking again at the OSEM estimator we want to try on PR3 - see https://dcc.ligo.org/LIGO-G2402303 for description of that idea.

We want to make a yaw estimator, because that should be the easiest one for which we have a hope of seeing some difference (vertical is probably easier, but you can't measure it). One thing which makes this hard is that the cross coupling from L drive to Y readout is large.

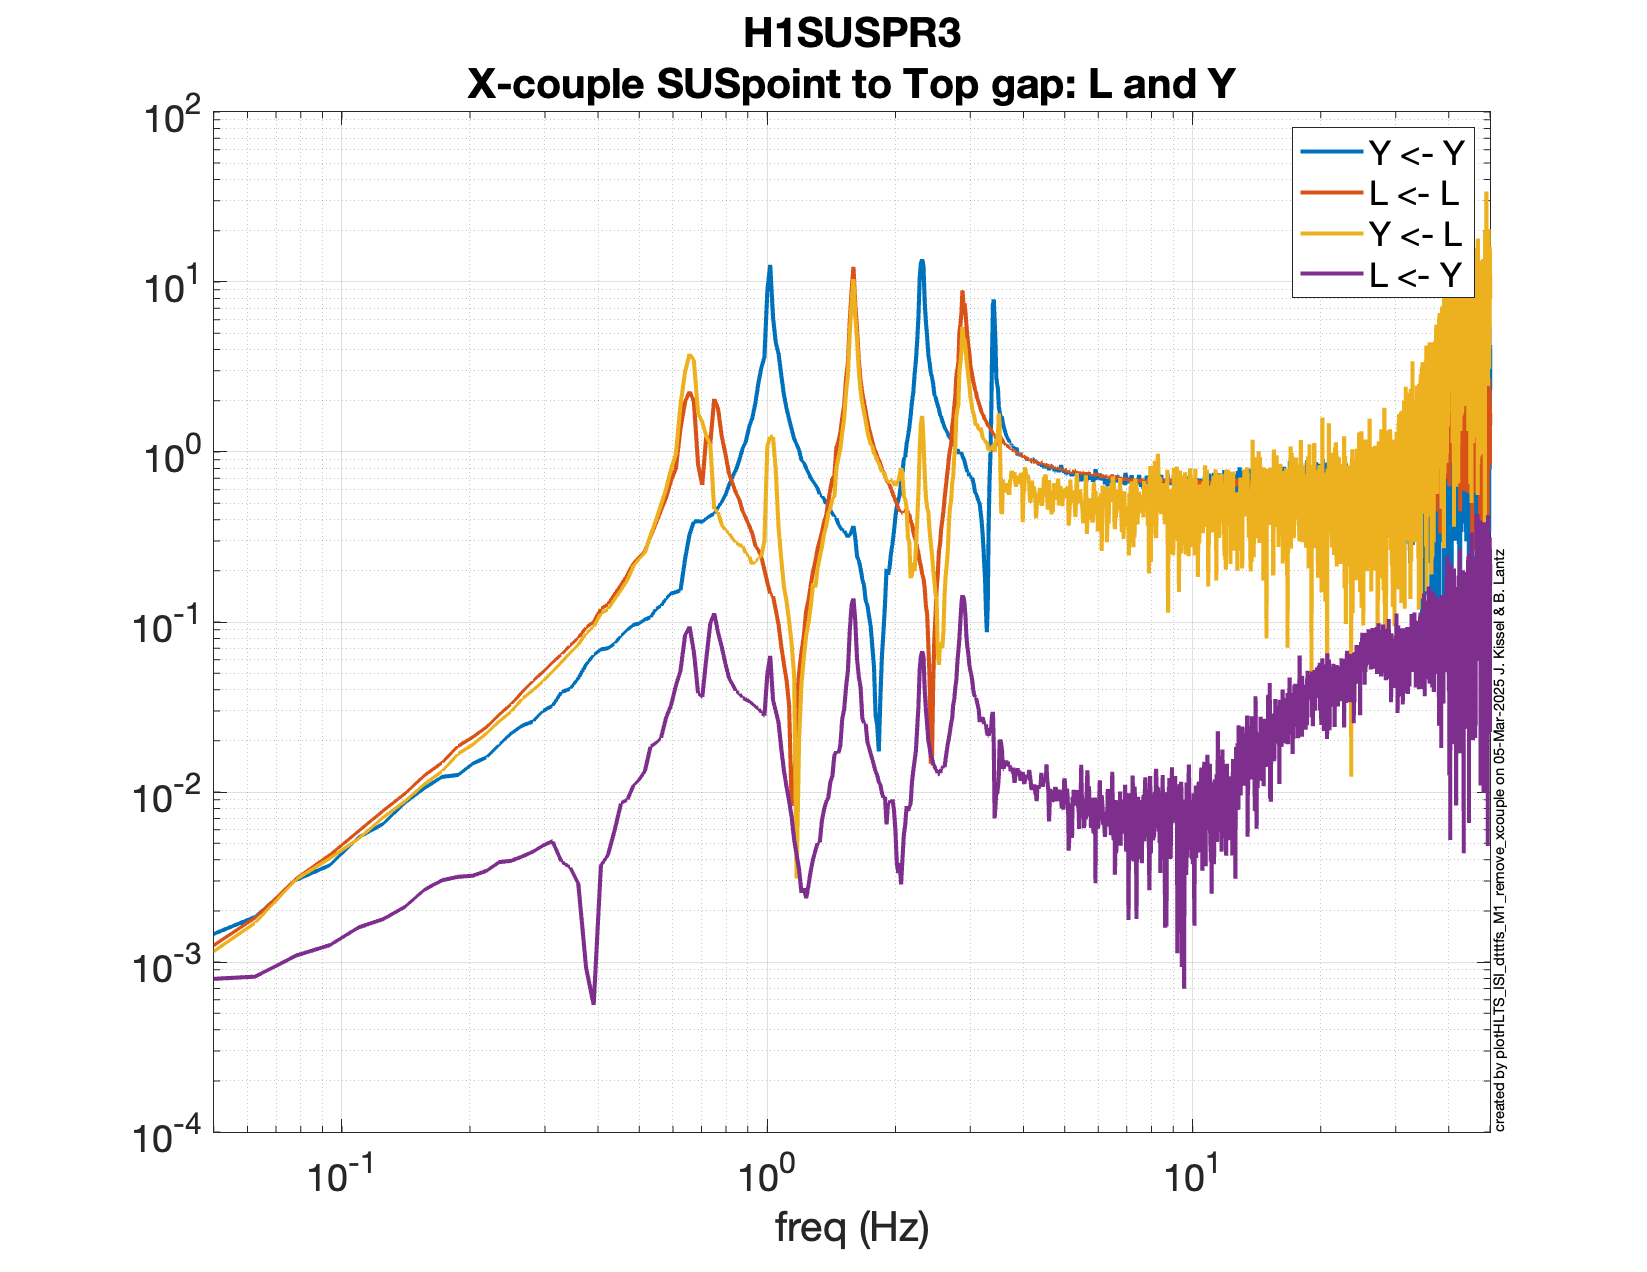
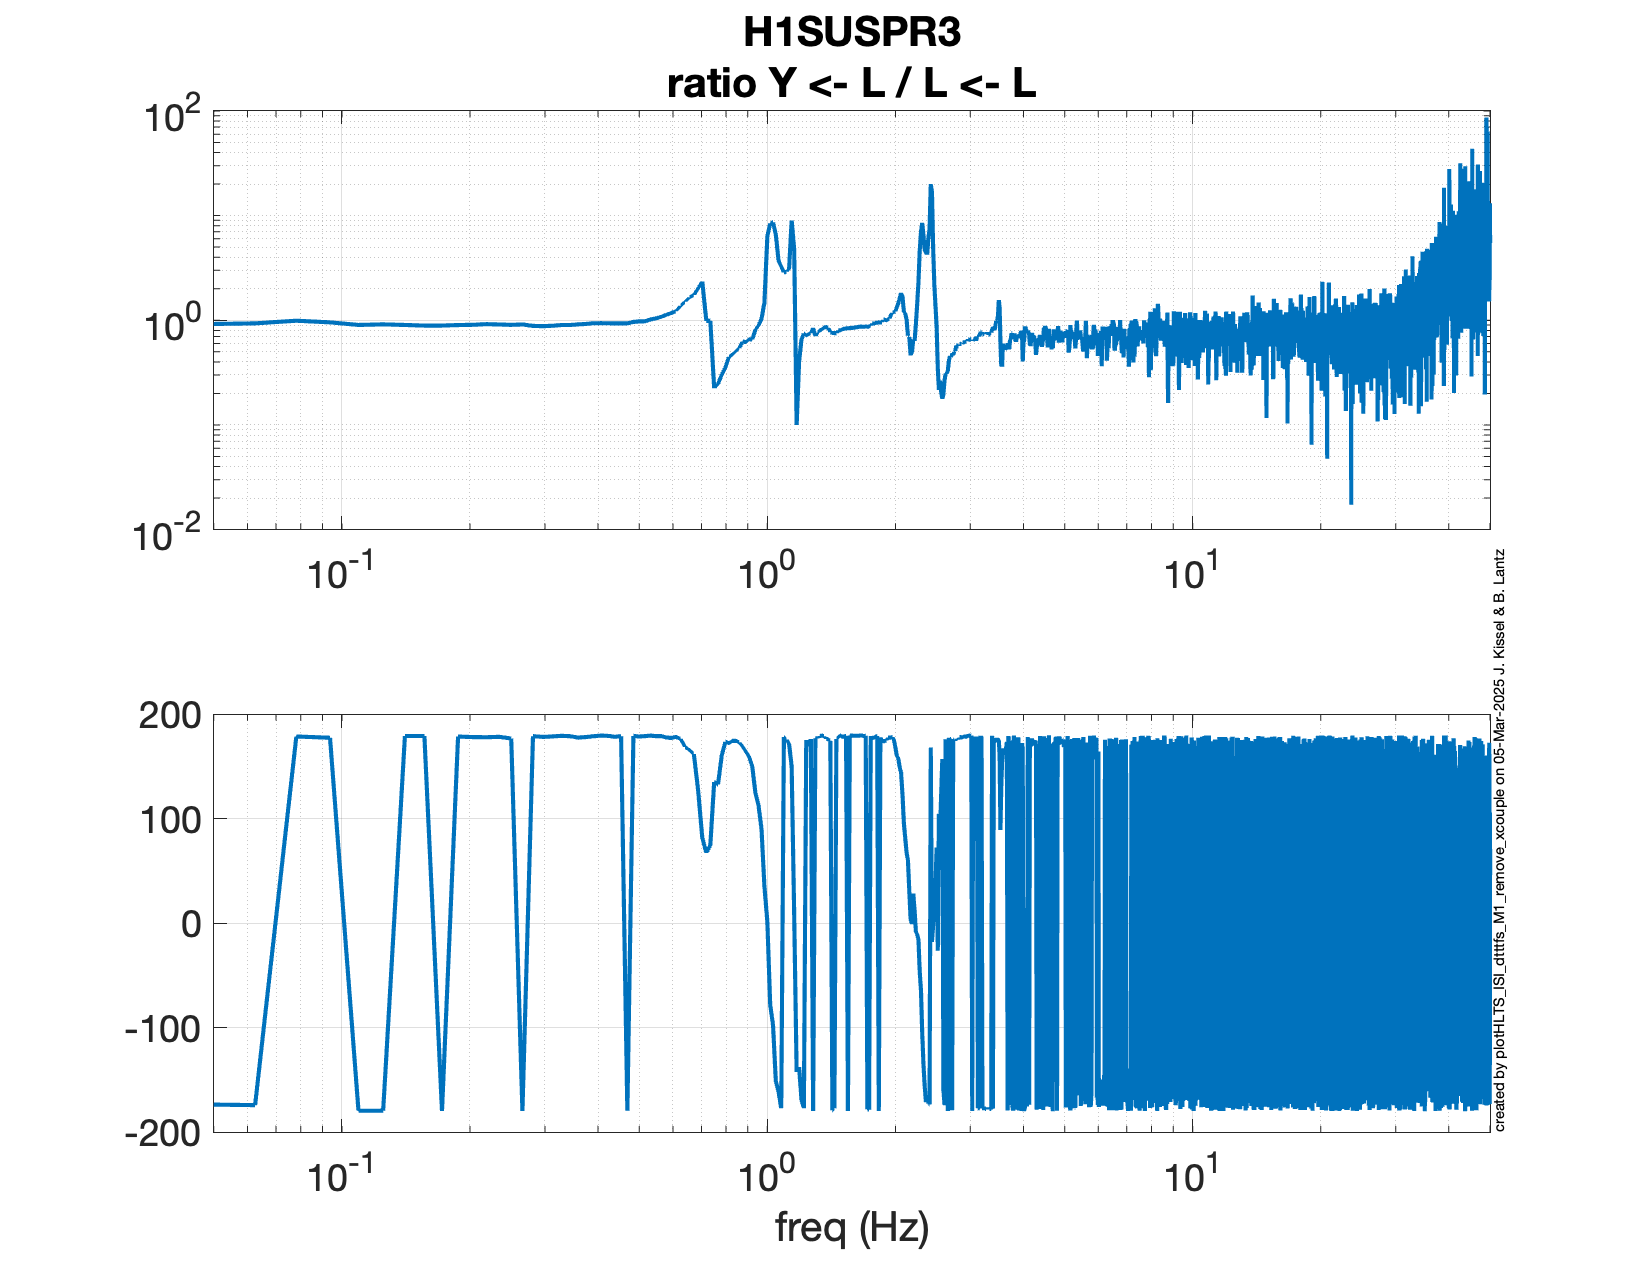
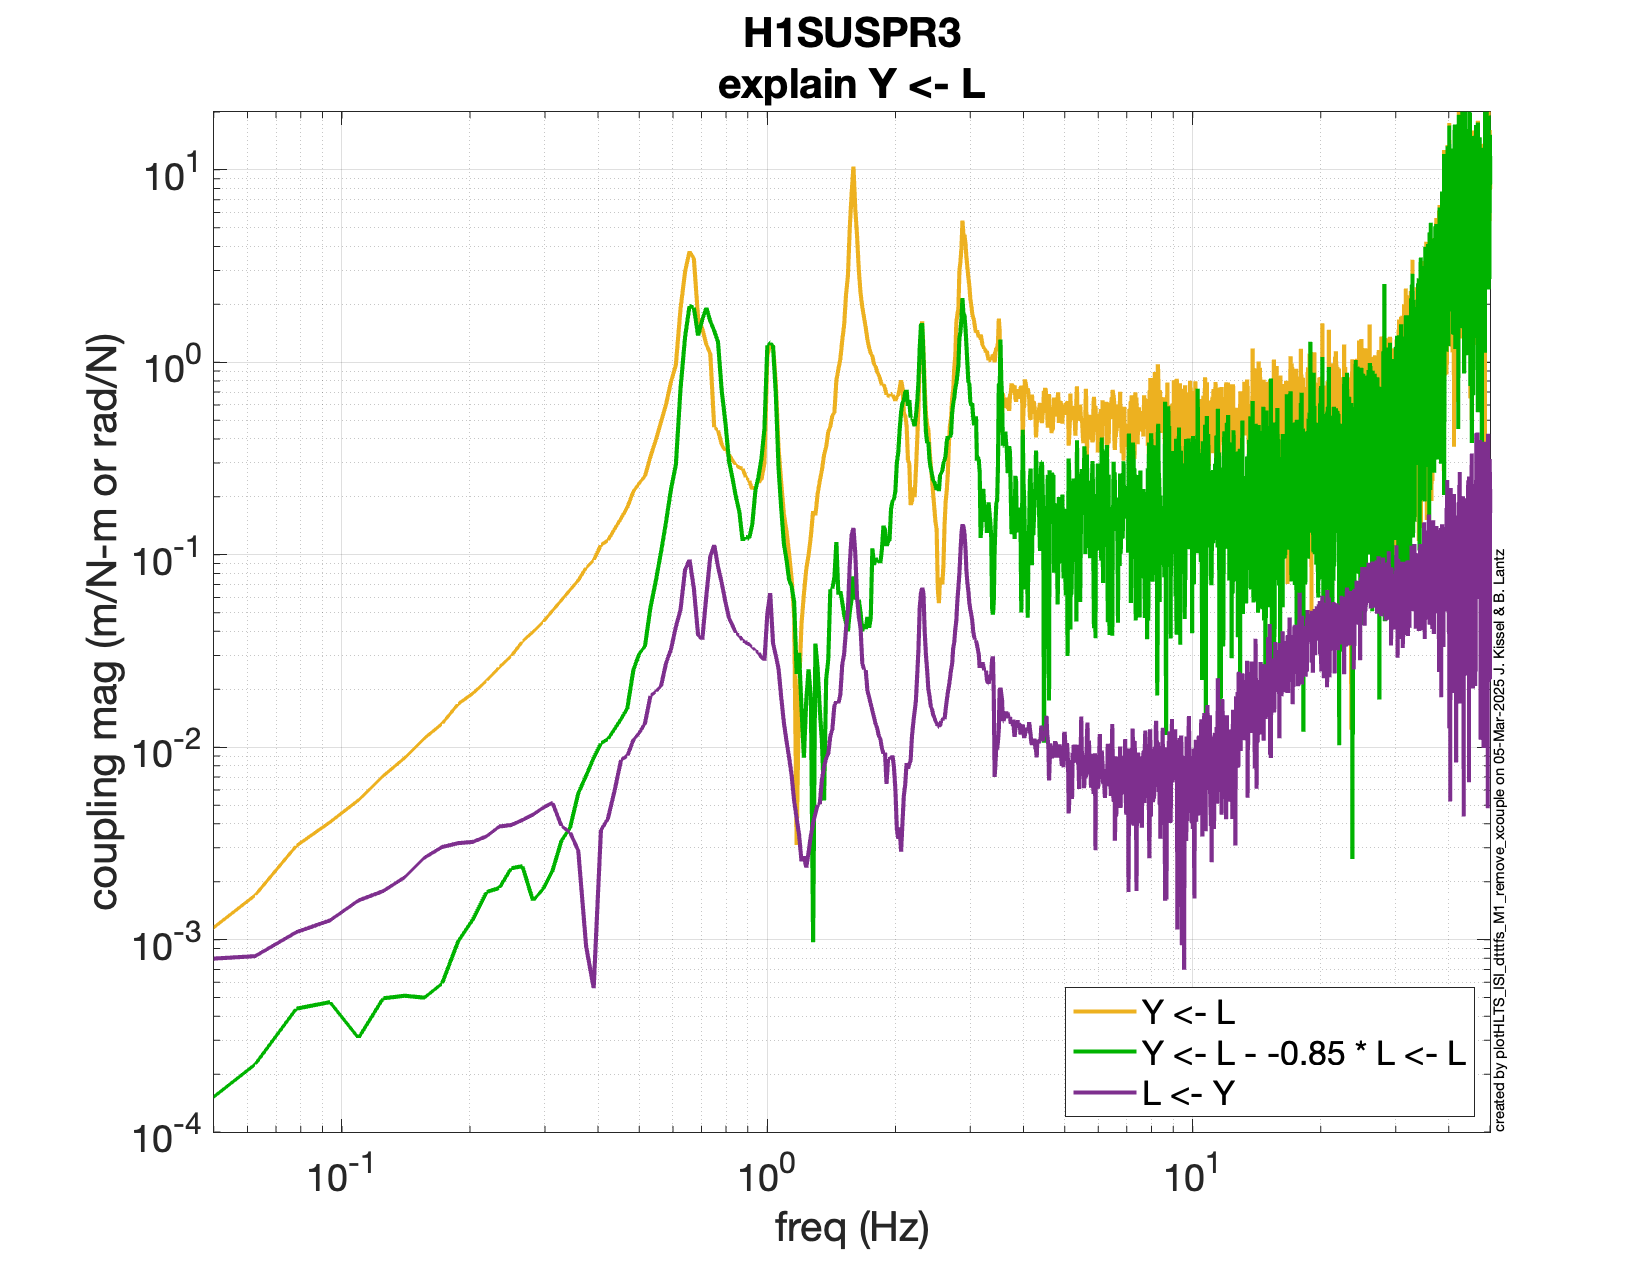
But - a quick comparison (first figure) shows that the L to Y coupling (yellow) does not match the Y to L coupling (purple). If this were a drive from the OSEMs, then this should match. This is actuatually a drive from the ISI, so it is not actually reciprocal - but the ideas are still relevant. For an OSEM drive - we know that mechanical systems are reciprocal, so, to the extent that yellow doesn't match purple, this coupling can not be in the mechanics.

Never-the-less, the similarity of the Length to Length and the Length to Yaw indicates that there is likely a great deal of cross-coupling in the OSEM sensors. We see that the Y response shows a bunch of the L resonances (L to L is the red TF); you drive L, and you see L in the Y signal. This smells of a coupling where the Y sensors see L motion. This is quite plausible if the two L OSEMs on the top mass are not calibrated correctly - because they are very close together, even a small scale-factor error will result in pretty big Y response to L motion.

Next - I did a quick fit (figure 2). I took the Y<-L TF (yellow, measured back in LHO alog 80863) and fit the L<-L TF to it (red), and then subtracted the L<-L component. The fit coefficient which gives the smallest response at the 1.59 Hz peak is about -0.85 rad/meter. 

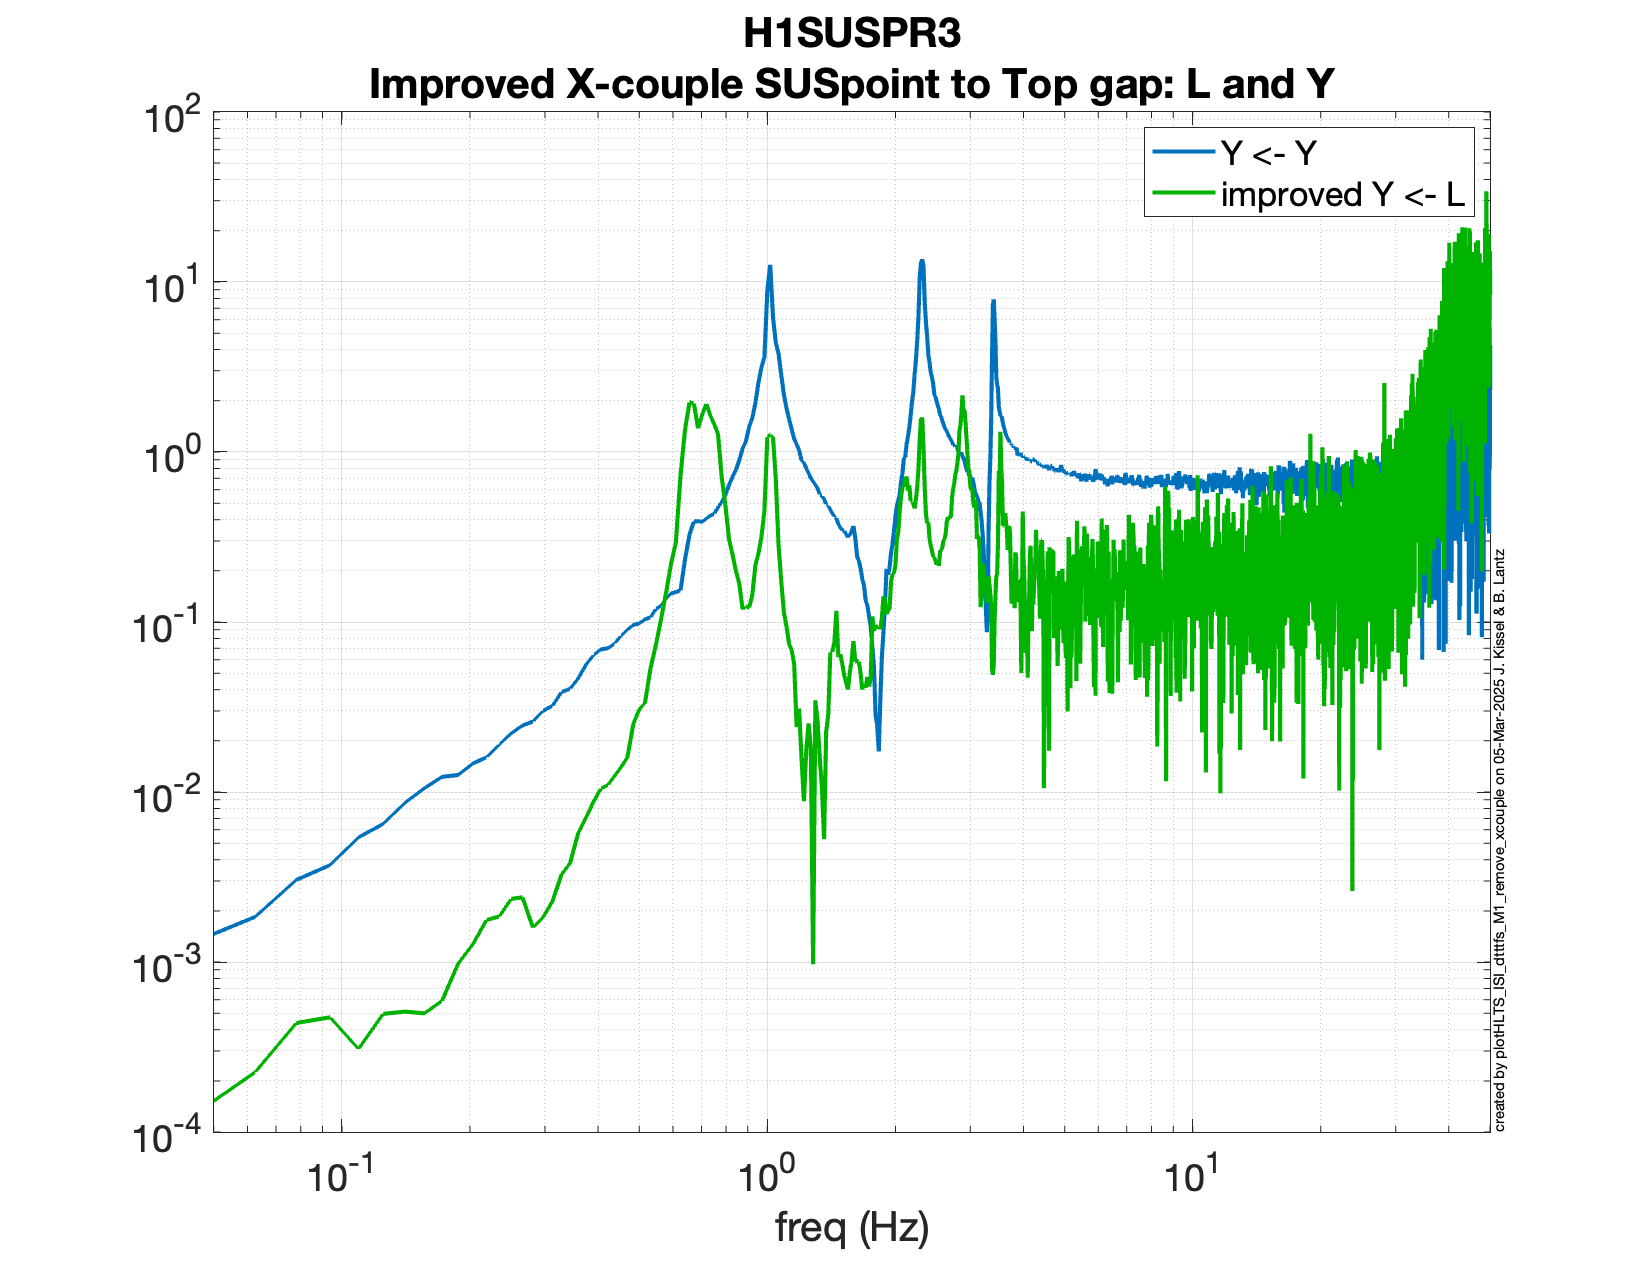
In figure 3, you can see the result in green, which is generally much better. The big peak at 1.59 Hz is much smaller, and the peak at 0.64 is reduced. There is more from the peak at 0.75 (this is related to pitch. Why should the Yaw osems see Pitch motion? maybe transverse motion of the little flags? I don't know, and it's going to be a headache).

The improved Y<-L (green) and the original L<-Y (purple) still don't match, even though they are much closer than the original yellow/purple pair. Hence there is more which could be gained by someone with more cleverness and time than I have right now.

figure 4 - I've plotted just the Y<-Y and Y<-L improved.

Note - The units are wrong - the drive units are all meters or radians not forces and torques, and we know, because of the d-offset in the mounting of the top wires from the suspoint to the top mass, that a L drive of the ISI has first order L and P forces and torques on the top mass. I still need to calculate how much pitch motion we expect to see in the yaw reponse for the mode at 0.75 Hz.

In the meantime - this argues that the yaw motion of PR3 could be reduced quite a bit with a simple update to the SUS large triple model, I suggest a matrix similar to the CPS align in the ISI. I happen to have the PR3 model open right now because I'm trying to add the OSEM estimator parts to it. Look for an ECR in a day or two...

This is run from the code {SUS_SVN}/HLTS/Common/MatlabTools/plotHLTS_ISI_dtttfs_M1_remove_xcouple'

-Brian


Images attached to this report
Comments related to this report
brian.lantz@LIGO.ORG - 11:27, Thursday 06 March 2025 (83209)

ah HA! There is already a SENSALIGN matrix in the model for the M1 OSEMs - this is a great place to implement corrections calculated in the Euler basis. No model changes are needed, thanks Jeff!

brian.lantz@LIGO.ORG - 15:10, Thursday 06 March 2025 (83216)

If this is a gain error in 1 of the L osems, how big is it? - about 15%.


Move the top mass, let osem #1 measure a distance m1, and osem #2 measure m2.

Give osem #2 a gain error, so it's response is really (1+e) of the true distance.
Translate the top mass by d1 with no rotation, and the two signals will be m1= d1 and m2=d1*(1+e)
L is (m1 + m2)/2 = d1/2 + d1*(1+e)/2 = d1*(1+e/2)
The angle will be (m1 - m2)/s where s is the separation between the osems.

I think that s=0.16 meters for top mass of HLTS (from make_sus_hlts_projections.m in the SUS SVN)
Angle measured is (d1 - d1(1+e))/s = -d1 * e /s

The angle/length for a length drive is
-(d1 * e /s)/ ( d1*(1+e/2)) = 1/s * (-e/(1+e/2)) = -0.85 in this measurement
if e is small, then e is approx = 0.85 * s = 0.85 rad/m * 0.16 m = 0.14

so a 14% gain difference between the rt and lf osems will give you about a 0.85 rad/ meter cross coupling. (actually closer to 15% -
0.15/ (1 + 0.075) = 0.1395, but the approx is pretty good.
15% seem like a lot to me, but that's what I'm seeing.

brian.lantz@LIGO.ORG - 09:54, Saturday 22 March 2025 (83489)

I'm adding another plot from the set to show vertical-roll coupling. 

fig 1 - Here, you see that the vertical to roll cross-couping is large. This is consistent with a miscalibrated vertical sensor causing common-mode vertical motion to appear as roll. Spoiler-alert - Edgard just predicted this to be true, and he thinks that sensor T1 is off by about 15%. He also thinks the right sensor is 15% smaller than the left.

-update-

fig 2- I've also added the Vertical-Pitch plot. Here again we see significant response of the vertical motion in the Pitch DOF. We can compare this with what Edgard finds. This will be a smaller difference becasue the the pitch sensors (T2 and T3, I think) are very close together (9 cm total separation, see below).

Here are the spacings as documented i the SUS_SVN/HLTS/Common/MatlabTools/make_sushlts_projections.m

% These distances are defined as magnet-to-magnet, not magnet-to-COM
M1.RollArm = 0.140; % [m]
M1.PitchArm = 0.090; % [m]
M1.YawArm = 0.160; % [m]
Images attached to this comment
edgard.bonilla@LIGO.ORG - 18:10, Monday 24 March 2025 (83539)

I was looking at the M1 ---> M1 transfer functions last week to see if I could do some OSEM gain calibration.

The details of the proposed sensor rejiggling is a bit involved, but the basic idea is that the part of the M1-to-M1 transfer function coming from the mechanical plant should be reciprocal (up to the impedances of the ISI). I tried to symmetrize the measured plant by changing the gains of the OSEMs, then later by including the possibility that the OSEMs might be seeing off-axis motion.

Three figures and three findings below:

0)  Finding 1: The reciprocity only allows us to find the relative calibrations of the OSEMs, so all of the results below are scaled to the units where the scale of the T1 OSEM is 1. If we want absolute calibrations, we will have to use an independent measurement, like the ISI-->M1 transfer functions. This will be important when we analyze the results below.

1) Figure 1:  shows the full 6x6 M1-->M1 transfer function matrix between all of the DOFs in the Euler basis of PR3. The rows represent the output DOF and the columns represent thr input DOF. The dashed lines represent the transpose of the transfer function in question for easier comparison. The transfer matrix is not reciprocal.

2) Finding 2: The diagonal correction (relative to T1) is given by:

            T1         T2          T3          LF          RT         SD
            1            0            0            0            0            0      T1
            0         0.89          0            0            0            0      T2
            0            0         0.84          0            0            0      T3
            0            0            0         0.86          0            0      LF
            0            0            0            0            1            0      RT
            0            0            0            0            0         0.84    SD
 
This shows the 14% difference between RT and LF that Brian saw (leading to L-Y coupling in the ISI-to-M1 transfer functions)
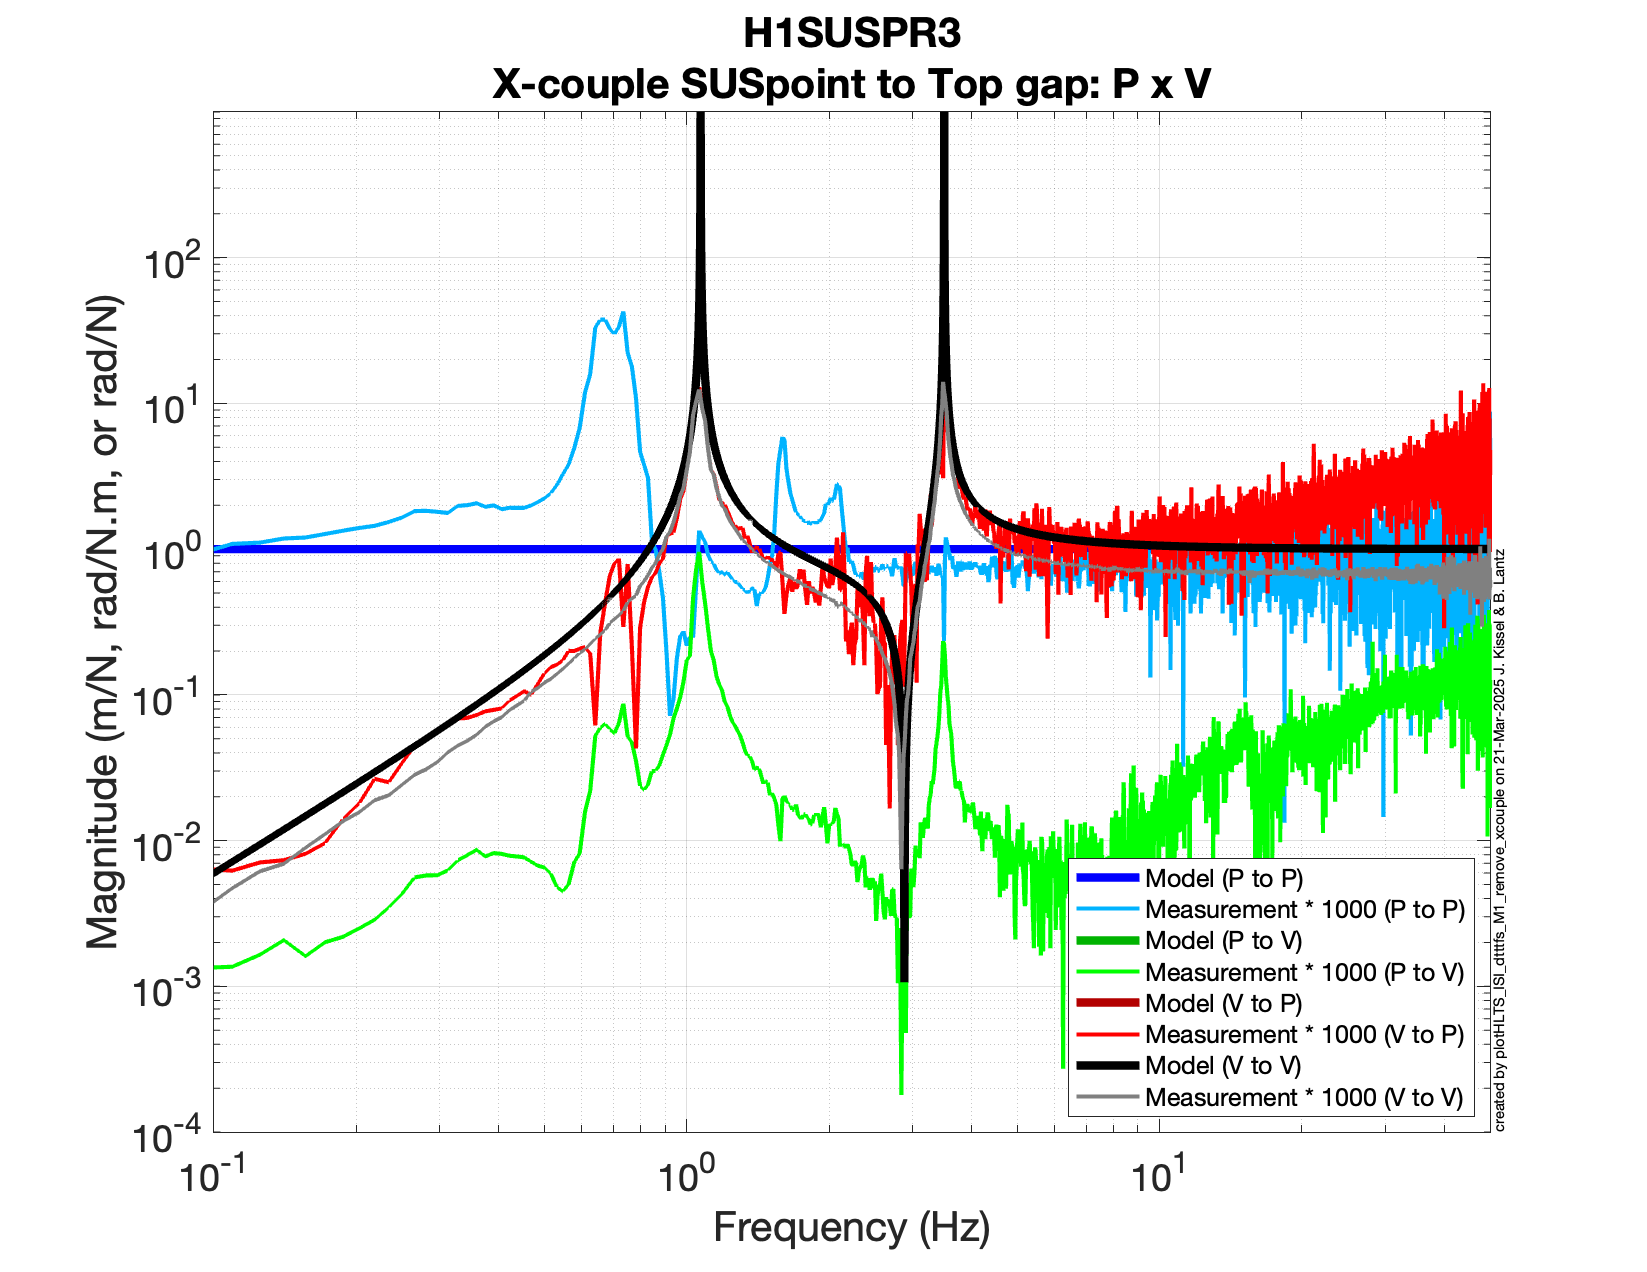
This also shows the 10-16% difference between T2/T3 and T1 that leads to the V-R coupling that  Brian posted in the comment above.
Since we normalized by T1, the most likely explanation for the discrepancies is that T1 and RT are both 14% ish low compared to the other 4 sensors. 
 
3) Figure 2:  shows the 6x6 M1-->M1 transfer function matrix, after applying the scaling factors.
The main difference is in the Length-to-Yaw and the Vertical-to-Roll degrees of freedom, as mentioned before. Note that the rescaling was made only to make the responses more symmetric, the decoupling of the dofs a welcome bonus.
 
4) Finding 3: We can go one step further and allow the sensors to be sensitive to other directions. In this case, the matrix below is mathematically moving the sensors to where the actuators are, in an attempt to collocate them as much as possible.
            T1            T2            T3              LF             RT             SD
                1         0.03         0.03        -0.001       -0.006        0.038      T1
        0.085        0.807        0.042       0.005        0.006        0.006      T2
        0.096        0.077        0.723       0.013        0.002         0.03       T3
       -0.036        0.025        -0.02        0.696        0.012        0.006      LF
       -0.004       -0.018        0.045       0.016        0.809       -0.004     RT
       -0.035        0.026         0.02        0.004       -0.008        0.815      SD
I haven't yet found a good interpretation for these numbers, beyond the idea that they mean the sensors and actuators are not collocated.
Three reasons come to mind:
a) The flags and the magnets are a bit off from each other and we are able to pick it up the difference.
b) The OSEMs are sensing sideways motion of the flag.
c) The actuators are pushing (or torquing) the suspension in other ways than their intended direction.
 
The interesting observation comes when observing Figure 3 .
After we apply this correction to the sensor side of the transfer function, we see a dramatic change in the symmetry and the amplitude of the transfer matrix. Particularly, the Transverse degree of freedom is much less coupled to both Vertical and Longitudinal. Similarly, the Pitch to Vertical also improves a bit.
This is to say, by trying to make the plant more reciprocal, we also end up decoupling the degrees of freedom. We can conclude that there's either miscollocation of the sensor/actuator parts of the OSEM, or, more likely, that the OSEMs are reading side motions of the flag, because we are able to better see the decoupled plant by just assuming this miscalibration.

I will post more analysis in the Euler basis later.

Non-image files attached to this comment
brian.lantz@LIGO.ORG - 15:06, Tuesday 25 March 2025 (83555)

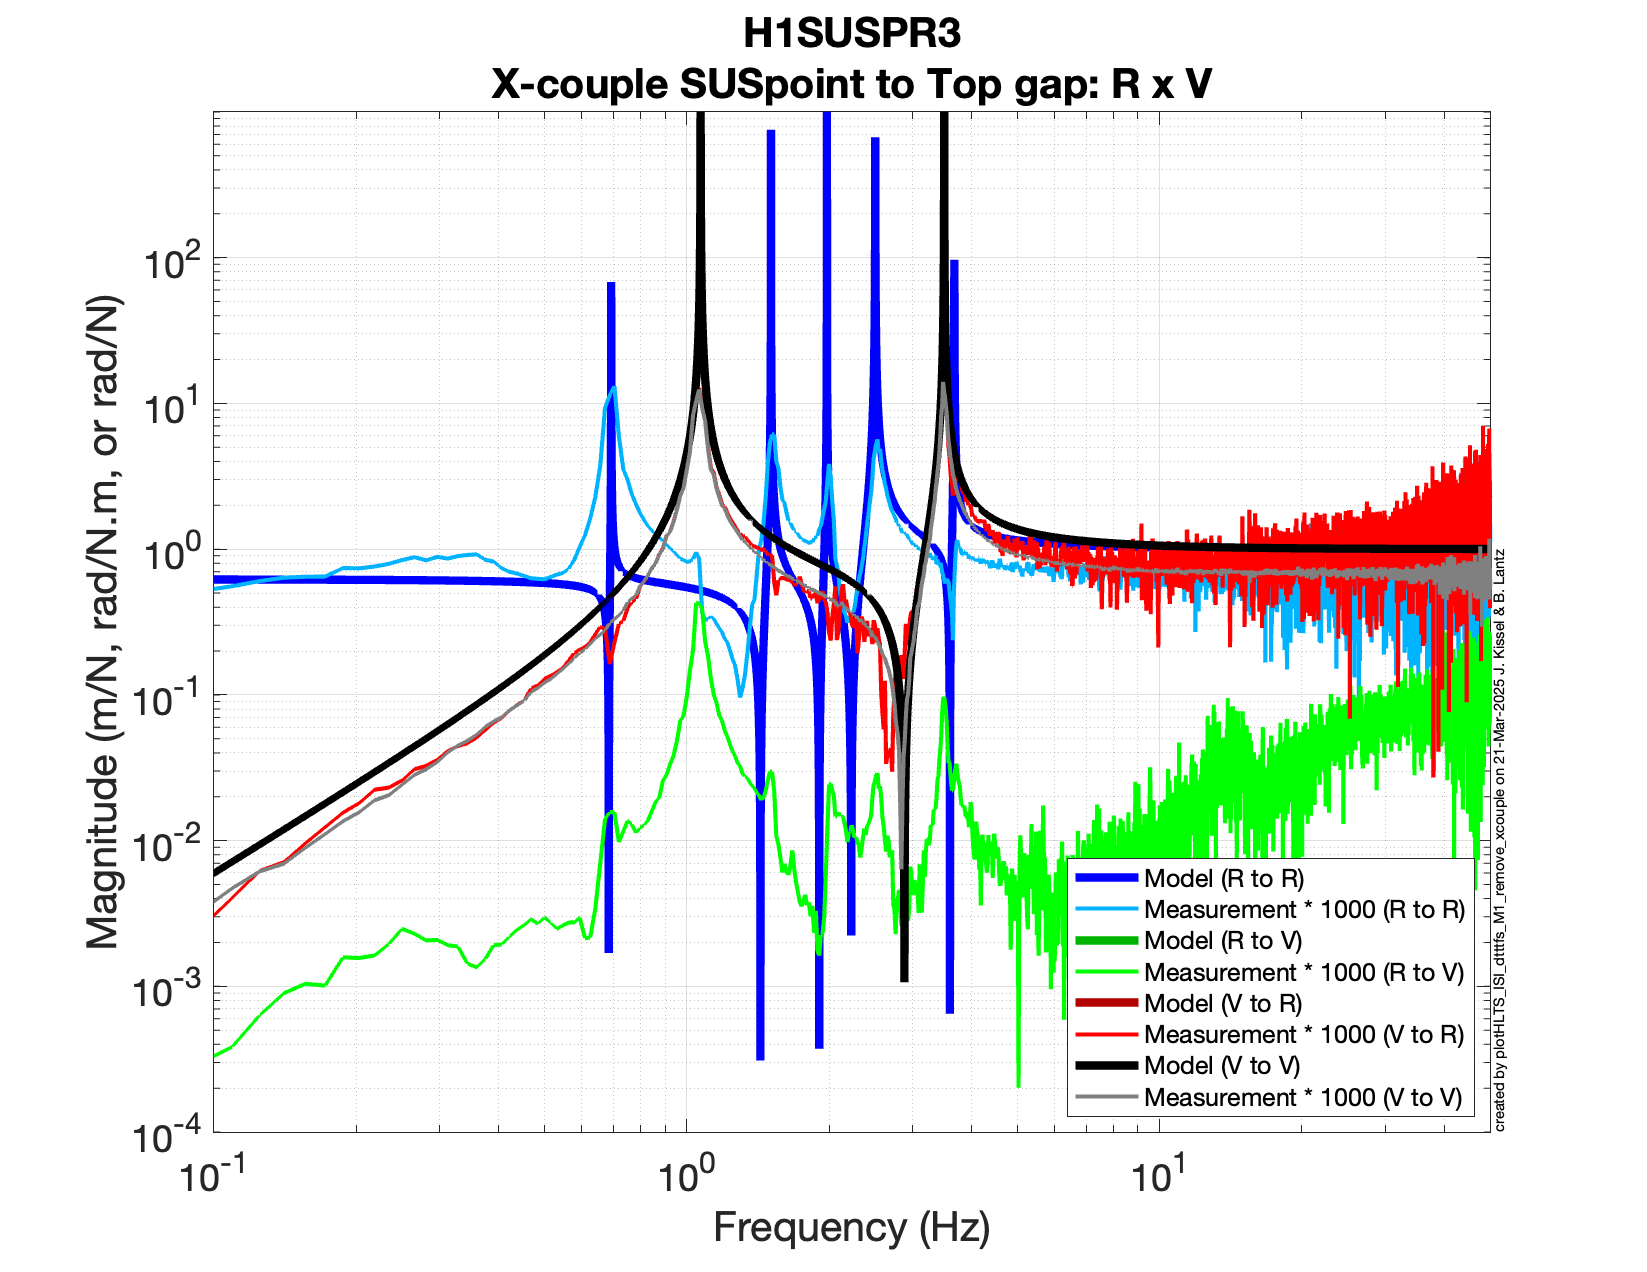
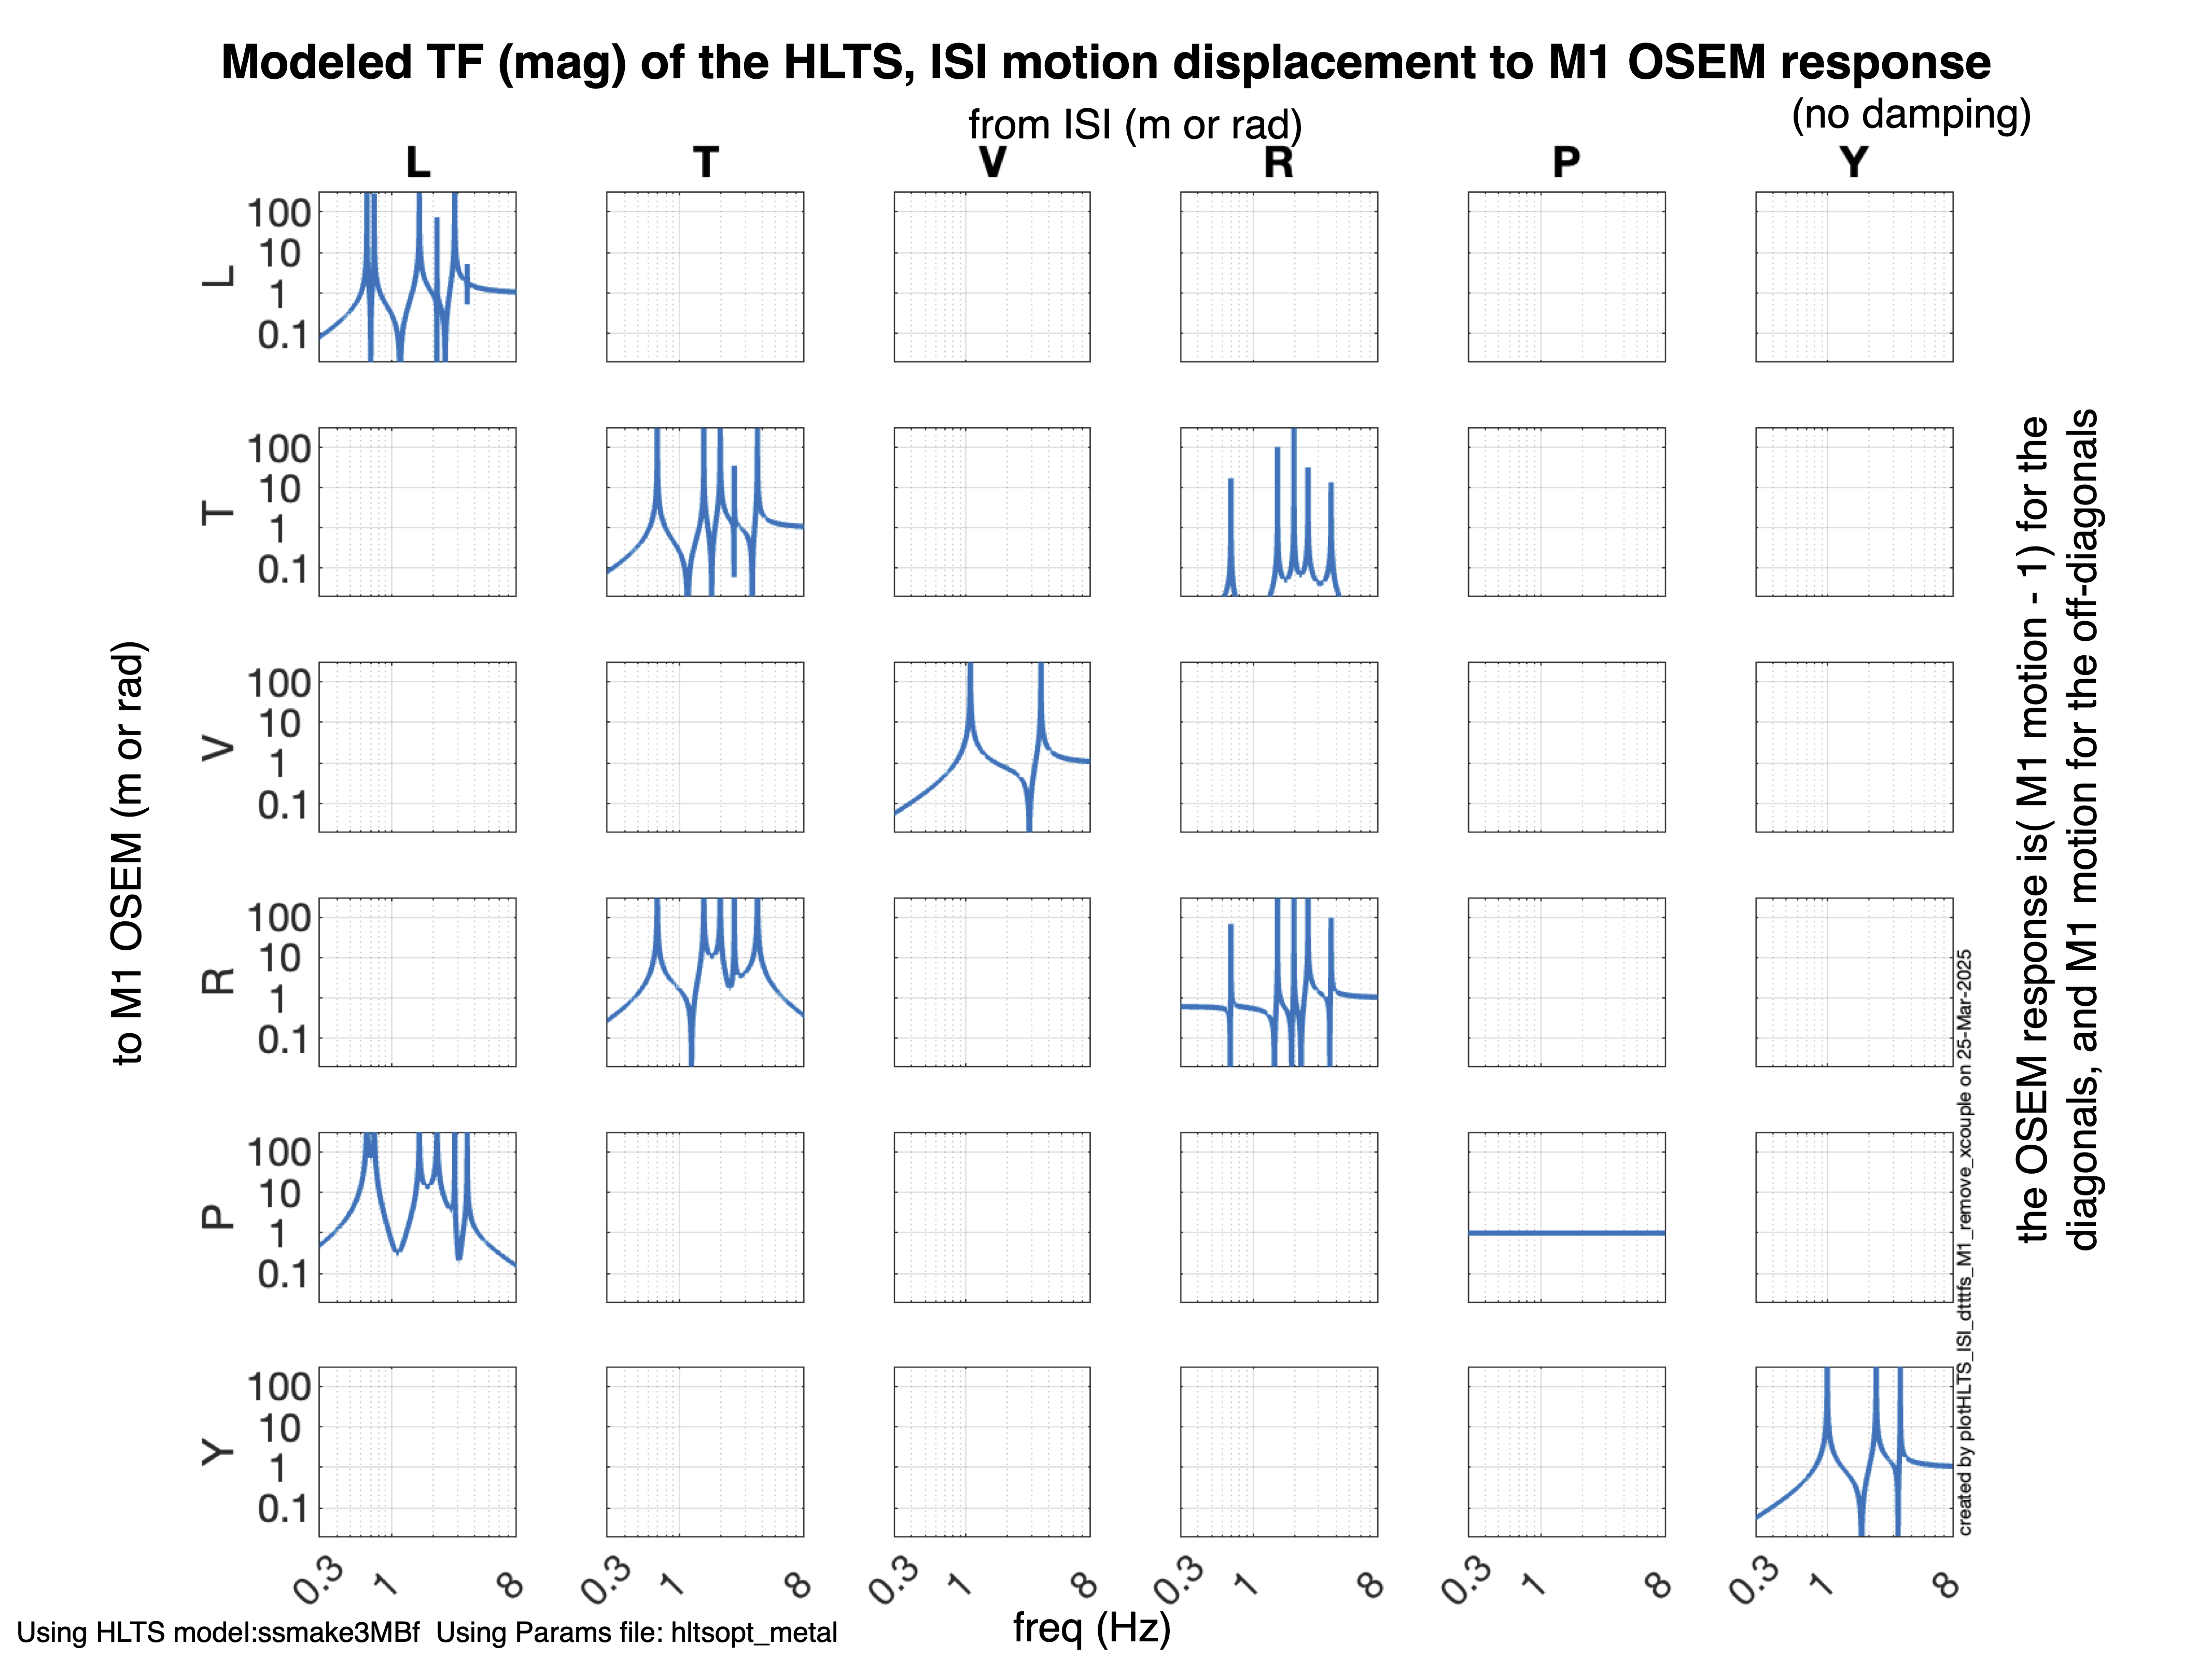
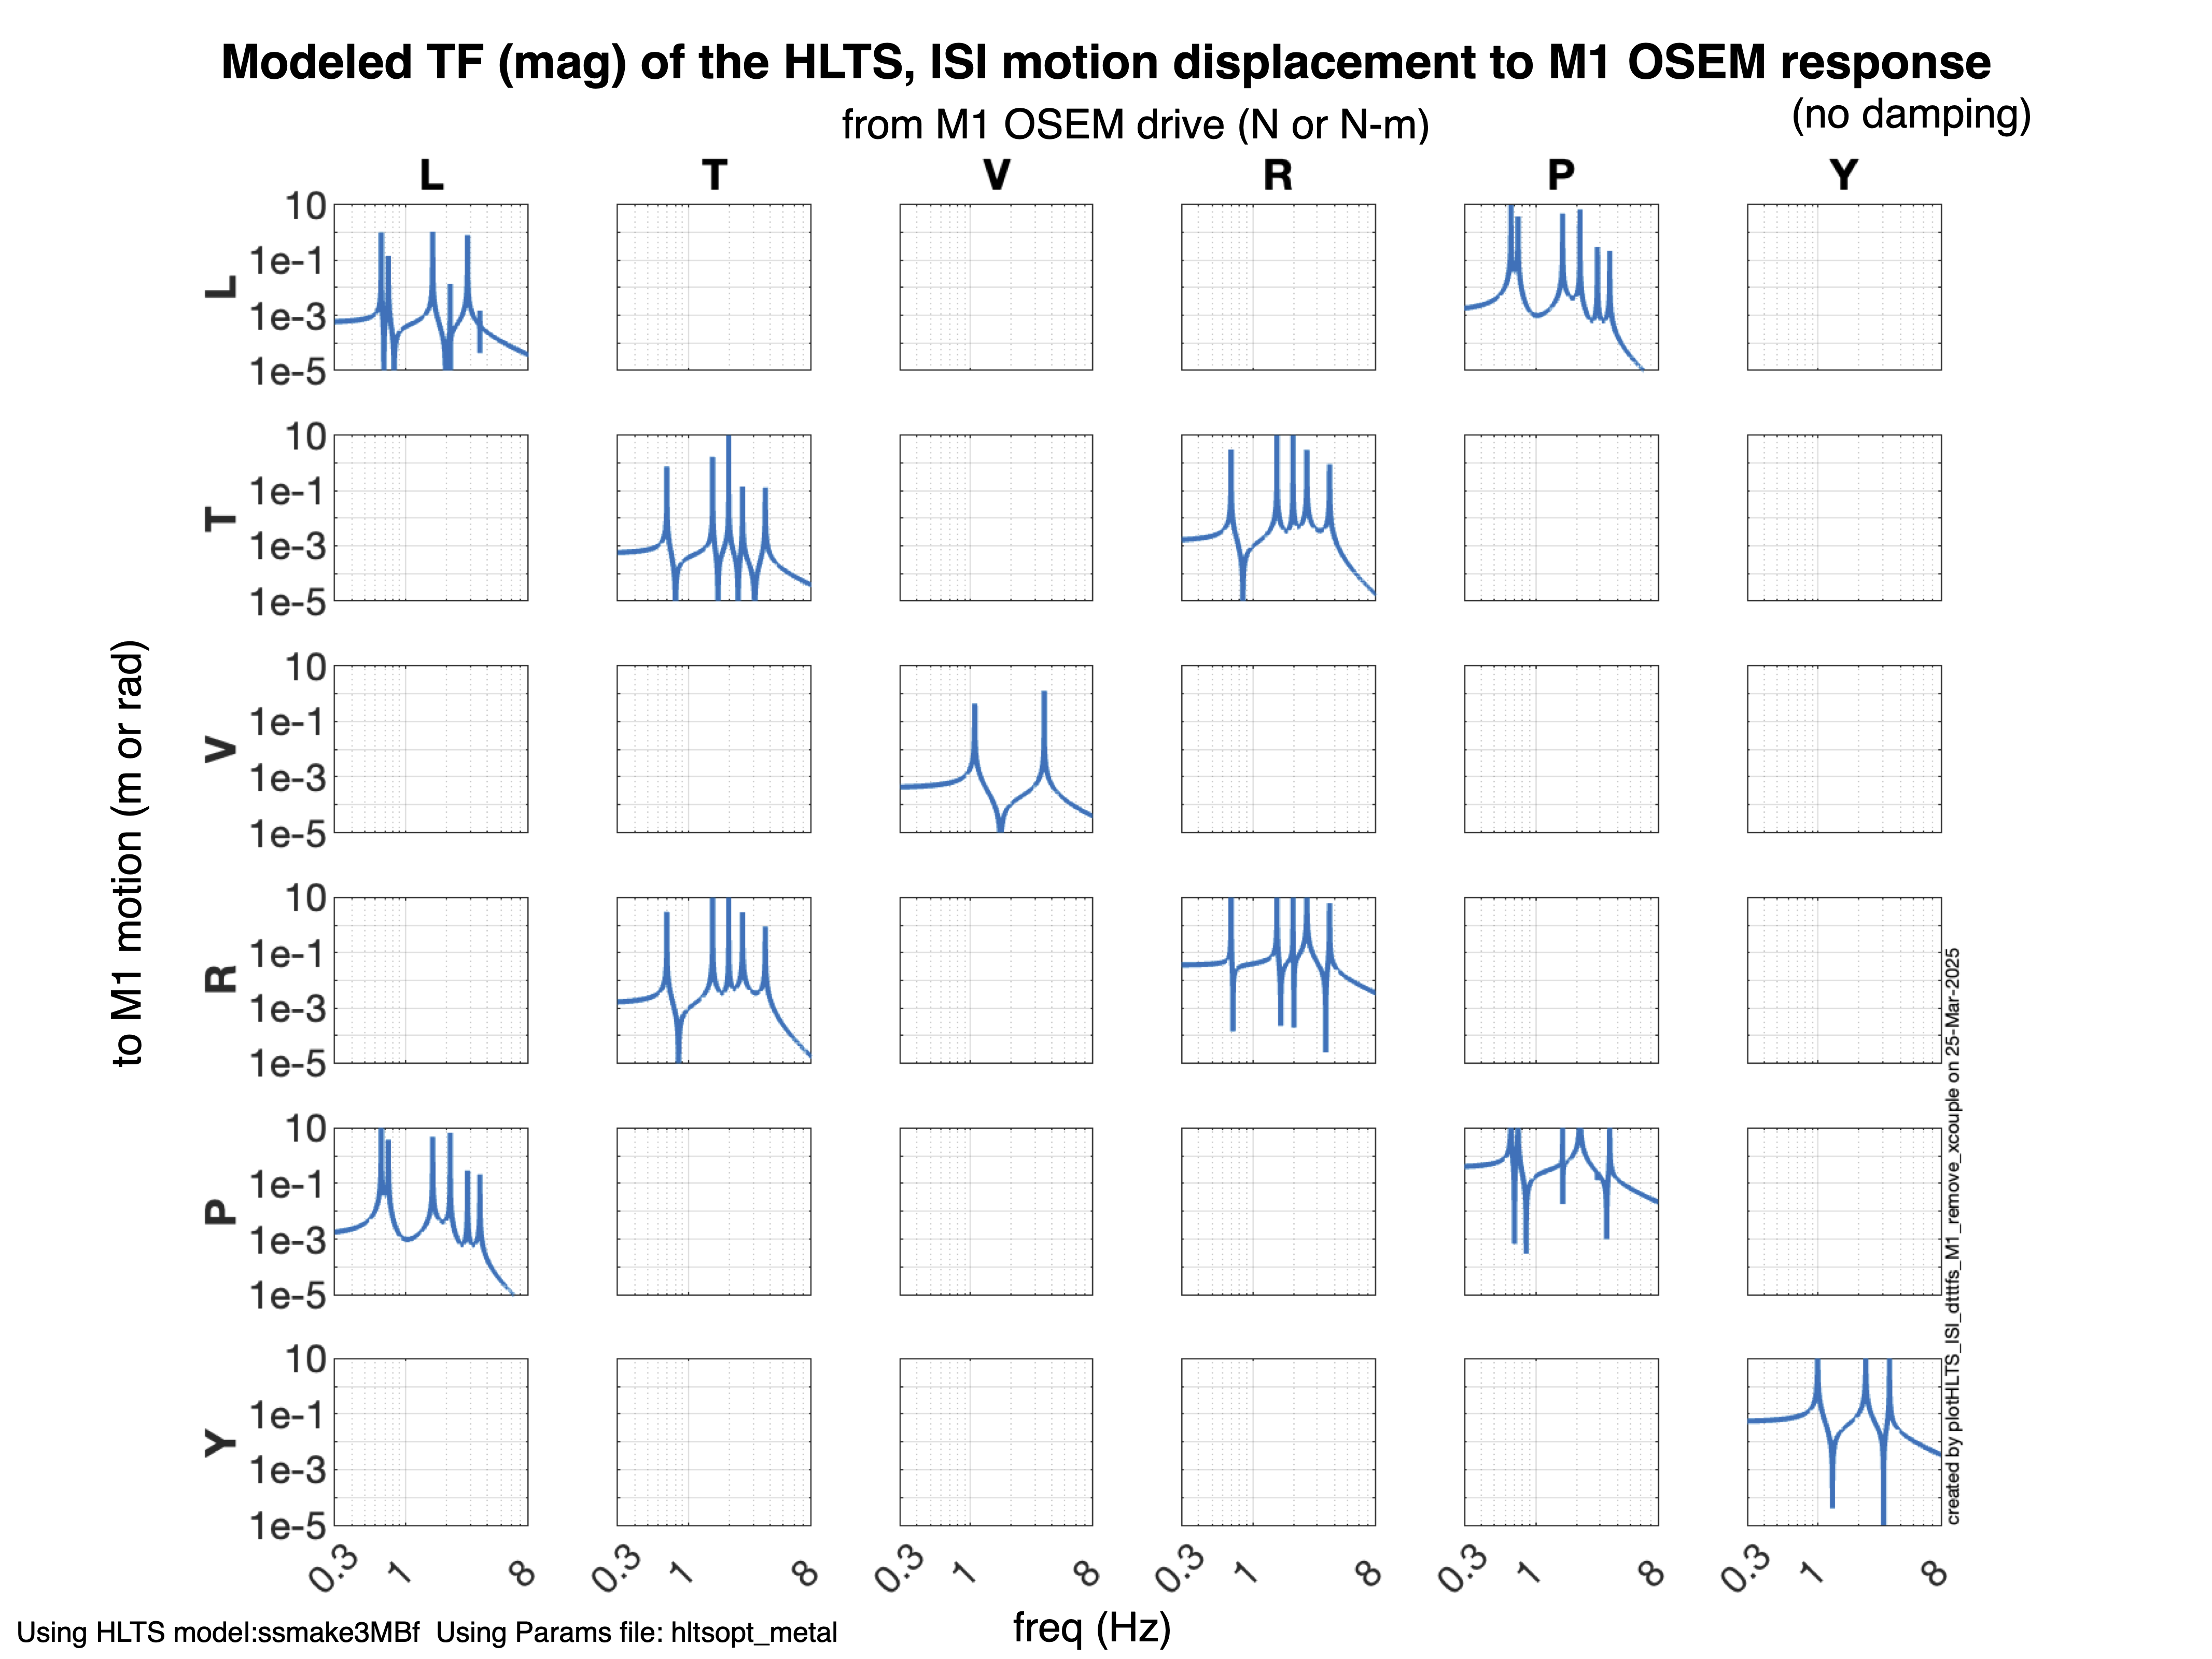
Here's a view of the Plant model for the HLTS - damping off, motion of M1. These are for reference as we look at which cross-coupling should exist. (spoiler - not many)

First plot is the TF from the ISI to the M1 osems.
L is coupled to P, T & R are coupled, but that's all the coupling we have in the HLTS model for ISI -> M1.

Second plot is the TF from the M1 drives to the M1 osems.
L & P are coupled, T & R are coupled, but that's all the coupling we have in the HLTS model for M1 -> M1.

These plots are Magnitude only, and I've fixed the axes.

For the OSEM to OSEM TFs, the level of the TFs in the blank panels is very small - likely numerical issues. The peaks are at the 1e-12 to 1e-14 level.

Images attached to this comment
Non-image files attached to this comment
jeffrey.kissel@LIGO.ORG - 12:03, Monday 31 March 2025 (83662)CSWG, SUS
@Brian, Edgard -- I wonder if some of this ~10-20% mismatch in OSEM calibration is that we approximate the D0901284-v4 sat amp whitening stage with a compensating filter of z:p = (10:0.4) Hz?
(I got on this idea thru modeling the *improvement* to the whitening stage that is already in play at LLO and will be incoming into LHO this summer; E2400330)

If you math out the frequency response from the circuit diagram and component values, the response is defined by 
    %  Vo                         R180
    % ---- = (-1) * --------------------------------
    %  Vi           Z_{in}^{upper} || Z_{in}^{lower}
    %
    %               R181   (1 + s * (R180 + R182) * C_total)
    %      = (-1) * ---- * --------------------------------
    %               R182      (1 + s * (R180) * C_total)
So for the D0901284-v4 values of 
    R180 = 750;
    R182 = 20e3;
    C150 = 10e-6;
    C151 = 10e-6;

    R181 = 20e3;

that creates a frequency response of 
    f.zero = 1/(2*pi*(R180+R182)*C_total) = 0.3835 [Hz]; 
    f.pole = 1/(2*pi*R180*C_total) = 10.6103 [Hz];


I attach a plot that shows the ratio of the this "circuit component value ideal" response to approximate response, and the response ratio hits 7.5% by 10 Hz and ~11% by 100 Hz.

This is, of course for one OSEM channel's signal chain. 

I haven't modeled how this systematic error in compensation would stack up with linear combinations of slight variants of this response given component value precision/accuracy, but ...

... I also am quite confident that no one really wants to go through an measure and fit the zero and pole of every OSEM channel's sat amp frequency response, so maybe you're doing the right thing by "just" measuring it with this technique and compensating for it in the SENSALIGN matrix. Or at least measure one sat amp box's worth, and see how consistent the four channels are and whether they're closer to 0.4:10 Hz or 0.3835:10.6103 Hz.

Anyways -- I thought it might be useful to be aware of the many steps along the way that we've been lazy about the details in calibrating the OSEMs, and this would be one way to "fix it in hardware."
Non-image files attached to this comment
LHO VE
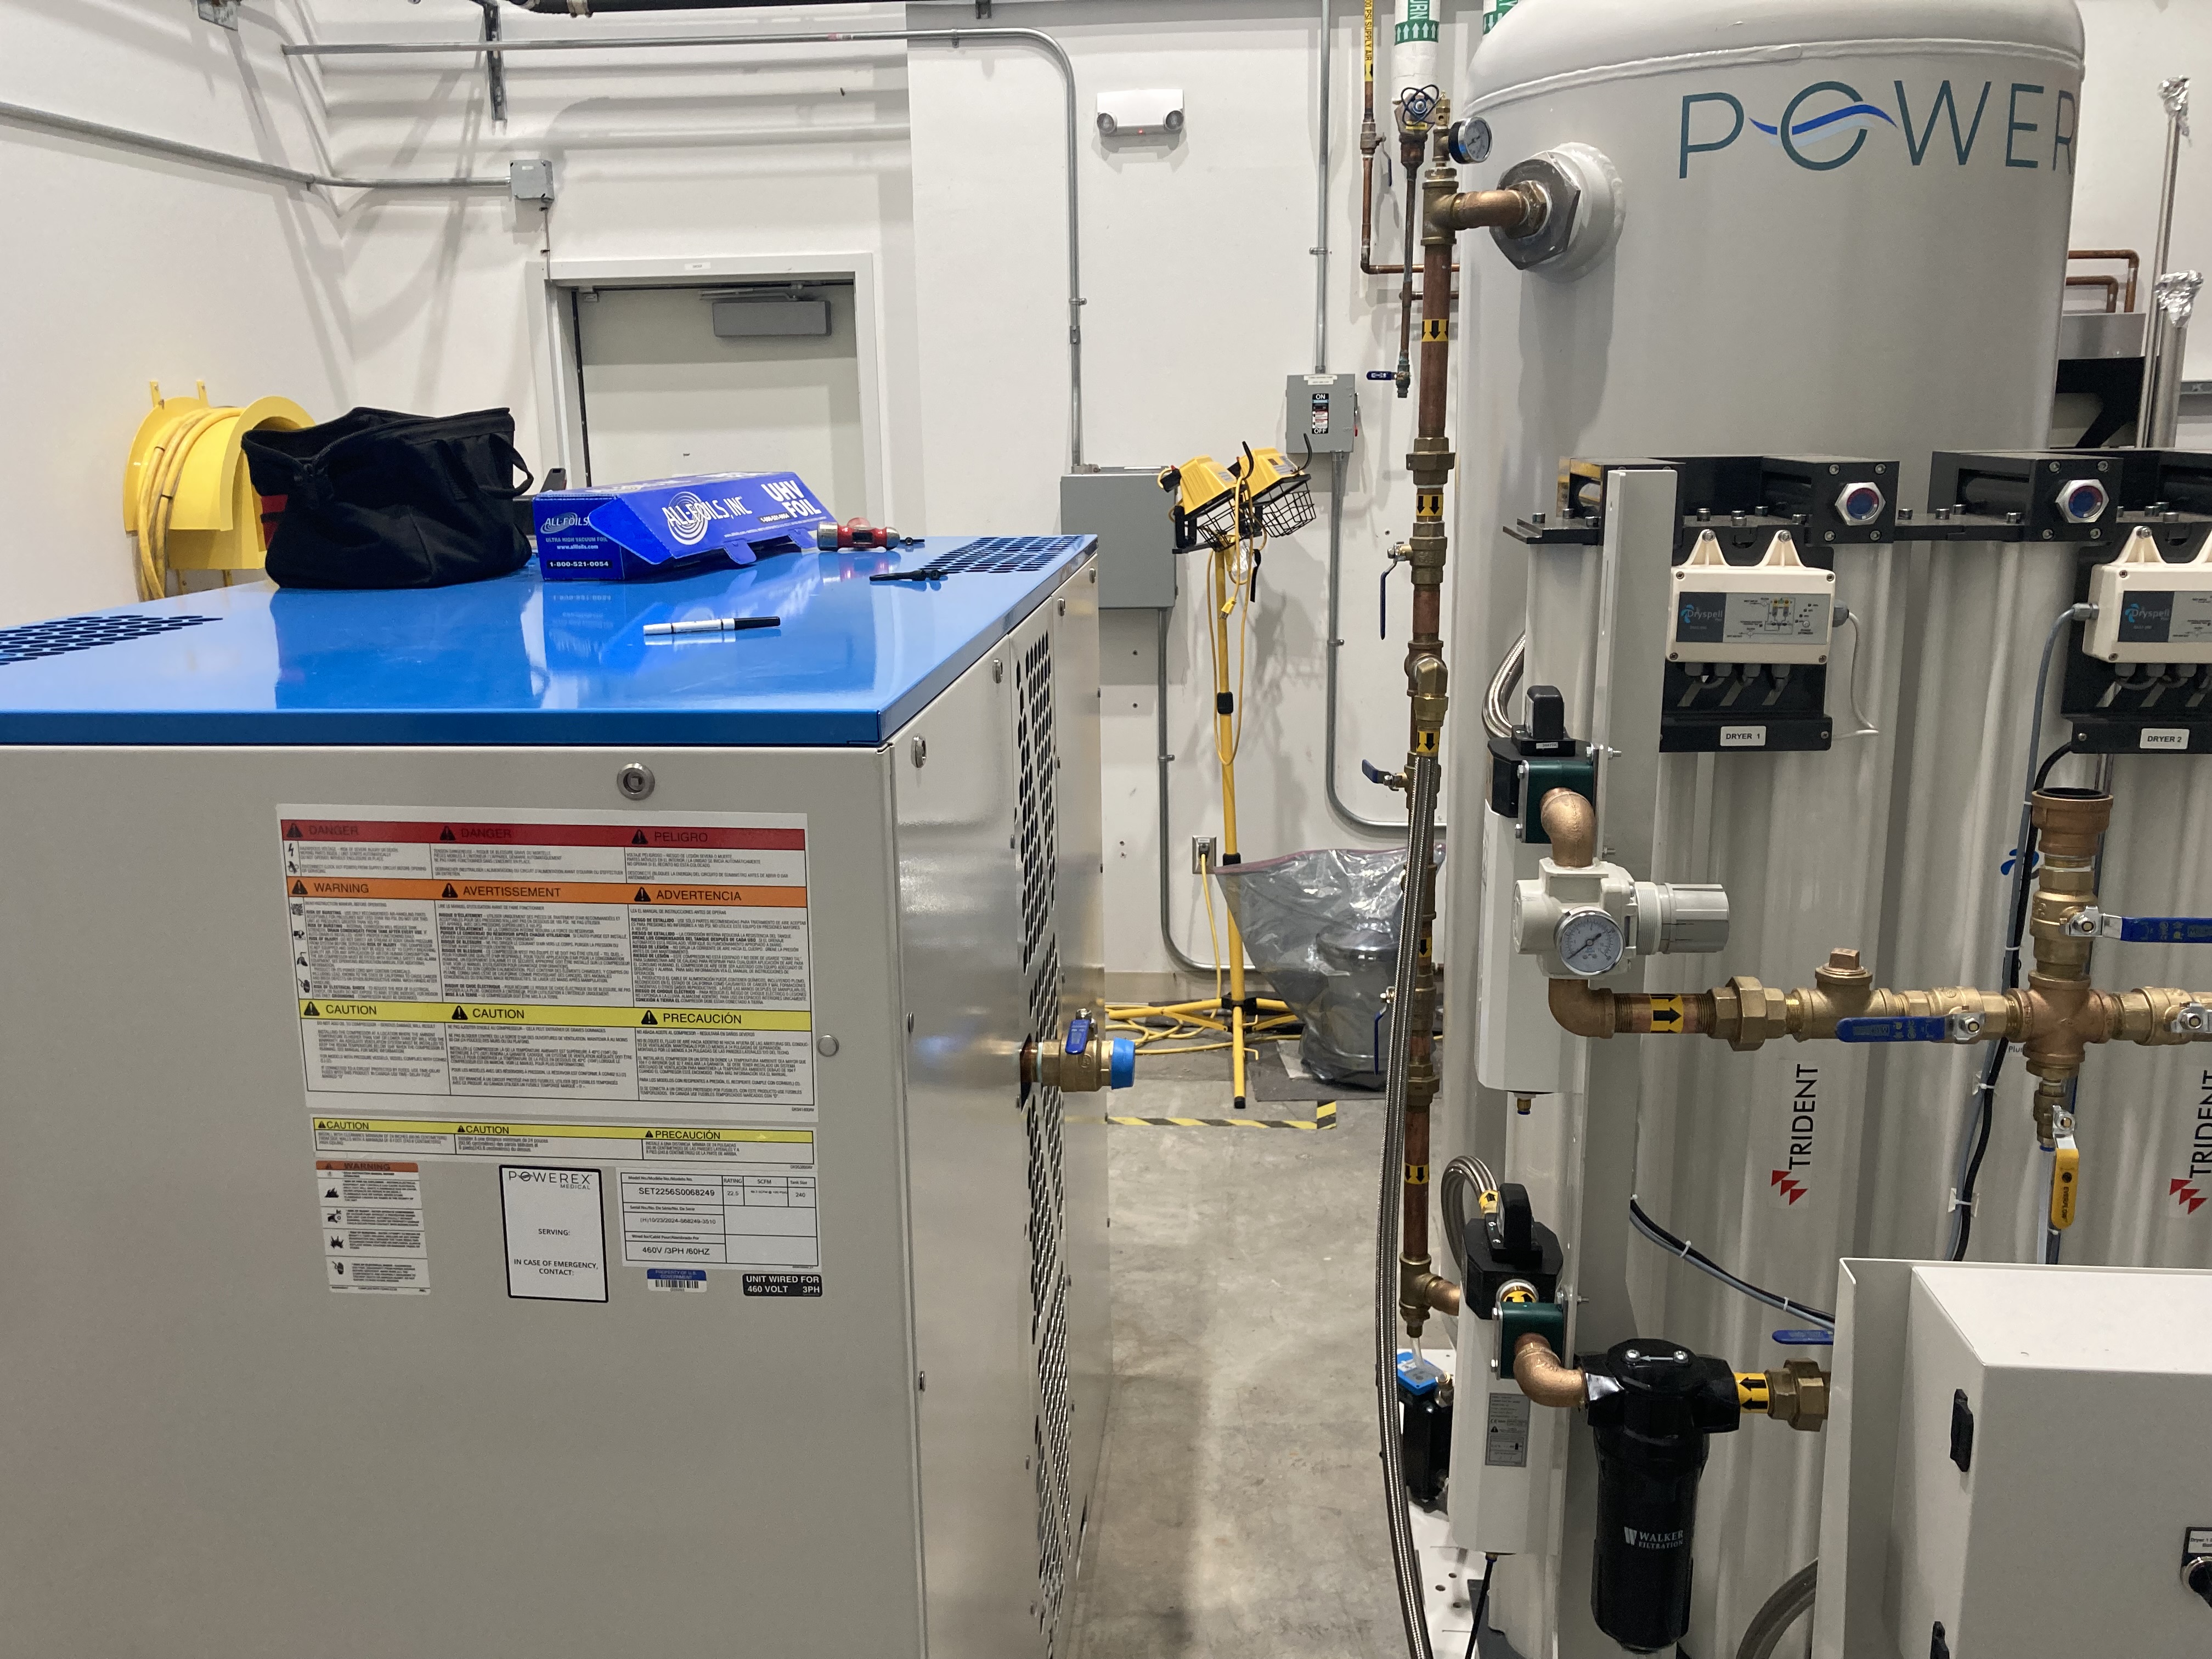
janos.csizmazia@LIGO.ORG - posted 12:11, Wednesday 26 February 2025 - last comment - 16:15, Friday 21 March 2025(83066)
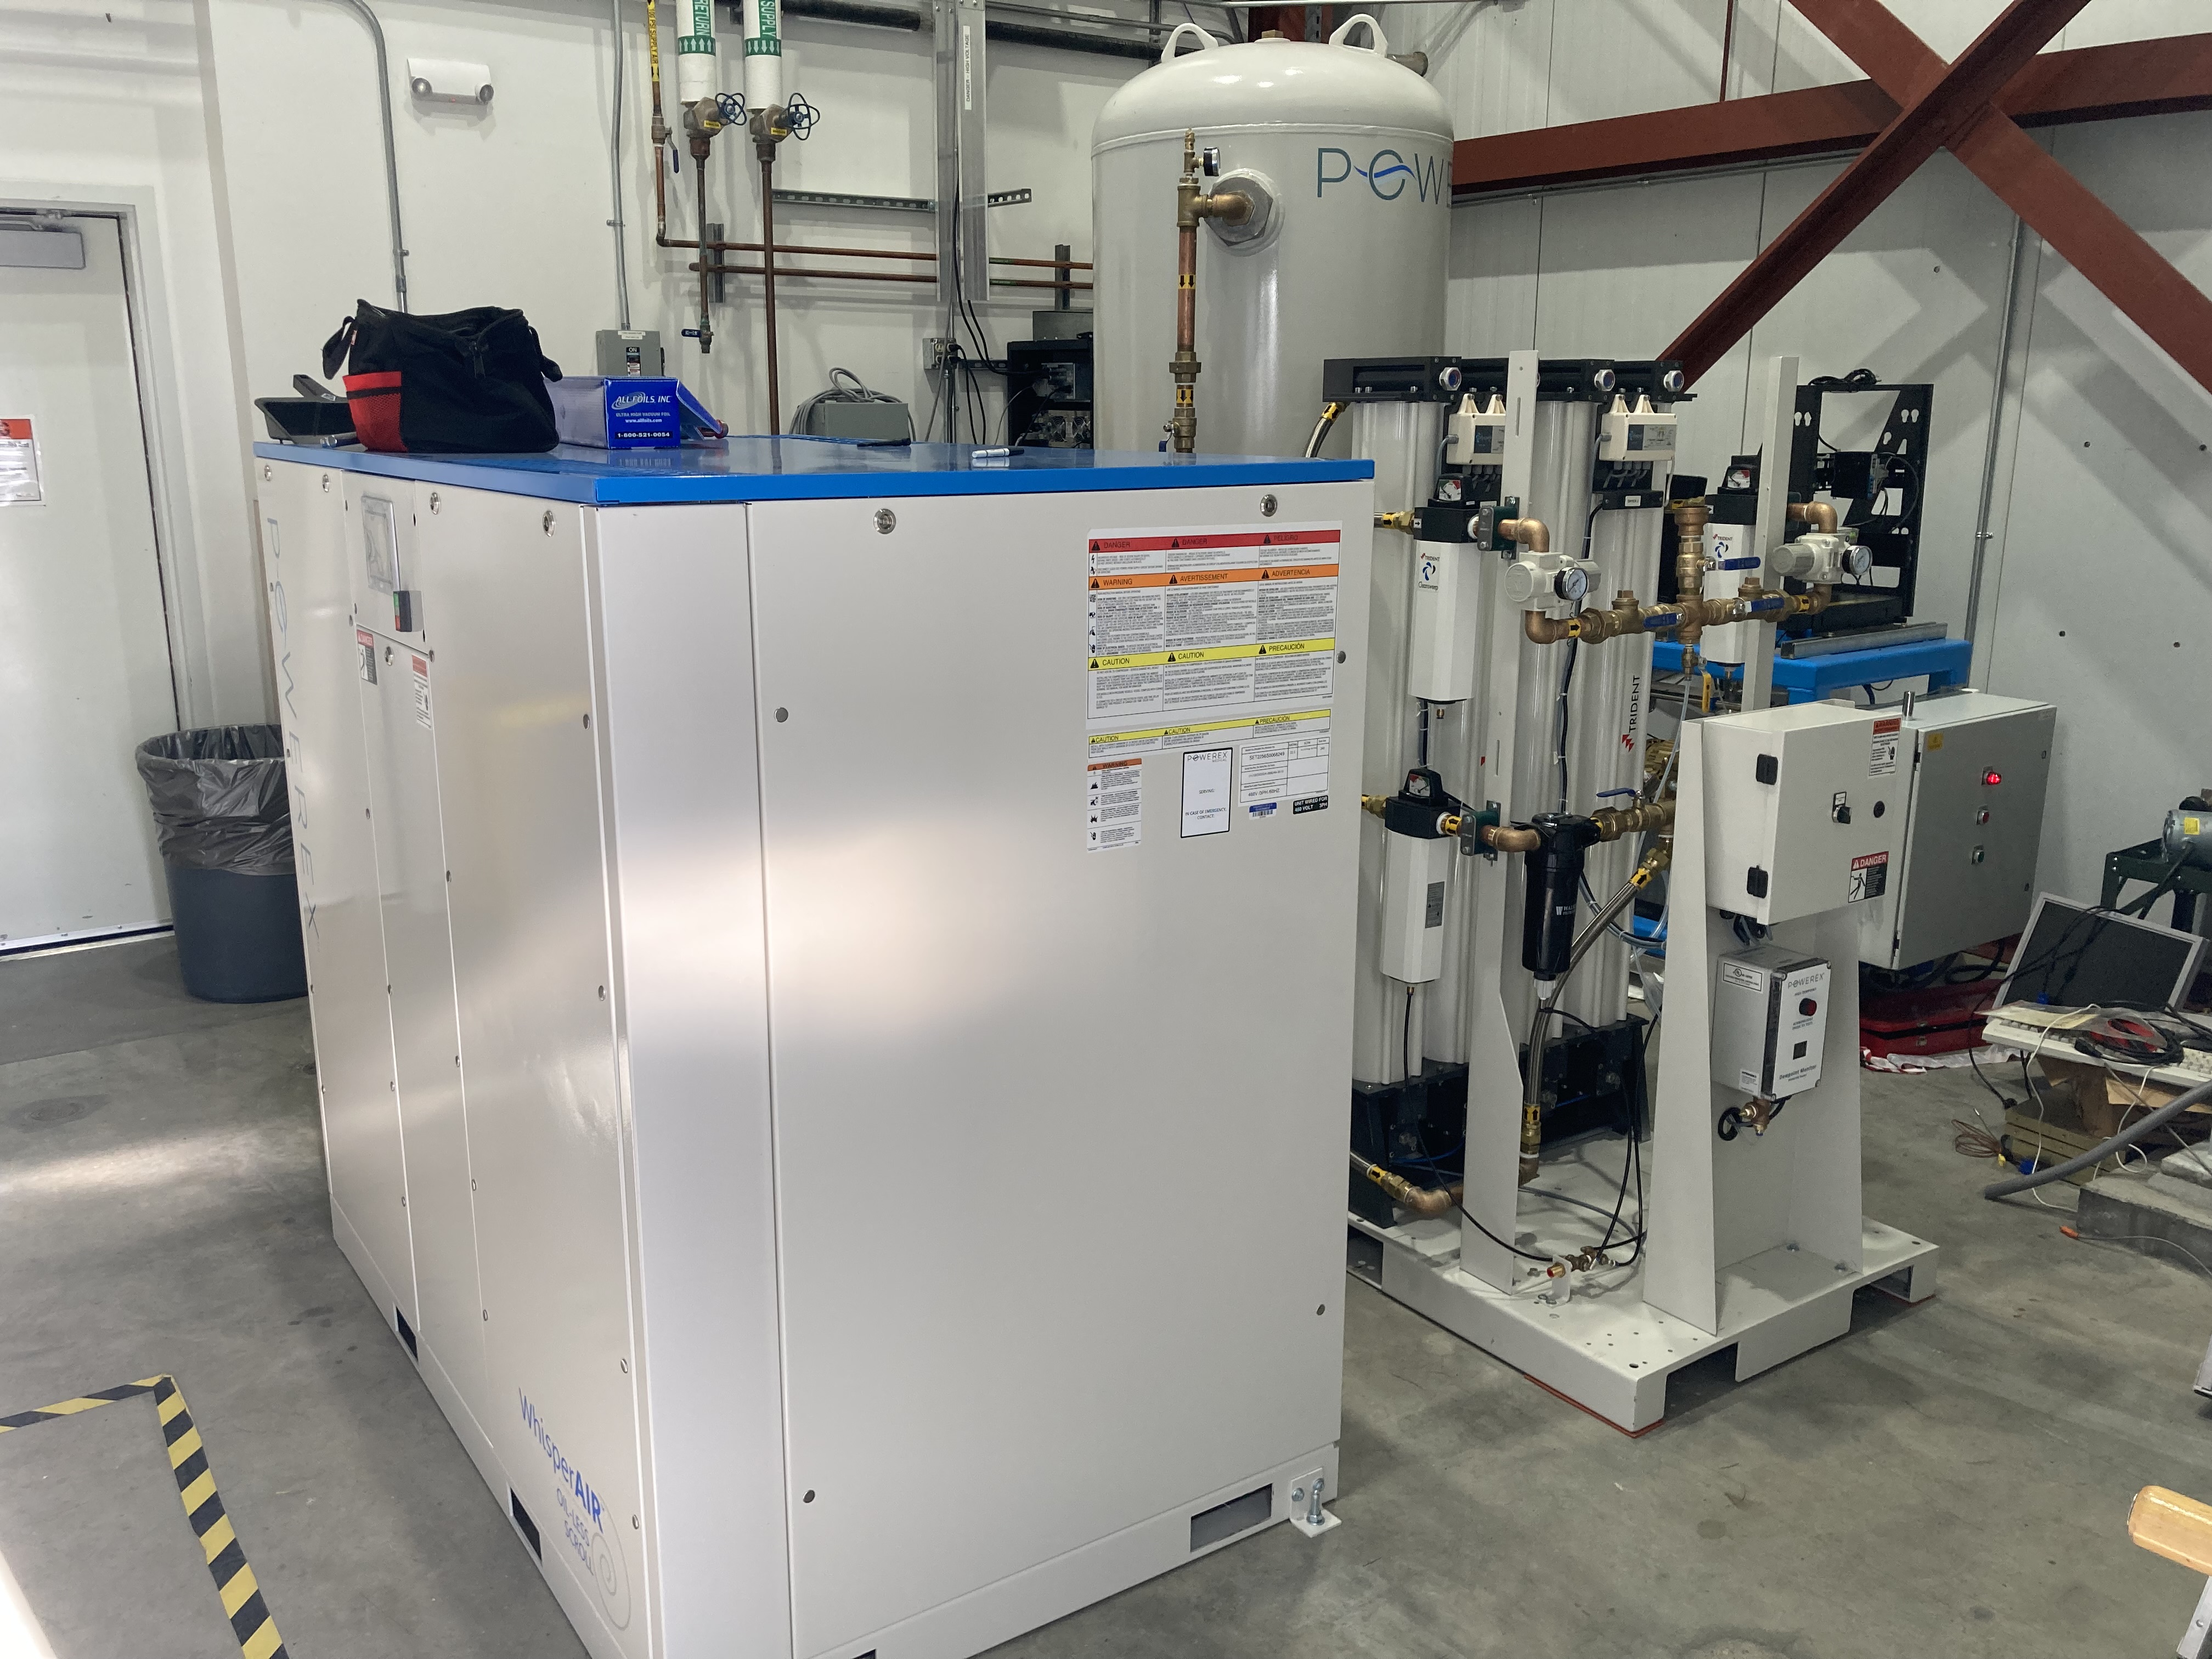
EY compressor installation progress
At the EY station the compressor is being replaced - after the one at EX is done. In this aLog, in the comments, the progress of this operation is tracked continuously, until the 1st startup by the supplier, Rogers Machinery.
Another important consideration here, is that the purge line at EY needs to be replaced (based on an FTIR test - see DCC LIGO-E2300222-v2. As it can be seen, the level of contamination reaches even the 10 ug/cm2 value). This operation will be done after the April-May vent, so the EY station will be ready to be vented after O4.

02-25 (maintenance Tuesday): the old compressor was pulled out (it is temporarily stored in the EY receiving area). The beginning of the purge and TMDS lines with the associated brackets and unistruts were taken off. The new compressor unit and dryer skid were anchored in the mechanical room. Here it is important to mention that the orientation of the inlet was brought closer to the purge line inlet into the VEA, so the overall length of the associated circulation lines will be much shorter.
Next is the electrical and pneumatic installation, which will be completed in the next 1-2 weeks.
Images attached to this report
Comments related to this report
travis.sadecki@LIGO.ORG - 12:16, Tuesday 11 March 2025 (83304)

The filter tree was installed and supports anchored to the slab.  Ken also reports that electrical installation is complete.  Connection to the purge air header is awaiting CF fittings from the supplier.  However, startup testing can continue prior to header connection.  

janos.csizmazia@LIGO.ORG - 16:15, Friday 21 March 2025 (83492)
The 1st startup of the compressor was carried out by Rogers Machinery on March 18th, during maintenance hours.
Displaying reports 8021-8040 of 89121.Go to page Start 398 399 400 401 402 403 404 405 406 End