K. Izumi, J. Kissel, P. Thomas, C. Vorvick
The H1 IMC is back to stable, many-minute lock stretches with good alignment, with all LSC and ASCIMC loops running as designed (using all three stages of MC2 for length control), and the HAM2 and HAM3 isolation systems performing at their best thus far (HPIs floating with alignment offsets, ISIs at Level 3, and SUS with old Level 1.5 damping loops). It was a long battle because many things were wrong with ISC/IOO side of things, but Kiwamu and I think we've managed to put the whole picture together, which is outlined below. Note, that this covers some of the material found in Cheryl's earlier entry, so see LHO aLOG 7229 when referenced. The PSL is still in commissioning mode -- we know that's what's causing the high-frequency intensity noise (as seen on the MC REFL camera), and may also be the cause of the occasional lock losses. The simple (non-guardian) MClockwatch auto-locker is currently running on opsws5.
-----
The Problems
-----
(Here's what we've fixed:)
- The power outtage from this past Thursday (LHO aLOG 7646) look down all front ends, but -- most important to this story -- the imcasc frontend. This frontend controls the Periscope PZTs that steer the IFO beam from the PSL into the IMC. These PZTs are known to have terrible hysteresis, such that even if you burt restore their alignment settings to a known good time, you're not guaranteed that the same alignment returns. This is what happened here.
- Slowly, over the course of days, the alignment of the mode cleaner appeared to decay. This was because the MCWFS loops (in particualr DOF 3 which uses those same PZTs as actuators to control the input beam pointing) were slowly steering the input beam to a bad place. Eventually, the PZTs had been steered so much -- and the mode cleaner's integrators followed enough -- that light fell off MCWFSA and B. This meant that any attempts WFS control would fail. Also, or perhaps more probably, the MC WFS alignment offsets had been offloaded a few times, but offloaded with worse and worse alignments.
- Until this afternoon (as Cheryl mentions in 7229), we had forgotten to restore the H1 LSC front end epics. The LSC front end contains not only the H1:IMC-L filter bank and the H1:LSC-MC filter bank, but also the LSC-MC_FM_TRIG_THRESH channels which define the point at which to turn off a 3[Hz] low pass in FM10 of the H1:LSC-MC filter bank. These thresholds *had* been set to zero, so this extra low-pass filter (designed to let the IMC swing through a few fringes/FSRs before locking, so it doesn't lock on a non-00 mode) remained in the length path, distorting the frequency-dependence of the loop gain, and therefore causing the loop to go unstable.
- (Our best guess), In one of the MC WFS scripts that was mistakenly run (see 7229), the ASC IMC loops were turned off in a hidden place -- the input to actuator output filters (e.g. H1:IMC-MC1_PIT_INPUT, H1:IMC-MC3_YAW_INPUT, etc) which are not shown on the overview screen. We created a successful work-around for a while, but discovered this at the very last minute (see solutions story below).
- The screens for the MC WFS output matrices were full of copy-and-paste errors, such that both PITCH and YAW screens were labeled as "PITCH," and even some calls to matrix elements from PITCH were found in the YAW matrix.
(The following is still wrong/broken/incorrect, but doesn't seem to matter:)
- The PSL is in commissioning mode, with HEPA fans still blowing around and room lights on inside the enclosure. Not Tragic.
- The PZTs that control the beam-steering onto MCWFSA and MCWFS B are non-functional. We did all of the WFS centering by going into IOT2 and manually tweaking the knobs of the mirrors. Kiwamu says that Shiela was in the middle of debugging this, which we (Kiwamu and I) think is a problem with the Beckhoff computer. Thankfully we can still operate the knobs manually.
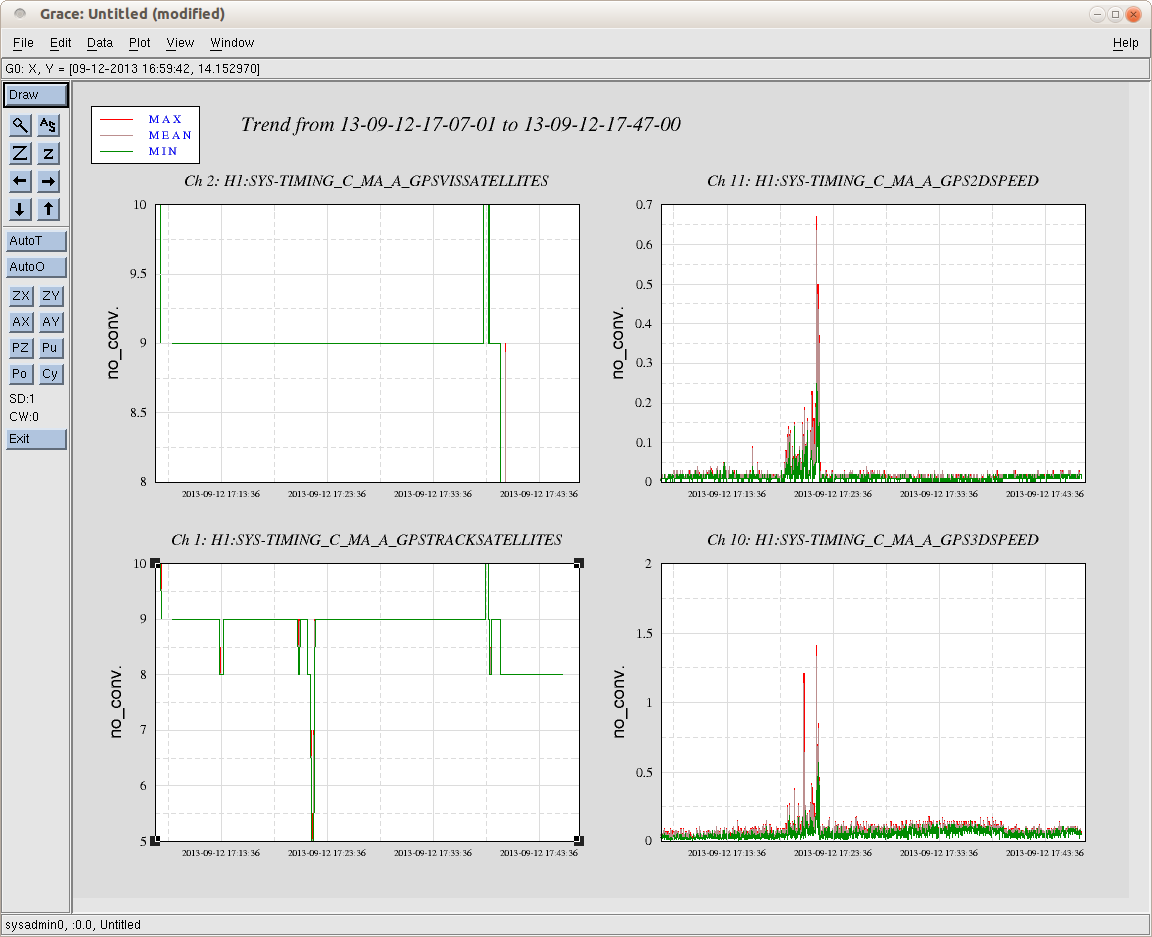
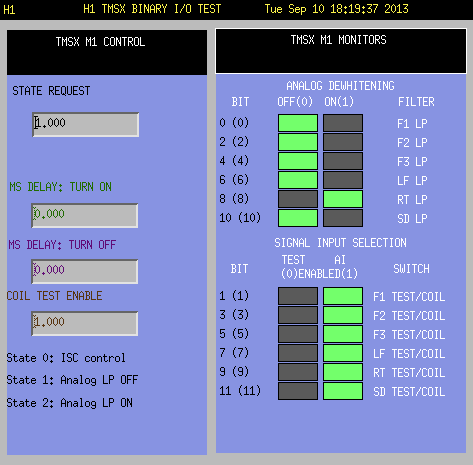
- The MC2 TRANS QPD's analog whitening filters are somehow busted -- when engaged the TRANS signal goes negative. Yuck. Strangely enough, the only stable configuration we've found with all analog filters OFF, but ONE of the digital compensation filters ON, as though the IMC WFS DOF3 loop was designed with this configuration. Double Yuck.
(The following definitely doesn't matter, but are things I noticed along the way that NEED to be fixed to improve the interoperability SEI/SUS systems)
- The SEI/SUS IOP Watchdog blocks the output to HEPI, but DOES NOT trip it's internal watchdog system. Hence, when you reset the IOP watchdog all output remains (which is currently only actuator basis alignment offsets; isolation loops are not-yet-commissioned), and you send a jolt to the chamber. Thankfully, the alignment offsets were small this time.
- The HAM-ISI checker script is still not yet functional. So in order to reset the HAM-ISI watchdogs, you MUST use the "turn off isolation loops for HAM(2/3)" script to ramp down the other-wise-huge output of the isolation filters. If not, the watchdog will just happily keep cycling through the states, laughing at you, and calling you silly for trying to reset the watchdog when the output request is 532 billion.
- I'm not sure how the ISI's blinky performance matrix was copied the to IMC OVERVIEW screen, but its matrix elements' color schemes DO NOT match up what's in the top middle of the HAM-ISI OVERVIEW SCREEN. What's worse (who cares about the color scheme), is that the matrix elements BLINK DIFFERENTLY. What appears to be a completely happy, stable, meeting-or-beating-requirements matrix on the ISI screen, looks like a constantly fluctuating ISI (flashing BLUES and PURPLES) on the IMC OVERVIEW screen. I've checked, and the matrices are looking at the exact same channels, but it seems as through whomever copied them over to the IMC screen CHANGED THE THRESHOLDS on the MEDM screen or something. I haven't looked at in any more detail.
----------
The Solutions
----------
(Note, during entire problem solving stage, MClockwatch was running in the background, grabbing the length lock whenever it could.)
- Now stuck with a new alignment of the input beam from the PSL because of the hysteric (intentional typo) periscope PZTs, Cheryl, re-aligned the MC1, MC2, and MC3 suspensions to maximize MC_REFL (as mentioned in 7229). The new alignments are
P Y [urad]
MC1 +314 -984
MC2 +428 +251
MC3 +237 -1079
- Kiwamu found the bug with the with MC TRIGGER thresholds, and restored them to a reasonable value:
H1:LSC-MC_FM_TRIG_THRESH_ON = 1000
H1:LSC-MC_FM_TRIG_THRESH_OFF = 900
- Kiwamu also fixed the MC WFS output matrix MEDM screen bugs.
- Kiwamu and I manually re-centered the MC WFS to at least get the beam back onto their PDs.
- Kiwamu started up the MC WFS loops' DOF 1 and DOF 2 (which use the MC Suspensions to align the IMC waist). Now with light on the MC WFS, the loops were completely stable as normal.
- Kiwamu tweaked the input beam alignment by (digitally) adjusting the PSL Periscope PZTs, using the P & Y signals on the MC2 TRANS QPD as the figure of merit. He made sure to do this slowly enough that the MCWFS DOFs 1&2 could follow and pull along.
- Kiwamu tried to turn on DOF 3, but found it pulling the IMC out of alignment, eventually to break its lock. A discussion of the output matrix led him to zero out the DOF 3 contributions to MC Suspensions, and leave it only actuated by the PSL Periscope PZTs. In this configuration, with all three DOFs closed, we were able to get nice long lock stretches.
- Kiwamu offloaded, or "relieved" the DC offsets in the MCWFS loops' error points into offset field of the MCWFS DOF actuator output filters (e.g. H1:IMC-MC1_PIT_OFFSET, H1:IMC-PZT_YAW_OFFSET, etc.), using
${userapps}/ioo/h1/scripts/imc/mcwfsrelieve
(At this point, the mode cleaner is at the ideal locking alignment)
- Kiwamu went out and re-centered the MC WFS to this newly-ideal alignment (with all IMC L and ASC loops running), but while out there, he noticed the input to both MCWFS PZT actuator output filters (H1:IMC-PZT_PIT_INPUT, H1:IMC-PZT_YAW_INPUT) were OFF. Our best guess is that one of the defunct scripts that was run earlier turned them off. This explained why DOF 3 was going unstable with the nominal output matrices -- the DOF 3 was trying to actuate on the PSL Periscope PZTs, but was only getting action from the MC SUS's.
- Finally, Kiwamu turned ON these inputs, and restored the output matrices, and declared victory.
*phew* Can anyone say "Configuration Control Nightmare?" I sure can.