brett.shapiro@LIGO.ORG - posted 21:02, Wednesday 24 July 2013 - last comment - 20:36, Saturday 27 July 2013(7214)
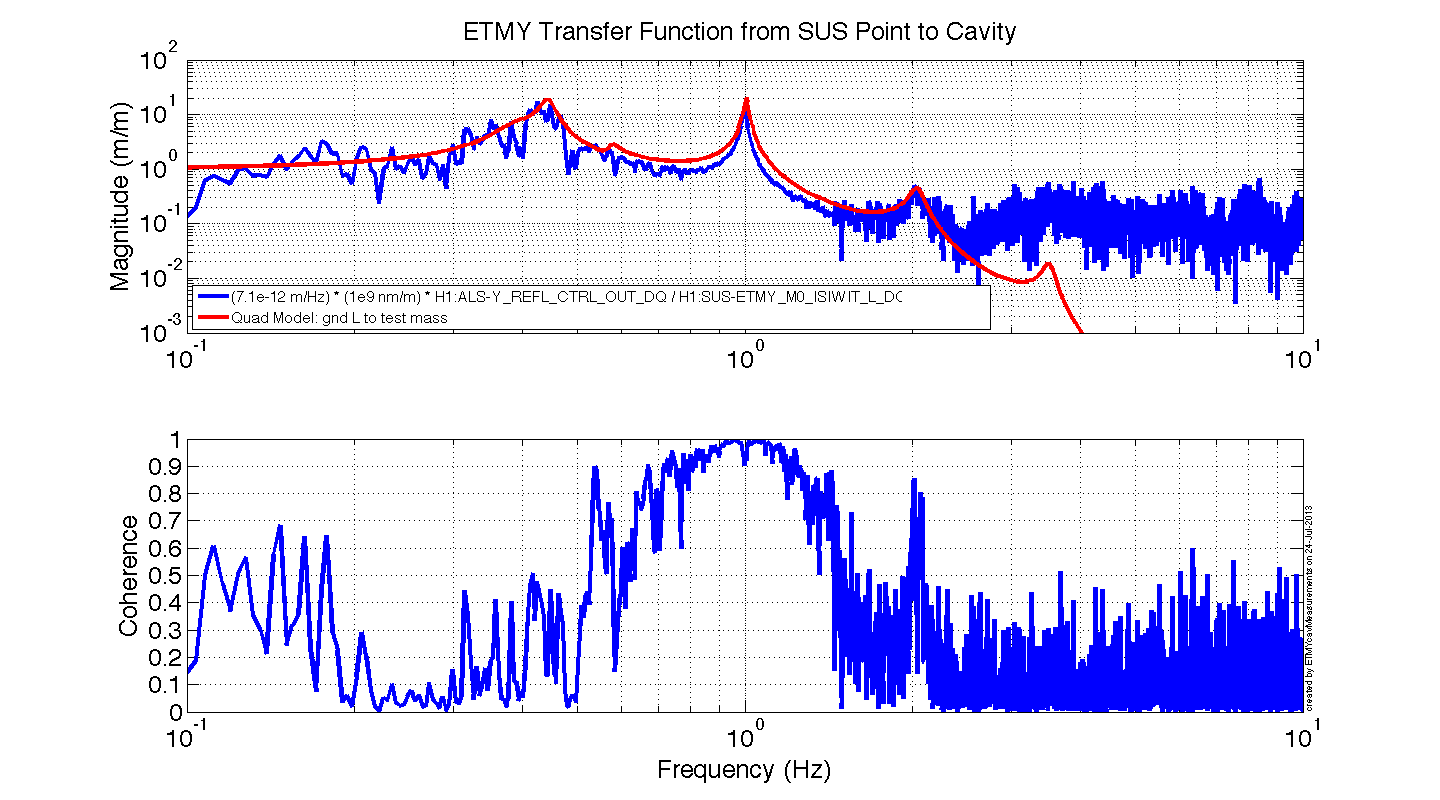
ETMY long ISI WIT to cavity measurement agrees with quad model within a factor of 1.5
The attached plot shows a measurement of the ETMY from the ISI L witness sensor to the cavity displacement against the quad model from the suspension gnd L input to the test mass L output. Overall there is good agreement except for the factor of about 1.5 between the model and measurement (the model is greater).

relevant details:

The quad model is the MATLAB struct variable susModel in
/ligo/svncommon/SusSVN/sus/trunk/QUAD/Common/FilterDesign/MatFiles/dampingfilters_QUAD_2013-06-14_Level2p1_RealSeismic_model.mat

The data was collected starting at GPS time 1058680016 based on Jeff Kissel's log 7194. This time was set to be some arbitrary short time after Jeff's recorded time of when the cavity was set at GPS time 1058670016. The state of the IFO at this time is given by that log, 7194, though the state of the ISI isolation at that time is questionable based on the ASDs and trend data of that time.

The measured transfer function comes from the DTT export file:
/ligo/svncommon/SusSVN/sus/trunk/QUAD/H1/ETMY/Common/Data/2013-07-23_CavityTFMeasurements_TF
There is a corresponding coherence file
/ligo/svncommon/SusSVN/sus/trunk/QUAD/H1/ETMY/Common/Data/2013-07-23_CavityTFMeasurements_Coh
These files are exported from the DTT file
/ligo/svncommon/SusSVN/sus/trunk/QUAD/H1/ETMY/Common/Data/2013-07-23_CavityTFMeasurements.xml
This TF and coherence data was exported in the following order:

1.  H1:SUS-ETMY_M0_ISIWIT_L_DQ to H1:ALS-Y_REFL_CTRL_OUT_DQ
2.  H1:SUS-ETMY_M0_ISIWIT_L_DQ to H1:SUS-ETMY_L3_OPLEV_PIT_OUT_DQ
3.  H1:SUS-ETMY_M0_ISIWIT_L_DQ to H1:SUS-ETMY_L3_OPLEV_YAW_OUT_DQ
4.  H1:SUS-ETMY_M0_ISIWIT_T_DQ to H1:ALS-Y_REFL_CTRL_OUT_DQ
5.  H1:SUS-ETMY_M0_ISIWIT_T_DQ to H1:SUS-ETMY_L3_OPLEV_PIT_OUT_DQ
6.  H1:SUS-ETMY_M0_ISIWIT_T_DQ to H1:SUS-ETMY_L3_OPLEV_YAW_OUT_DQ
7.  H1:SUS-ETMY_M0_ISIWIT_V_DQ to H1:ALS-Y_REFL_CTRL_OUT_DQ
8.  H1:SUS-ETMY_M0_ISIWIT_V_DQ to H1:SUS-ETMY_L3_OPLEV_PIT_OUT_DQ
9.  H1:SUS-ETMY_M0_ISIWIT_V_DQ to H1:SUS-ETMY_L3_OPLEV_YAW_OUT_DQ
10. H1:SUS-ETMY_M0_ISIWIT_R_DQ to H1:ALS-Y_REFL_CTRL_OUT_DQ
11. H1:SUS-ETMY_M0_ISIWIT_R_DQ to H1:SUS-ETMY_L3_OPLEV_PIT_OUT_DQ
12. H1:SUS-ETMY_M0_ISIWIT_R_DQ to H1:SUS-ETMY_L3_OPLEV_YAW_OUT_DQ
13. H1:SUS-ETMY_M0_ISIWIT_P_DQ to H1:ALS-Y_REFL_CTRL_OUT_DQ
14. H1:SUS-ETMY_M0_ISIWIT_P_DQ to H1:SUS-ETMY_L3_OPLEV_PIT_OUT_DQ
15. H1:SUS-ETMY_M0_ISIWIT_P_DQ to H1:SUS-ETMY_L3_OPLEV_YAW_OUT_DQ
16. H1:SUS-ETMY_M0_ISIWIT_Y_DQ to H1:ALS-Y_REFL_CTRL_OUT_DQ
17. H1:SUS-ETMY_M0_ISIWIT_Y_DQ to H1:SUS-ETMY_L3_OPLEV_PIT_OUT_DQ
18. H1:SUS-ETMY_M0_ISIWIT_Y_DQ to H1:SUS-ETMY_L3_OPLEV_YAW_OUT_DQ
19. H1:SUS-ITMY_M0_ISIWIT_L_DQ to H1:ALS-Y_REFL_CTRL_OUT_DQ
20. H1:SUS-ITMY_M0_ISIWIT_L_DQ to H1:SUS-ITMY_L3_OPLEV_PIT_OUT_DQ
21. H1:SUS-ITMY_M0_ISIWIT_L_DQ to H1:SUS-ITMY_L3_OPLEV_YAW_OUT_DQ
22. H1:SUS-ITMY_M0_ISIWIT_T_DQ to H1:ALS-Y_REFL_CTRL_OUT_DQ
23. H1:SUS-ITMY_M0_ISIWIT_T_DQ to H1:SUS-ITMY_L3_OPLEV_PIT_OUT_DQ
24. H1:SUS-ITMY_M0_ISIWIT_T_DQ to H1:SUS-ITMY_L3_OPLEV_YAW_OUT_DQ
25. H1:SUS-ITMY_M0_ISIWIT_V_DQ to H1:ALS-Y_REFL_CTRL_OUT_DQ
26. H1:SUS-ITMY_M0_ISIWIT_V_DQ to H1:SUS-ITMY_L3_OPLEV_PIT_OUT_DQ
27. H1:SUS-ITMY_M0_ISIWIT_V_DQ to H1:SUS-ITMY_L3_OPLEV_YAW_OUT_DQ
28. H1:SUS-ITMY_M0_ISIWIT_R_DQ to H1:ALS-Y_REFL_CTRL_OUT_DQ
29. H1:SUS-ITMY_M0_ISIWIT_R_DQ to H1:SUS-ITMY_L3_OPLEV_PIT_OUT_DQ
30. H1:SUS-ITMY_M0_ISIWIT_R_DQ to H1:SUS-ITMY_L3_OPLEV_YAW_OUT_DQ
31. H1:SUS-ITMY_M0_ISIWIT_P_DQ to H1:ALS-Y_REFL_CTRL_OUT_DQ
32. H1:SUS-ITMY_M0_ISIWIT_P_DQ to H1:SUS-ITMY_L3_OPLEV_PIT_OUT_DQ
33. H1:SUS-ITMY_M0_ISIWIT_P_DQ to H1:SUS-ITMY_L3_OPLEV_YAW_OUT_DQ
34. H1:SUS-ITMY_M0_ISIWIT_Y_DQ to H1:ALS-Y_REFL_CTRL_OUT_DQ
35. H1:SUS-ITMY_M0_ISIWIT_Y_DQ to H1:SUS-ITMY_L3_OPLEV_PIT_OUT_DQ
36. H1:SUS-ITMY_M0_ISIWIT_Y_DQ to H1:SUS-ITMY_L3_OPLEV_YAW_OUT_DQ

Note, the cavity signal H1:ALS-Y_REFL_CTRL_OUT_DQ is calibrated in Hz. The ISI witness signals are calibrated in nm. The calibration of the optical levers is unknown.

The measured transfer function was scaled by multiplying it by
7.0982e-12 [m/Hz] / 1e-9 [nm/m] = 0.0070982 [m^2 / (nm Hz)]
The 7.0982e-12 [m/Hz]  comes from
lambda*L/c
where lambda = (1064e-9 / 2) [m], for the green light wavelength
L = 4000 [m], for the arm length
c = 299792458 [m/s], for the speed of light
Images attached to this report
Comments related to this report
Brett and Jeff

Summary:

I have managed to account for the missing 1.5 factor by adding in the pitch to cavity transfer functions. See the first attached figure. The black curve is the model of the SUS point longitudinal to cavity. The red curve is the same measurement of the SUS point witness sensor (H1:SUS-ETMY_M0_ISIWIT_L_DQ) to cavity (H1:ALS-Y_REFL_CTRL_OUT_DQ) transfer function measured in log 7214. Thus, the same factor of 1.5 exists between these curves. It turns out that the cavity also has a lot of coherence in the same frequency band from the SUS point pitch witness sensor (H1:SUS-ETMY_M0_ISIWIT_P_DQ). So, I followed the assumption that I could account for the missing factor by simply measuring the pitch to cavity transfer function, converting it to length coordinates, and adding it to the longitudinal transfer function. The blue curve is this transfer function converted to length units. The conversion from rotation to length units was done using the measured transfer function from the pitch SUS point witness to the length SUS point witness. The magenta curve is the coherent sum of the two transfer functions. This magenta transfer function agrees much better with the model.


Details:

What I hadn't taken into account before is that the measured transfer functions between the ISI and cavity are passive. Thus, there are 6 simultaneous excitations influencing the cavity through ETMY which are the 6 DOFs of STG2 of the ETMY ISI. It turns out that 2 of these excitations are coherent to the cavity as well as themselves. The two are the ISI pitch witness and the ISI longitudinal witness. The argument justifying/explaining why one must sum the pitch and long witness to cavity transfer functions in order to agree with the modeled SUS point long to cavity transfer function is intended to be explained in detail in a future document. It will be summarized briefly here.

Since the witness long and pitch TFs have good coherence in a band around 1 Hz, (where the measurement needed help matching the model), the long and pitch displacement can be thought of as transformed versions of the same noise. Fundamentally, the noise must be thought of together as a single long-pitch source (analogous to how SUS long and pitch modes are really long-pitch modes), rather than thinking of them separately. The relation projecting the long-pitch seismic motion into long and pitch components is determined by the coherent transfer function between long and pitch.

To get the right measurement to match the model, we must find the transfer function between the long-pitch seismic source and the cavity signal. Since none of our measurements directly measure this long-pitch source, we must effectively recreate is with the measured transfer functions from its components. Those transfer function components are then summed coherently as described in the summary above and in the attached plot.
Non-image files attached to this comment

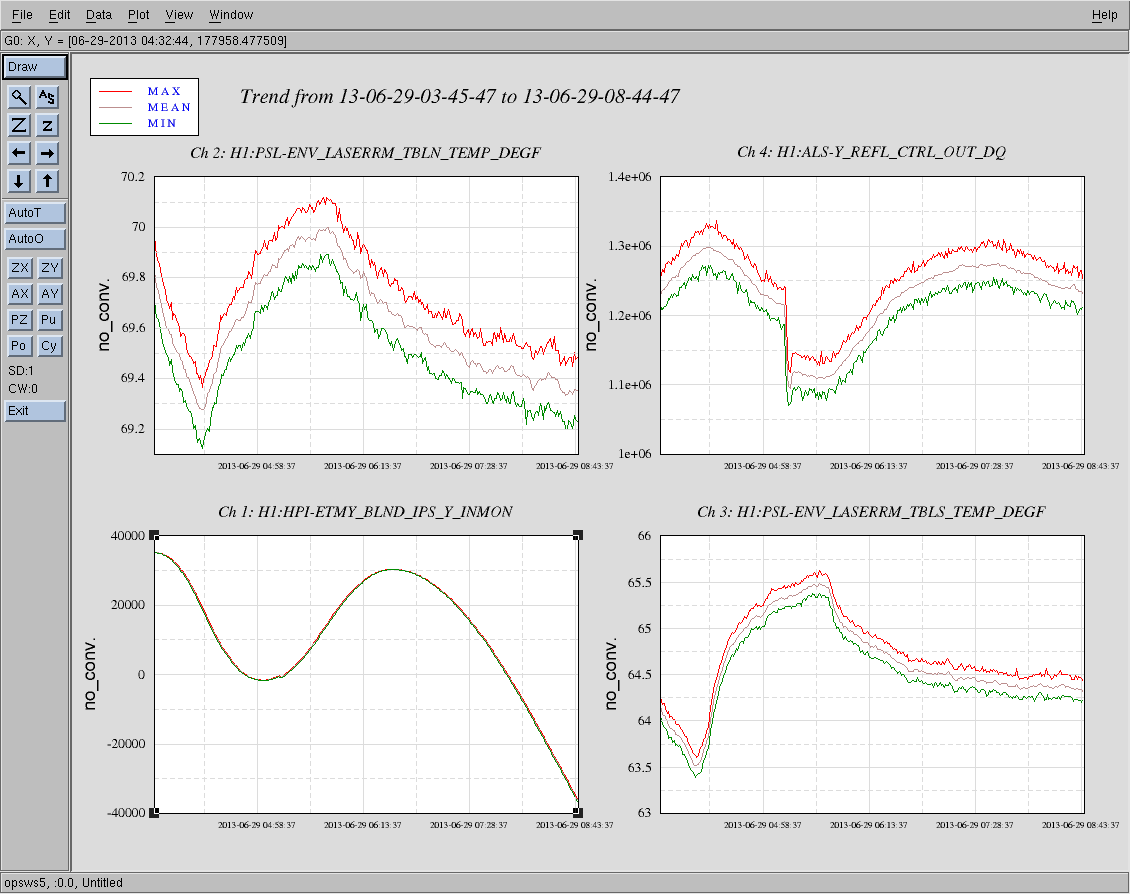
It seems that during these measurements, the ETMY ISI was indeed only damped while the ITMY ISI was isolated. This is evident given the large discrepancy in measured ISI WIT L and P ASDs between the two ISIs. See the attached figure.

This data is collected in the DTT file
/ligo/svncommon/SusSVN/sus/trunk/QUAD/H1/ETMY/Common/Data/2013-07-23_CavityASDMeasurements.xml
and exported in the file
/ligo/svncommon/SusSVN/sus/trunk/QUAD/H1/ETMY/Common/Data/2013-07-23_CavityASDMeasurements_Export

The exported data is exported in the following order:

1. H1:ALS-Y_REFL_CTRL_OUT_DQ
2.  H1:SUS-ETMY_M0_ISIWIT_L_DQ
3.  H1:SUS-ETMY_M0_ISIWIT_T_DQ
4.  H1:SUS-ETMY_M0_ISIWIT_V_DQ
5.  H1:SUS-ETMY_M0_ISIWIT_R_DQ
6.  H1:SUS-ETMY_M0_ISIWIT_P_DQ
7.  H1:SUS-ETMY_M0_ISIWIT_Y_DQ
8.  H1:SUS-ETMY_L3_OPLEV_PIT_OUT_DQ
9.  H1:SUS-ETMY_L3_OPLEV_YAW_OUT_DQ
10. H1:SUS-ETMY_MASTER_OUT_F1_DQ
11. H1:SUS-ETMY_MASTER_OUT_F2_DQ
12. H1:SUS-ETMY_MASTER_OUT_F3_DQ
13. H1:SUS-ETMY_MASTER_OUT_LF_DQ
14. H1:SUS-ETMY_MASTER_OUT_RT_DQ
15. H1:SUS-ETMY_MASTER_OUT_SD_DQ
16.   H1:SUS-ITMY_M0_ISIWIT_L_DQ
17.  H1:SUS-ITMY_M0_ISIWIT_T_DQ
18.   H1:SUS-ITMY_M0_ISIWIT_V_DQ
19.   H1:SUS-ITMY_M0_ISIWIT_R_DQ
20.   H1:SUS-ITMY_M0_ISIWIT_P_DQ
21.   H1:SUS-ITMY_M0_ISIWIT_Y_DQ
22.   H1:SUS-ITMY_L3_OPLEV_PIT_OUT_DQ
23.   H1:SUS-ITMY_L3_OPLEV_YAW_OUT_DQ
24. H1:SUS-ITMY_MASTER_OUT_F1_DQ
25. H1:SUS-ITMY_MASTER_OUT_F2_DQ
26. H1:SUS-ITMY_MASTER_OUT_F3_DQ
27. H1:SUS-ITMY_MASTER_OUT_LF_DQ
28. H1:SUS-ITMY_MASTER_OUT_RT_DQ
29. H1:SUS-ITMY_MASTER_OUT_SD_DQ

Note, the cavity signal H1:ALS-Y_REFL_CTRL_OUT_DQ is calibrated in Hz. The ISI witness signals are calibrated in nm. The calibration of the optical levers is unknown. The MASTER_OUTs calibration is also unknown to me.
The fist column of the exported data is the frequency vector. Each exported channel then follows in order, occupying the remaining columns. The transfer function export in 7214 above follows a similar pattern, except that each channel occupies two columns. The first is the real part of the transfer function data, the second is the complex part.
Non-image files attached to this comment
After doing some modeling in MATLAB, the analysis in 7236 stating that it is necessary to consider both the pitch and longitudinal seismic noise in the transfer function to the cavity looks to be incorrect. The transfer function between the longitudinal ISI witness sensor and the cavity motion should indeed replicate the quad MATLAB model transfer function between the suspension point and test mass L DOF. Thus, it appears there is a calibration error of 2 in measured transfer function.