[Chris and Kiwamu]
The ALS CARM loop was engaged for the first time by feeding the ALS common beatnote signal back to the MC length. It is very stable and the longest stretch lasted for about 20 min.
This time a frequency sensor was newly added in order to mitigate the phase-frequency readout issue in the original phase frequency discriminator. The new sensor worked and gave a reasonable signal which then allowed us a smooth hand-off of the IMC length actuation from the IMC-PSL loop to ALS common loop.
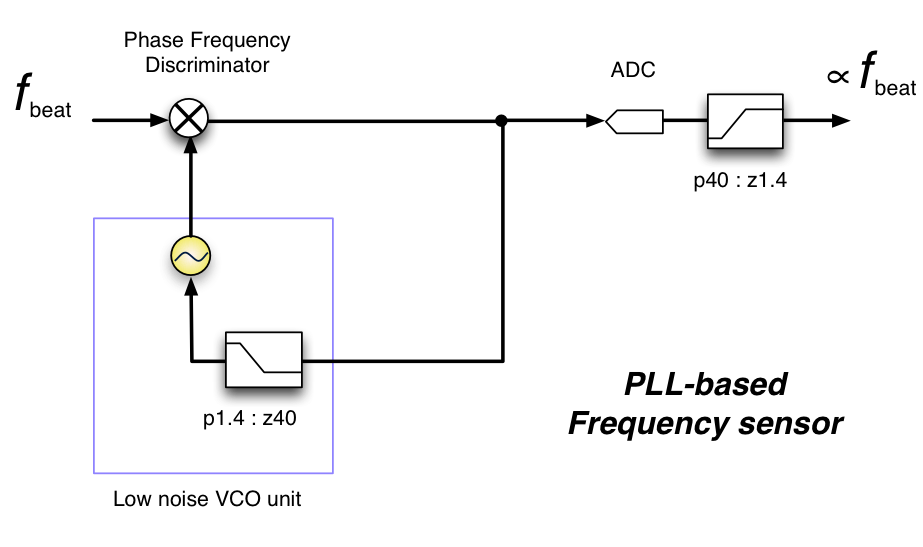
The frequency sensor:
We added a new sensor for reading out the common beatnote signal. A cartoon diagram is shown below. With this sensor we are able to stably readout the CARM error signal which is encoded in the beatnote frequency. Some background are explained in the following paragraph.
It seems the reason why we hadn't succeeded in locking the CARM loop was due to the too advanced phase-frequency discriminator --- the discriminator switches its detection mode from the frequency sensor to phase sensor mode automatically depending on how far the frequency of the beatnote and VOC are apart. Ideally we want the phase discriminator to be within the phase sensor mode to achieve a high signal to noise ratio, although this requires a precision control of either/both the beatnote or VCO frequency to make them close to each other. Since the beatnote fluctuates more than the phase sensor range, the discriminator becomes frequency sensor and phase sensor back and forth, resulting in a unwanted noise due to a huge readout gain difference between the phase and frequency modes. When we stick this signal into the IMC length path, it kicks the IMC so hard that it unlocks the loop easily. So we guessed that the phase-frequency mode hopping was the issue preventing us from a smooth CARM lock.
Calibration and some characterization of PLL :
All the measurement was done by using a Marconi as a frequency source.
-
df / dv = -14634 Hz / V
-
d (counts) / df = 0.21 counts / Hz (at H1:LSC-REFL_SERVO_IN1)
-
locking range (or capture range) = +/- 50 kHz
-
UGF = several 10 kHz ( just a guess, not measured)
The calibration coefficient df / d (counts) was put in the gain of H1:LSC-REFL_SERVO such that the signal is calibrated in Hz. A nice thing in this PLL is that even if the input frequency is out of the locking range, the phase frequency discriminator gives us a signal with a correct sign.
Funky SHG temperature control :
The SHG oven control was found to be off. So I turned it on. However engaging the temperature control didn't seem working properly --- probably the temperature sensor is not working correctly as the temperature readout doesn't change regardless of the TEC voltage. I quickly checked the cabling but no apparent issue was found. I decided to put a bias of 1.6 V in the TEC voltage so that the crystal is warmed up close to the optimum temperature of 35 degrees. This recovered the second harmonic power to approximately 100 uW from a couple of uW. Of coursed the temperature loop needs to be fixed soon.
Perhaps PSL frequency shifted :
After the PSL recovery (alog 6769) the PLL loop at the end station lost its beatnote. It is quite possible that the PSL frequency shifted so that it is locked to a neighboring resonance of the reference cavity since the PSL was in the process of reaching some sort of thermal equilibrium. I then went to the Y end station to adjust the temperature, which is generally not preferable. Anyway I ended up changing the laser crystal temperature from 31.33 to 31.83 degrees. This much of tuning brought the beatnote within the discriminators detection range and the PLL auto-locker started working.
Tuning of the end laser frequency :
I changed the frequency of the Marconi which drives the AOM in the fiber distribution box at the corner station. This was for bringing the green beatnote within the detectable range of the new frequency sensor. Originally the frequency was at 79.4 MHz and I changed it to be 78.9 MHz. As a result of the tuning the green beatnote became available within the ALS comm VCO range.
Handing off :
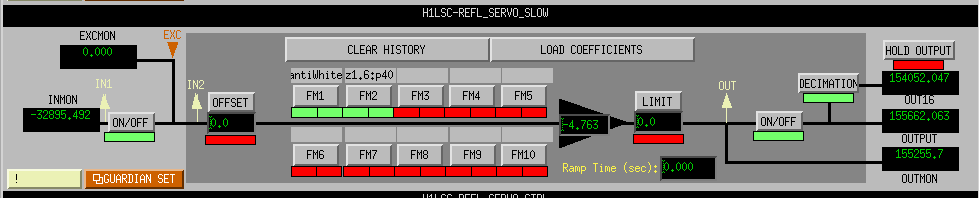
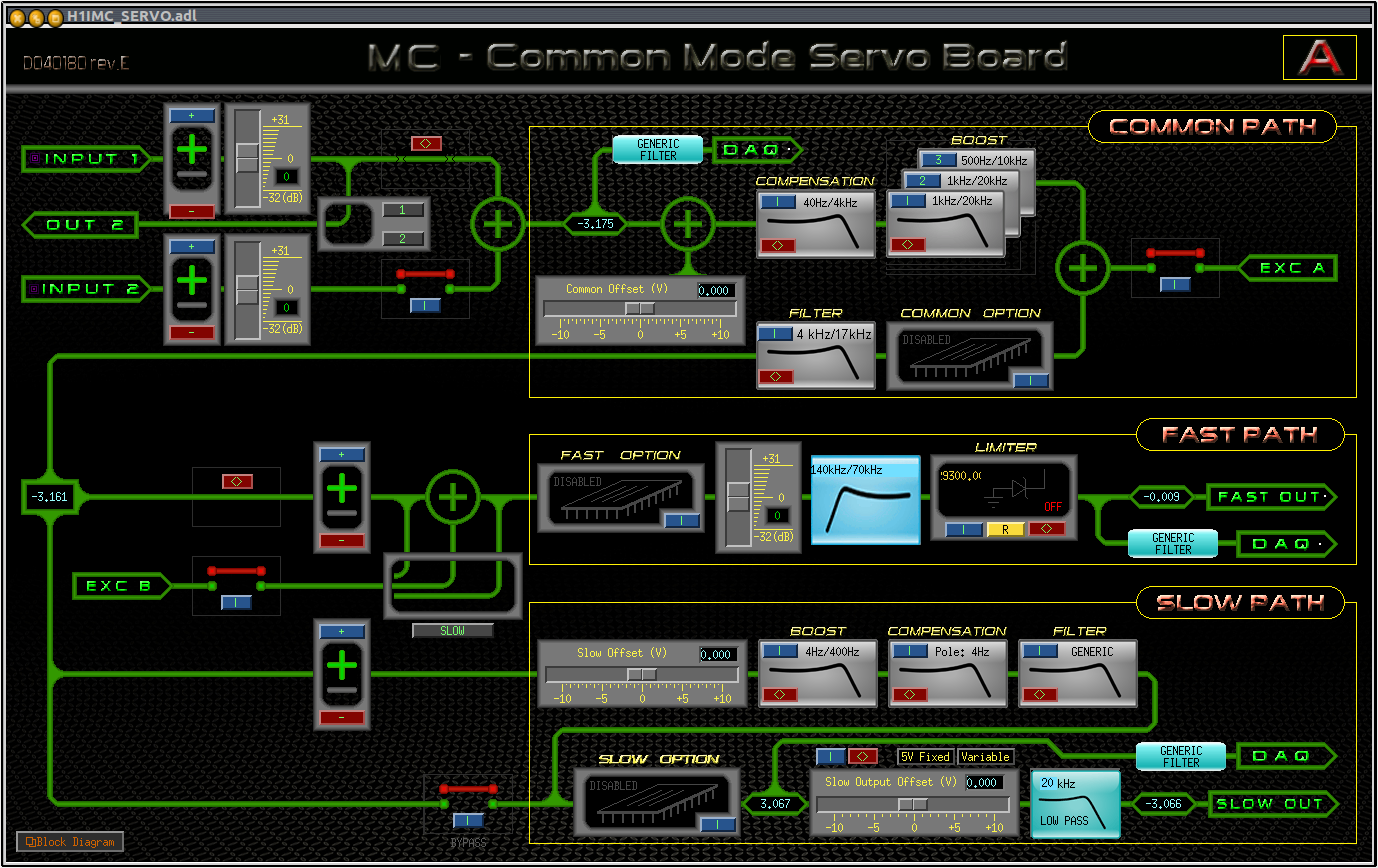
The screen shot below is the feedback paths of the MCL and CARM_MCL (namely LSC-MC and LSC-CARM respectively) which are mainly used during the hand-off process.
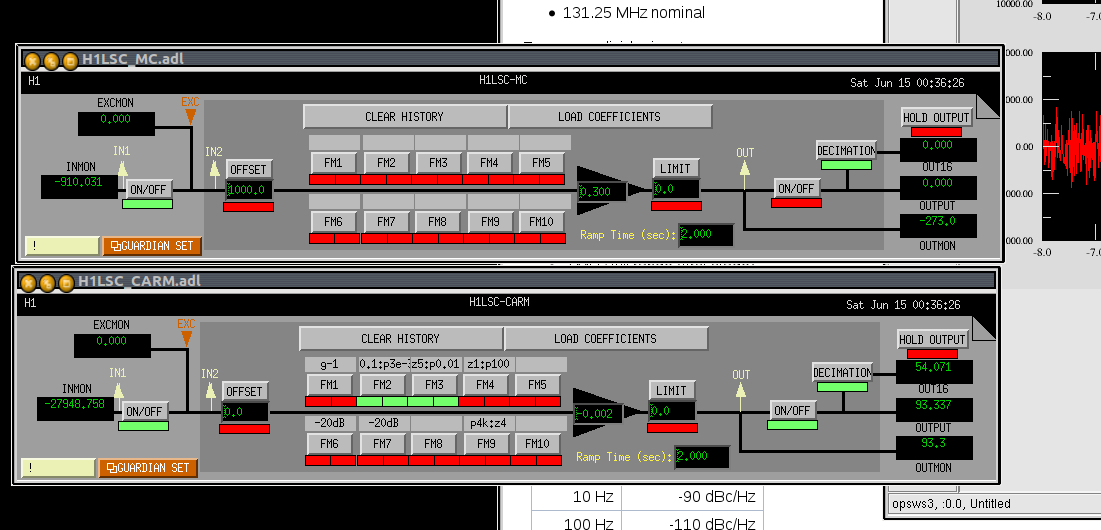
Here is what we exactly did to close the CARM loop :
-
Lock the PDH loop at the end station (done manually)
-
Lock the IMC (done by Chris's auto-locker script)
-
Dial the frequency of the ALS COMM VCO until the frequency sensor gets in the capture range (by hands but could be automated by ezcaservo or similar)
-
Start quieting down the CARM error signal by feeding the frequency sensor signal to MC2
-
An initial gain of -0.001 in H1:LSC-CARM_GAIN was found to be smooth. The gain ramp time can be something like 1-2 seconds.
-
Engage a boost filter (FM3 of H1:LSC-CARM) to further quiet down the CARM error
-
Increase the CARM gain to -0.002.
-
Be careful --- there can be an oscillation at 100 Hz if the gain exceeds -0.004
-
Fine-tune the ALS COMM VCO to get rid of some unwanted relative offset between the two loops
-
This is done by looking at the H1:LSC-MC_OUT. We adjusted the VCO frequency such that the H1:LSC-MC_OUT becomes close to zero. This ensures that the two loops are not competing each other.
-
Decrease the gain of the MC loop H1:LSC-MC_GAIN slowly to 0.3 which is nominally 1.0 for the IMC locking.
-
Switch off the MC loop H1:LSC-MC loop by disabling the output.
-
I think this doesn't have to be this type of sudden switch. It simply happened to be like this after several hours of trial.
-
Engage another boost (FM2 of H1:LSC-CARM) to make the CARM loop further stable
-
Done.
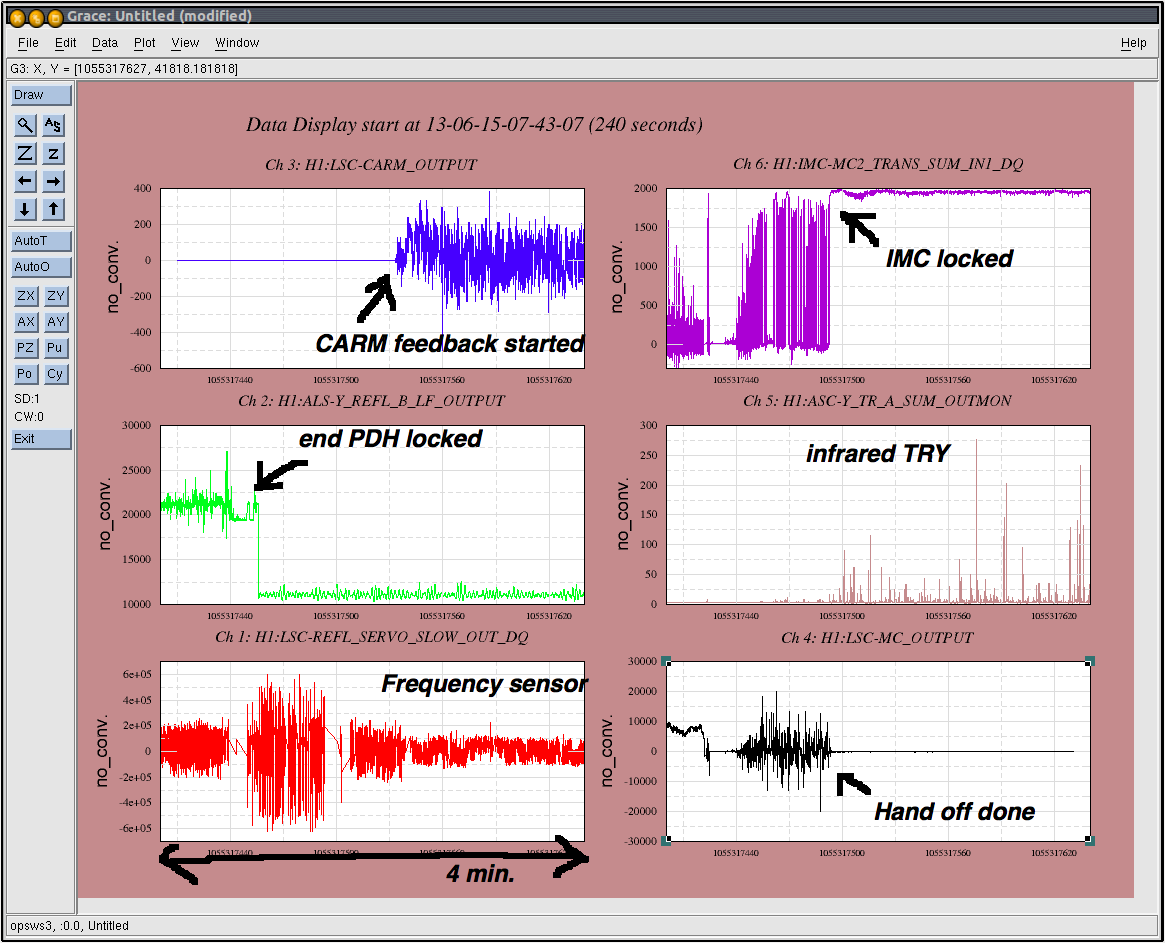
This handing process was found to be repeatable. The plot below is time series of the handing off.
Quick Assessments:
The resultant stability of the PSL frequency is still noisy and certainly noisier than the linewidth of the arm cavity ( ~ 83 Hz). In fact this is quite obvious in the middle right plot of the above time series where the infrared transmitted light of the Y arm (TRY) still passes through resonances even though the PSL frequency was stabilized. This is not surprising because we simply engaged the CARM control without any optimization of the noise performance. Plus the frequency sensor we are using is not something we originally planned to use. Plus, the fast control through the AOM additive offset is not yet introduced. These items must be addressed in the next week and hopefully we will have a much stable PSL light with respect to the arm cavity.
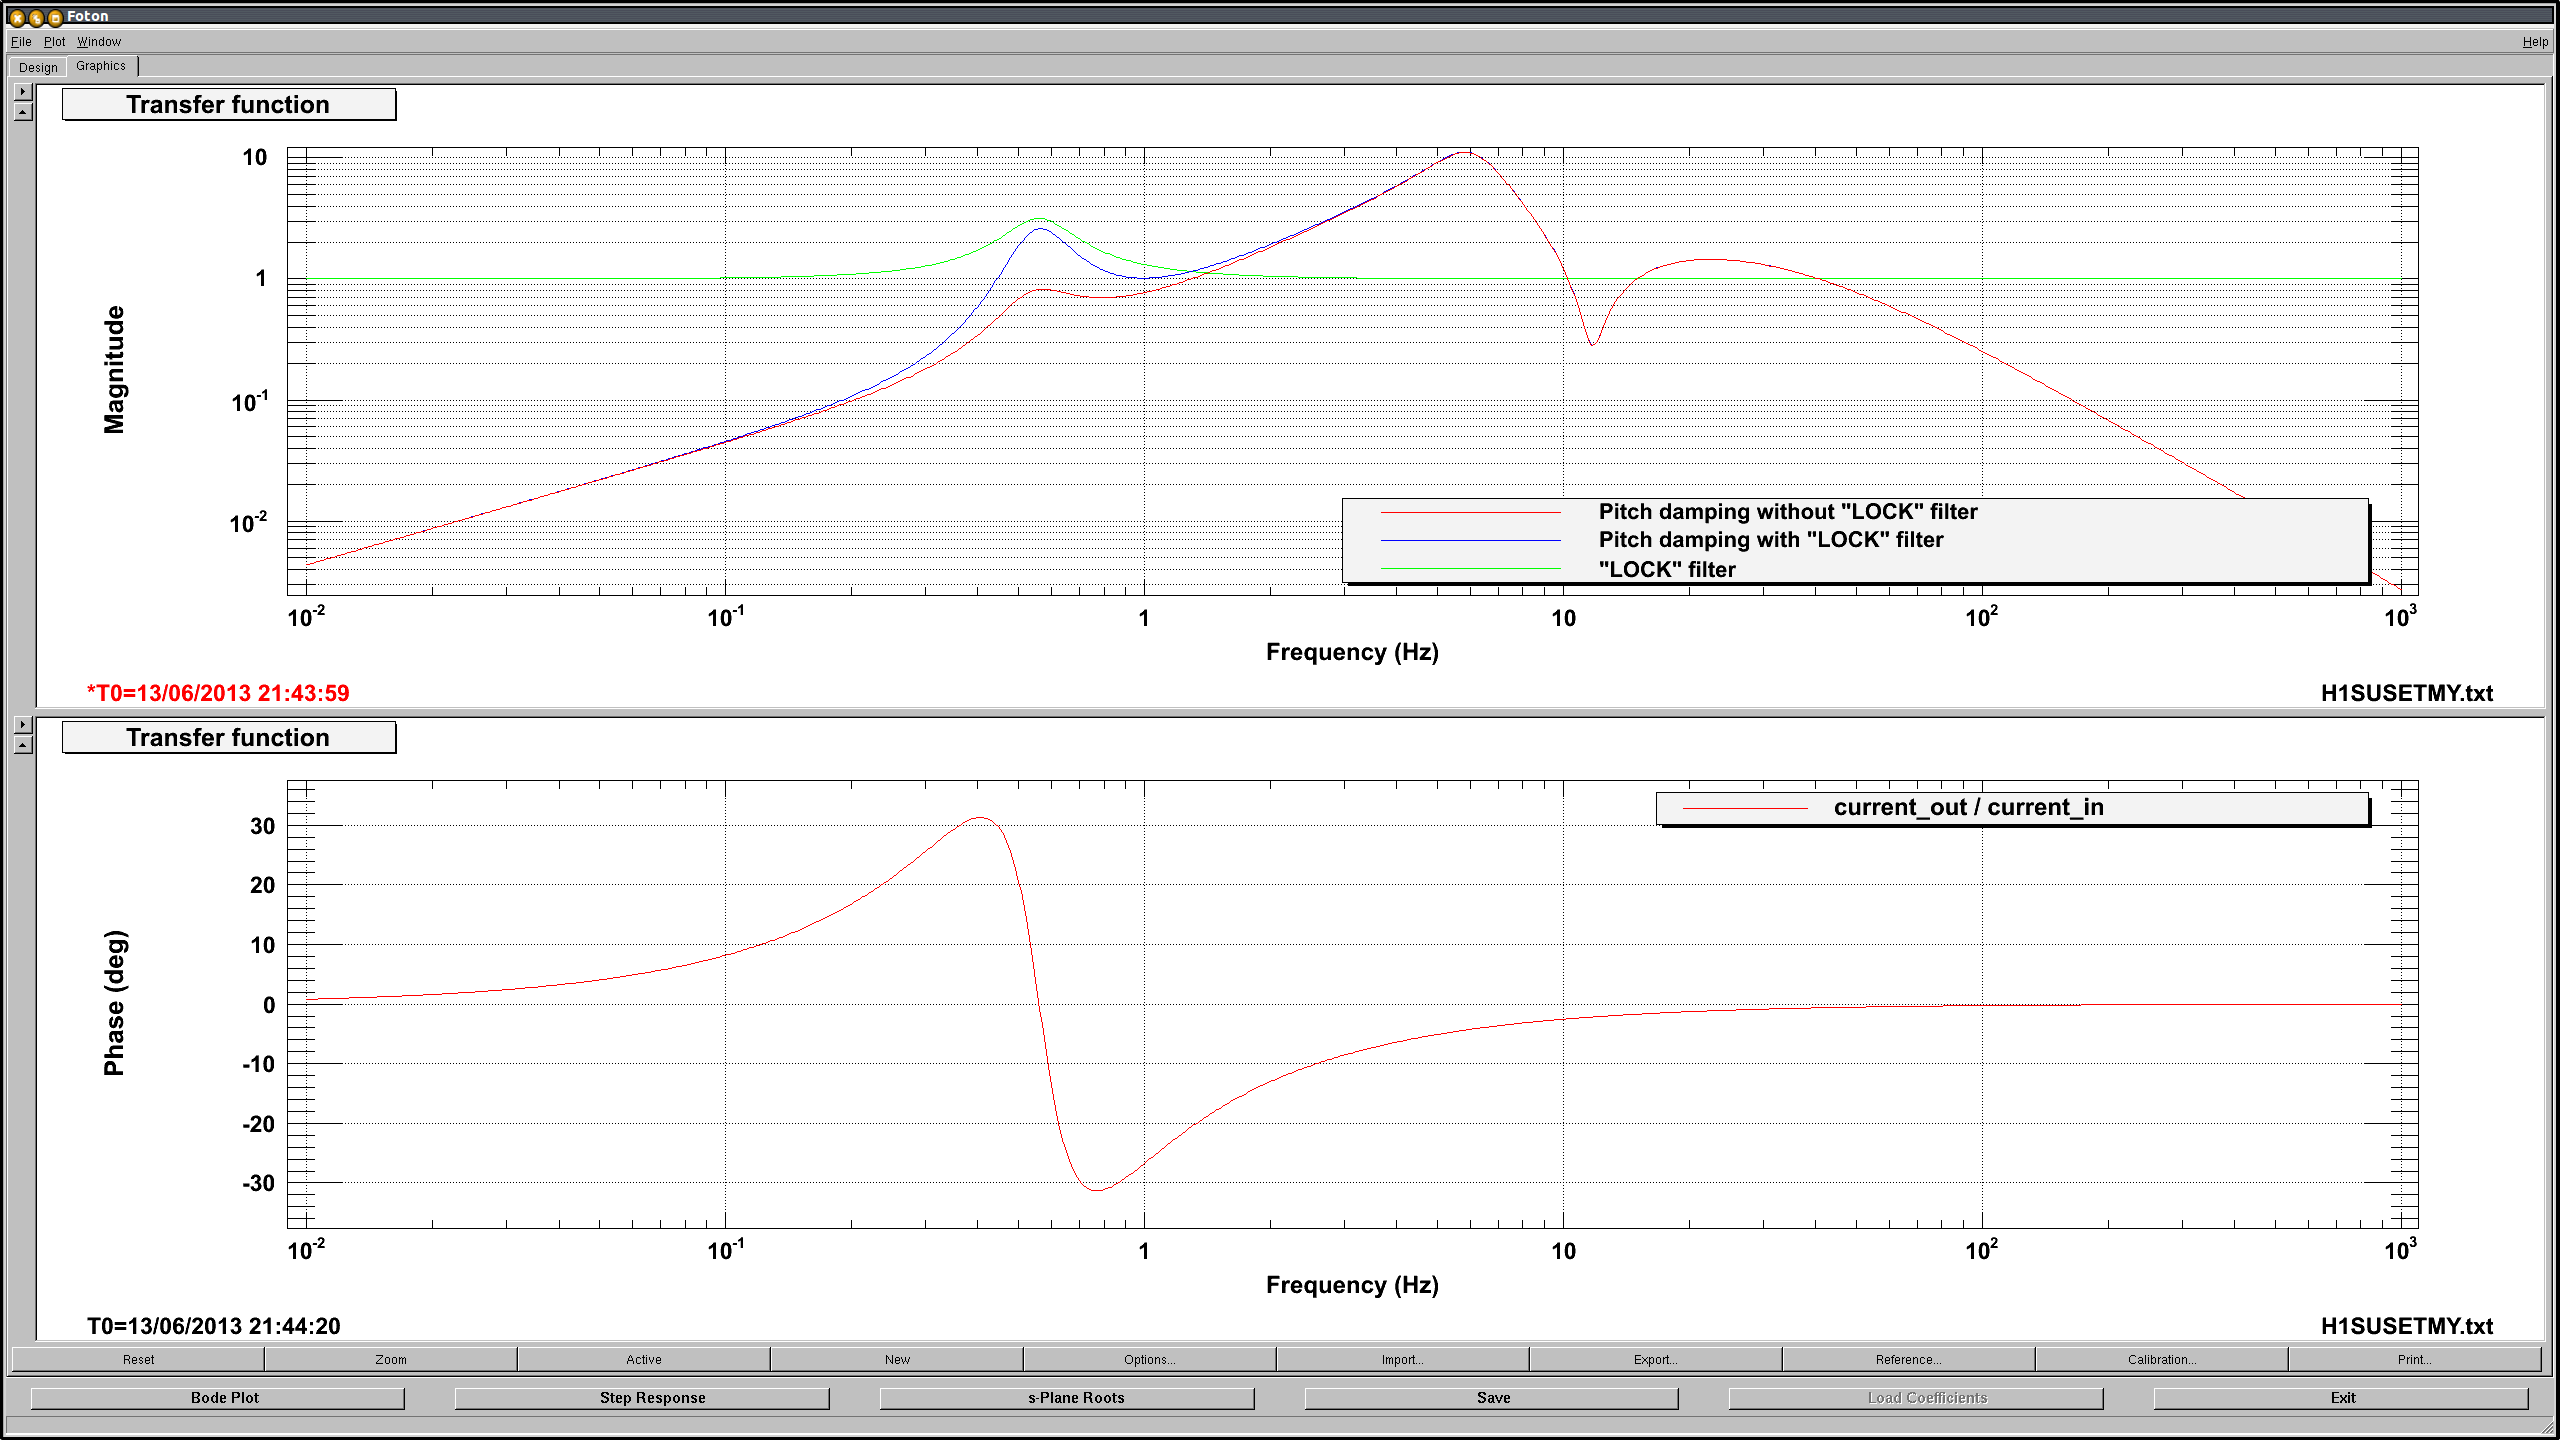
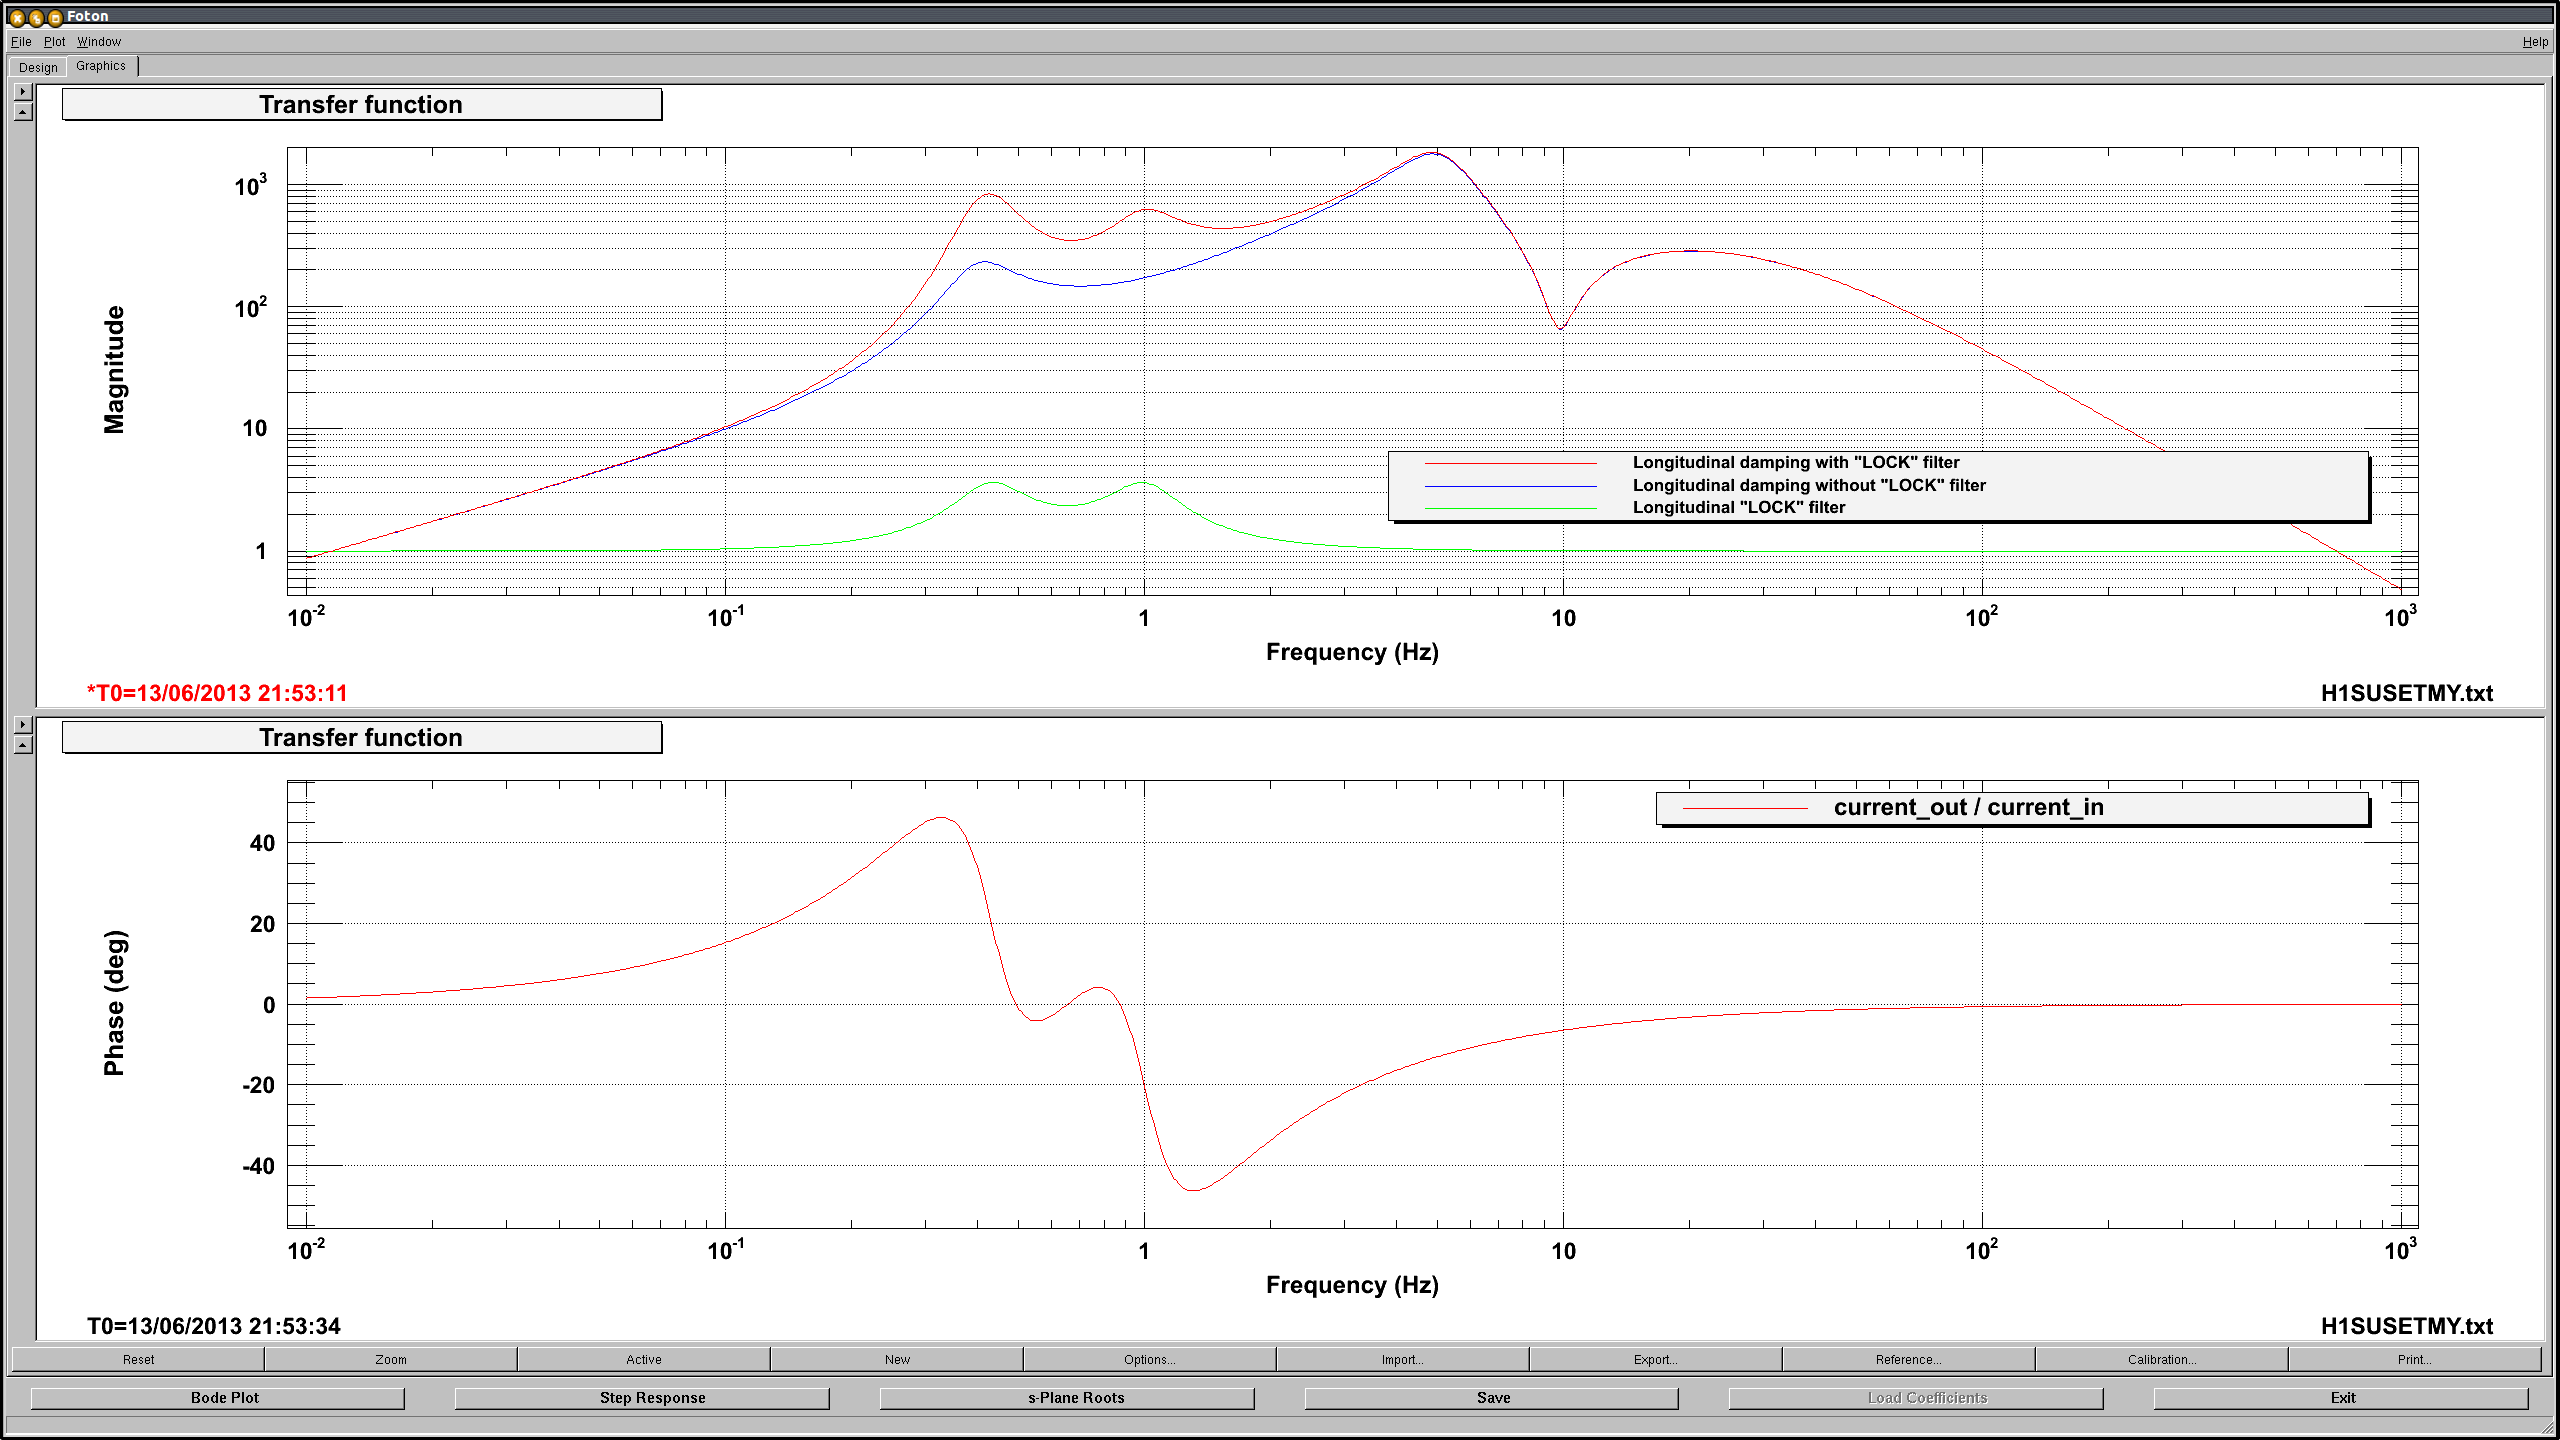
The loop transfer function needs to be analyzed and more sophisticated. We took a transfer function of the MC2 actuation loop when only the CARM was engaged by injecting a swept sine in LSC_CARM_EXC and taking TFs at right after and before of this injection point. The plot below is the result:
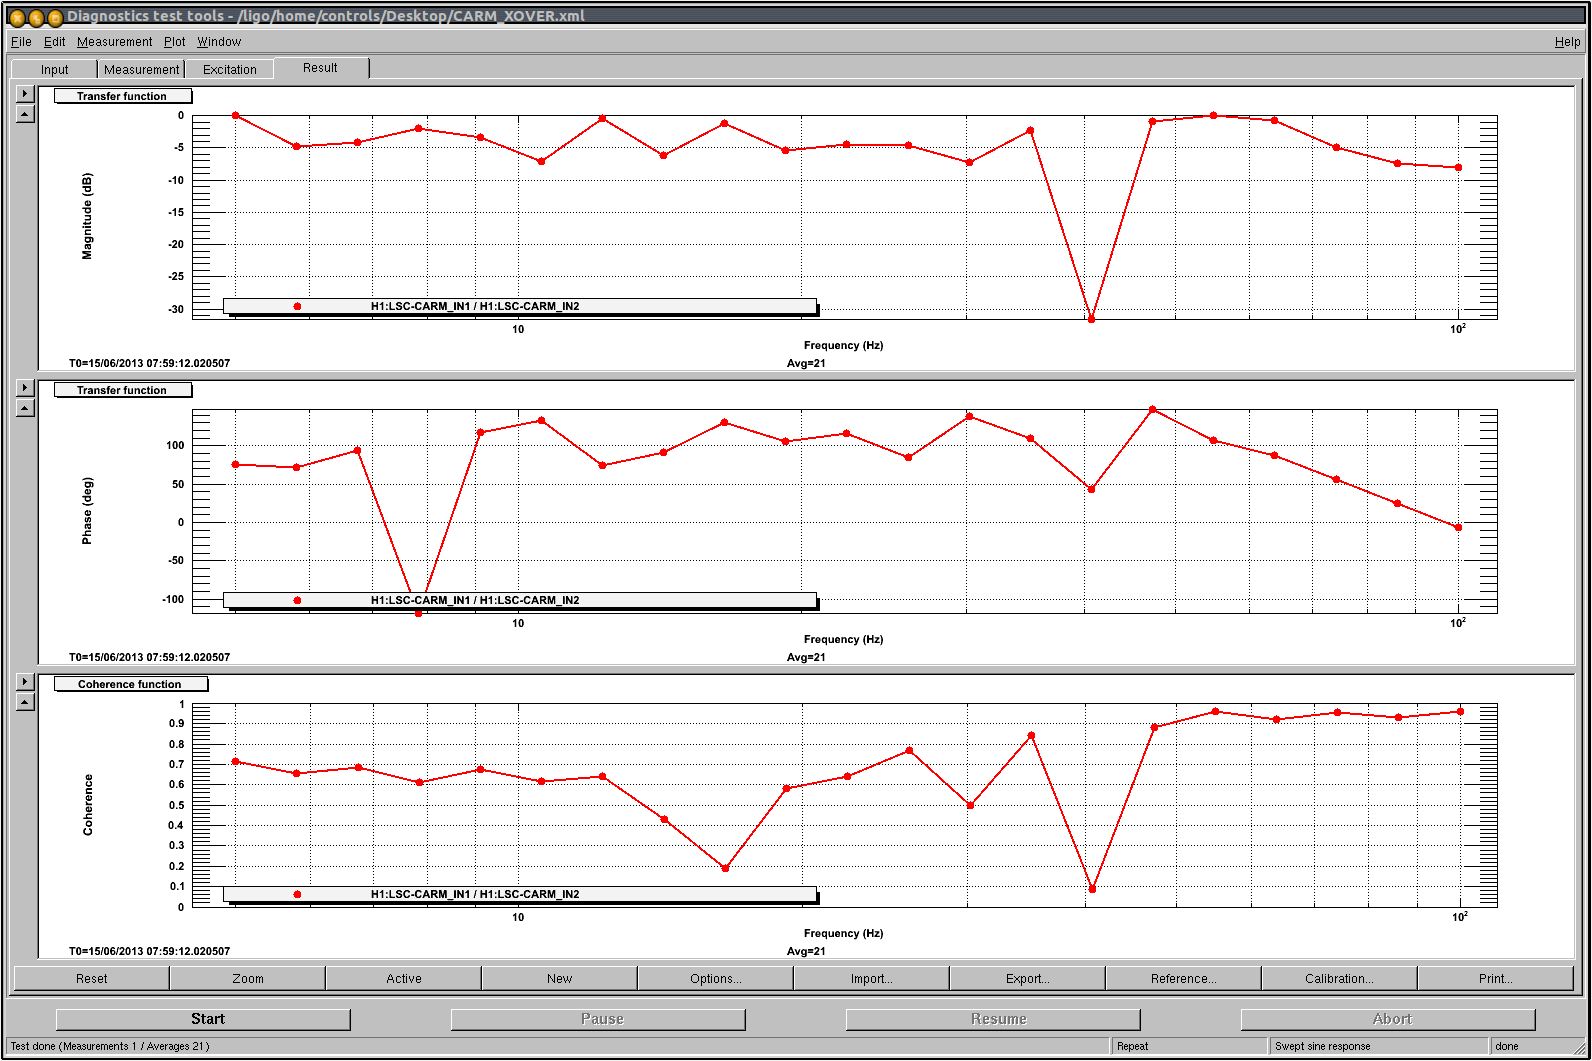
We interpreted this as the ordinary cross-over transfer function measurement --- if this understanding is correct, there is a unnecessary crossover at 53 Hz. This is consistent with our observation that increasing the gain by a factor of 2 leads to a 100 Hz oscillation. The control loop needs further modeling and sophistication.
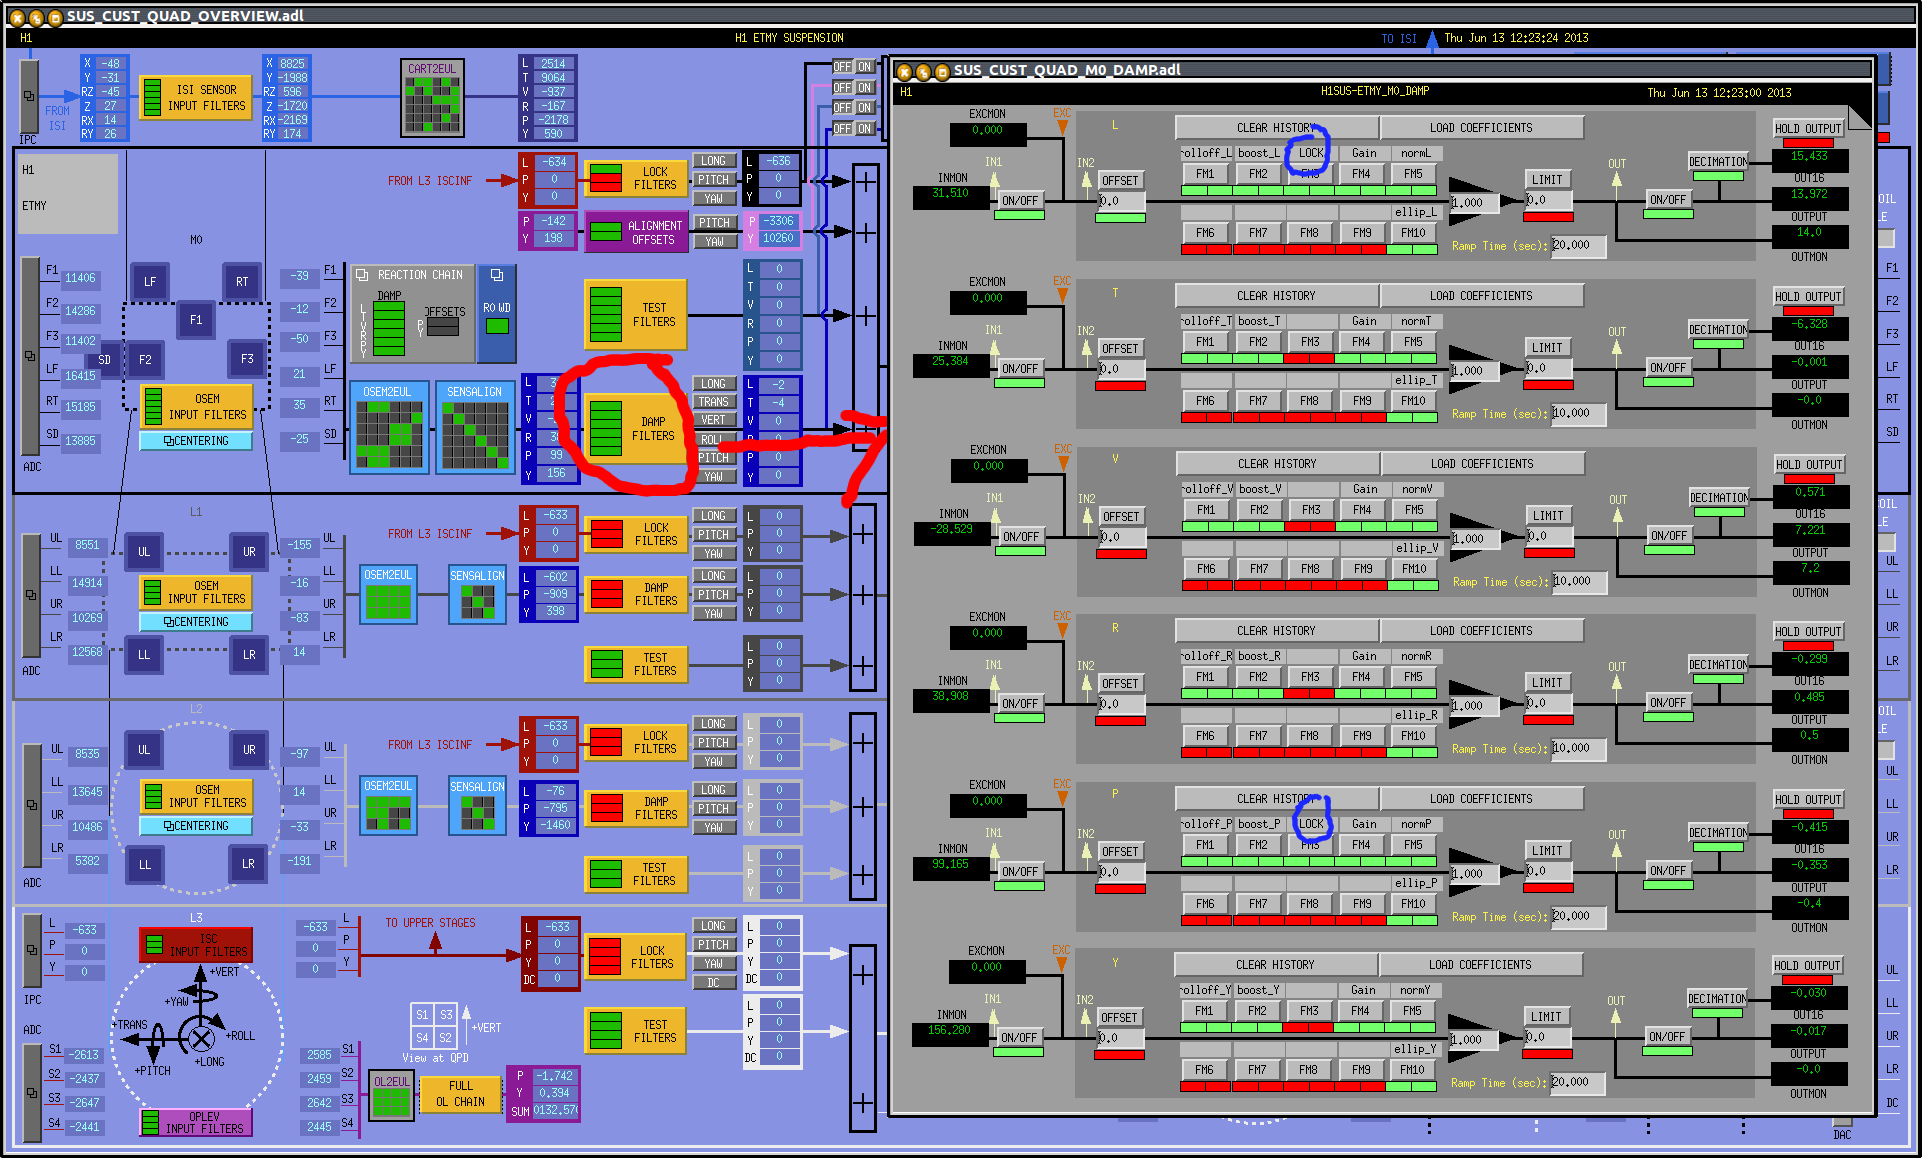
Some settings :
Some importatn settings are saved as screenshots. They are attached.