david.barker@LIGO.ORG - posted 10:23, Monday 23 March 2026 (89597)
Mon CP1 Fill
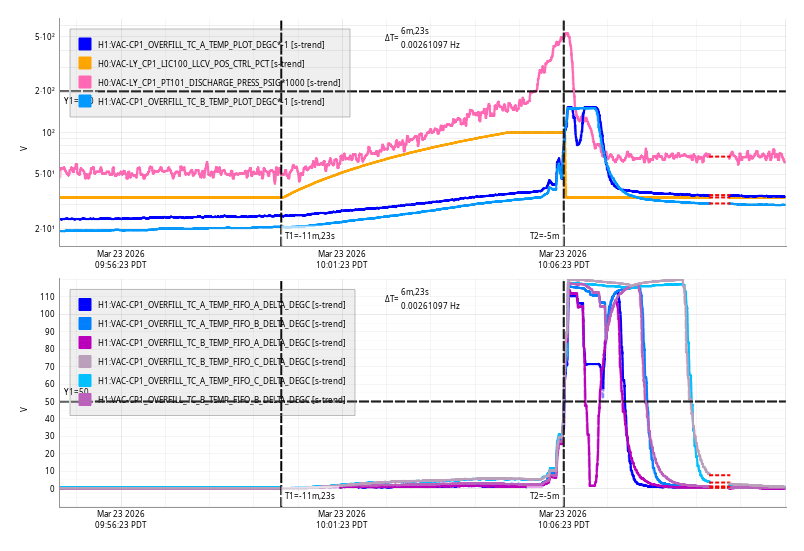
Mon Mar 23 10:06:23 2026 INFO: Fill completed in 6min 19secs
Images attached to this report
Mon Mar 23 10:06:23 2026 INFO: Fill completed in 6min 19secs
Only CPS channels which look higher by eye at high frequencies (see attached) would be the following:
TITLE: 03/23 Day Shift: 1430-2330 UTC (0730-1630 PST), all times posted in UTC
STATE of H1: Planned Engineering
OUTGOING OPERATOR: None
CURRENT ENVIRONMENT:
SEI_ENV state: CALM
Wind: 4mph Gusts, 2mph 3min avg
Primary useism: 0.02 μm/s
Secondary useism: 0.22 μm/s
QUICK SUMMARY:
Arm (GV5/7), FC gate valves closed (GV7 is soft-closed, waiting to cam over). Cleanroom move this morning. Lots of activity around the Y-Beam Manifold begins!
As part of our investigation into h1ioplsc0 timing glitches since last week's h1lsc model change, I restarted all the models on h1lsc0 at 08:07 PDT this morning.
I've extended the alarm bypass on GV7 for another 24 hours.
Bypass will expire:
Tue Mar 24 09:17:05 AM PDT 2026
For channel(s):
H0:VAC-LX_GV7_ZSM179A_VALVE_ANIM
Sun Mar 22 10:03:10 2026 INFO: Fill completed in 3min 7secs
CP1 PT114 cold cathode gauge has come back to life, I've taken it out of the alarm bypass and enabled it in VACSTAT.

Sat Mar 21 10:09:41 2026 INFO: Fill completed in 9min 38secs

(Jordan V., Gerardo M.)
Yesterday we tried to hand over the pumping of HAM1 to the ion pump only, it did not go good, the ion pump started having issues maintaining pressure for HAM1 volume, this ion pump showed a very unusual behavior, the pressure was going up and the output of the controller kept going down. We tried a second controller with similar results. The controllers just quit and turned the high voltage off themselves, self protection/preservation. Today, we went up to the ion pump and ohmed out its feedthrough fischer connector, and to our surprised no short was found, we were convinced that the pump had shorted. So, we took a controller chamber side and connected it with a "short" cable to the ion pump, and the pump turned on without issues. These findings lead us to believe that the cable may be faulty/shorted/broken/no good.
The temporary setup will be used to maintain the ion pump under vacuum, and the setup will remain until another suitable cable (working one) can be acquired and installed.
Attached are a couple of photos of the temporary setup and trend of the controller/pressure at HAM1 behavior during the last couple of days.


(Jordan V., Gerardo M.)
We hard closed GV5 with no issues, the gate valve hard closed at 30 psi. Something to note is the loud clank the gate valve made, and when the valve hard closed it shook the cameras housing, probably the alignment is not what it used to be.
We tried to hard close GV7 but no luck, it soft closed only. We slowly increased the pressure up to 35 psi, and the gate valve remained unchanged. For the activities planed for Monday soft close is good, we will visit the GV7 on Monday.
Then, we moved to close the filter cavity tube isolation valves, we closed FCV-1, FCV-2, FCV-3, FCV-4 and FCV-5. We also isolated the relay tube by closing RV-1 and RV-2, the filter cavity volume will likely go up in pressure.
Today we swapped the 75 l/s ion pump used for the annulus volume on the Y-Beam Manifold (YBM) . Annulus volume was isolated and the pump swapped, no issues encountered during the swap.
An aux cart was used to pump out the ion pump body before switching the IP on. After a couple hours of pumping with both the aux cart and the IP, the aux cart was isolated and the IP was able to maintain the pressure.
Closing WP 13107
This is a belated report of work done by me, Oli and Keita on the OMC builds for the BHSS, done yesterday March 19.
Exciting summary: build for OMCA is complete, including DCPDs and butter dish. OMCA is installed onto the BHSS platform and ready for beam alignment!
Less exciting summary: build for OMCB is halted as tombstone for DPCD A (transmission) is missing a required PCB hole for the electronic connection.
OMCA build notes:
OMCB build notes:


[Elenna, Camille, Arnaud]
We had a quick zoom meeting to discuss this issue. Relevant drawing is https://dcc.ligo.org/D1201273
It is likely that the backshell+PCB assembly was assembled flipped 180 degrees (items 4,5,6 on the drawing). To fix, remove the two 2-56 screws (item 14), flip the assembly and reattach it to the housing. Camille suggest slightly pressing down on the housing while removing those screws to avoid torquing the base with the bond.
Tagging for EPO.
After consultation with Arnaud and Camille, Oli and I were able to correct the problem with the PCB assembly.
On the call with Camille and Arnaud, we referred to the diagram in D1201273 and determined that part #4 is rotated 180. I could also see from this diagram that part #5 is rotated, since there was no notch visible at the top. So, for future installation, make sure the notch in part #5 is oriented upwards! This indicated to us that all that needed to happen was to unscrew the #14 screws, flip the assembly, and screw it back in (we had some concern that we might have to take apart the "sandwich" of parts between #5 and #4).
Indeed, that's all that needed to happen. I carefully unscrewed the screws on the back, flipped the assembly, and screwed it back in. I was then able to install the DCPD. We can now see the notch along the top!


I went back into the lab today to try to get a better photo of the problem. I wasn't able to, but I did get an ok photo of the other tombstone (on reflection of the BS) which has the correct three holes. It's hard to see, but you can use it as a reference to compare with the photo I have attached to the original post which is missing a hole. I tried looking from many angles, and I don't see even a hint of the third hole, which is evidence in support of Keita's theory that the electronics assembly is flipped 180 degrees.

TITLE: 03/20 Day Shift: 1430-2330 UTC (0730-1630 PST), all times posted in UTC
STATE of H1: Planned Engineering
INCOMING OPERATOR: n/a
SHIFT SUMMARY:
No Locking Today. There was some Squeezer alignment checks by sheila & tony. Gerardo & Jordan CLOSED GV5 & 7 as well as Filter Cavity mini-gate valves.
LOG:
Also, CP1 PT114 tripped during the close of GV5, it has been disabled in VACSTAT and bypassed in ALARMS.
At 10:19:54 PDT both h1seib3 and h1seib1 had CRC errors on DAC leg zero. These errors probably represent missing data blocks and not data corruption.
Fri Mar 20 10:19:50 2026 INFO: Fill completed in 19min 46secs

This is for FAMIS #39756.
Laser Status:
NPRO output power is 1.839W
AMP1 output power is 70.43W
AMP2 output power is 139.3W
NPRO watchdog is GREEN
AMP1 watchdog is GREEN
AMP2 watchdog is GREEN
PDWD watchdog is GREEN
PMC:
It has been locked 13 days, 15 hr 44 minutes
Reflected power = 27.02W
Transmitted power = 104.2W
PowerSum = 131.2W
FSS:
It has been locked for 0 days 3 hr and 56 min
TPD[V] = 0.4857V
ISS:
The diffracted power is around 4.3%
Last saturation event was 0 days 20 hours and 40 minutes ago
Possible Issues:
PMC reflected power is high
TITLE: 03/20 Day Shift: 1430-2330 UTC (0730-1630 PST), all times posted in UTC
STATE of H1: Planned Engineering
OUTGOING OPERATOR: None
CURRENT ENVIRONMENT:
SEI_ENV state: CALM
Wind: 32mph Gusts, 27mph 3min avg
Primary useism: 0.03 μm/s
Secondary useism: 0.14 μm/s
QUICK SUMMARY:
Moves starting in the lvea and in the schedule there is the possibility of closing Gate Valves today. IMC_LOCK is DOWN and ISC_LOCK is in IDLE. Had Lab dust alarm at 609am (due to cleaning?).
Randy was thinking of craning the cleanroom spreader bar over the Y-Beam Manifold in prep for a cleanroom move next week, but he checked its weight (510lbs!) and it is right at the limit (500lbs) for allowable lifts over the beamtube with open gate valves, so this will have to wait until gate valves are closed. He'll roll a scissor lift into position in the meantime.
As of about 845am local time, X-arm & Y-arm look passable, but winds are supposed to pick up in the early afternoon (currently winds are just under 30mph at the Corner).
