TITLE: 03/18 Day Shift: 1430-2330 UTC (0730-1630 PST), all times posted in UTC
STATE of H1: Planned Engineering
INCOMING OPERATOR: Ryan C
SHIFT SUMMARY:
IFO is in a single bounce configuration
Overall calm day (though wind is on the rise).
The day started with an initial alignment that could help align the squeezer better. Steps taken were:
1. GREEN_ARMS_MANUAL - lock ALS - INITIAL_ALIGNMENT_OFFLOAD - ALSY was not showing up and trending told us BS was off so we adjusted it.
2. Went to MANUAL_INITIAL_ALIGNMENT
3. POWER to 10W. MICH_DARK_LOCKED (NO WFS). Adjust BS by hand to minimize AS_A
4. POWER to 2W, PRX_LOCKED, Adjust PRM to maximize AS_A
5. POWER to 10W, OFFLOAD_SR2_ALIGN - Fully auto
6. SRY_LOCKED, Adjust SRM by hand to maximize AS_A
7. POWER to 2W, AS_CENTERING_SINGLE_BOUNCE - Fully Auto. Ensure SRM, ITMX, PRM, ETMX, ETMY are misaligned (should do this on its own).
8. AS_CENTERING_OFFLOAD.
This is how to initially align.
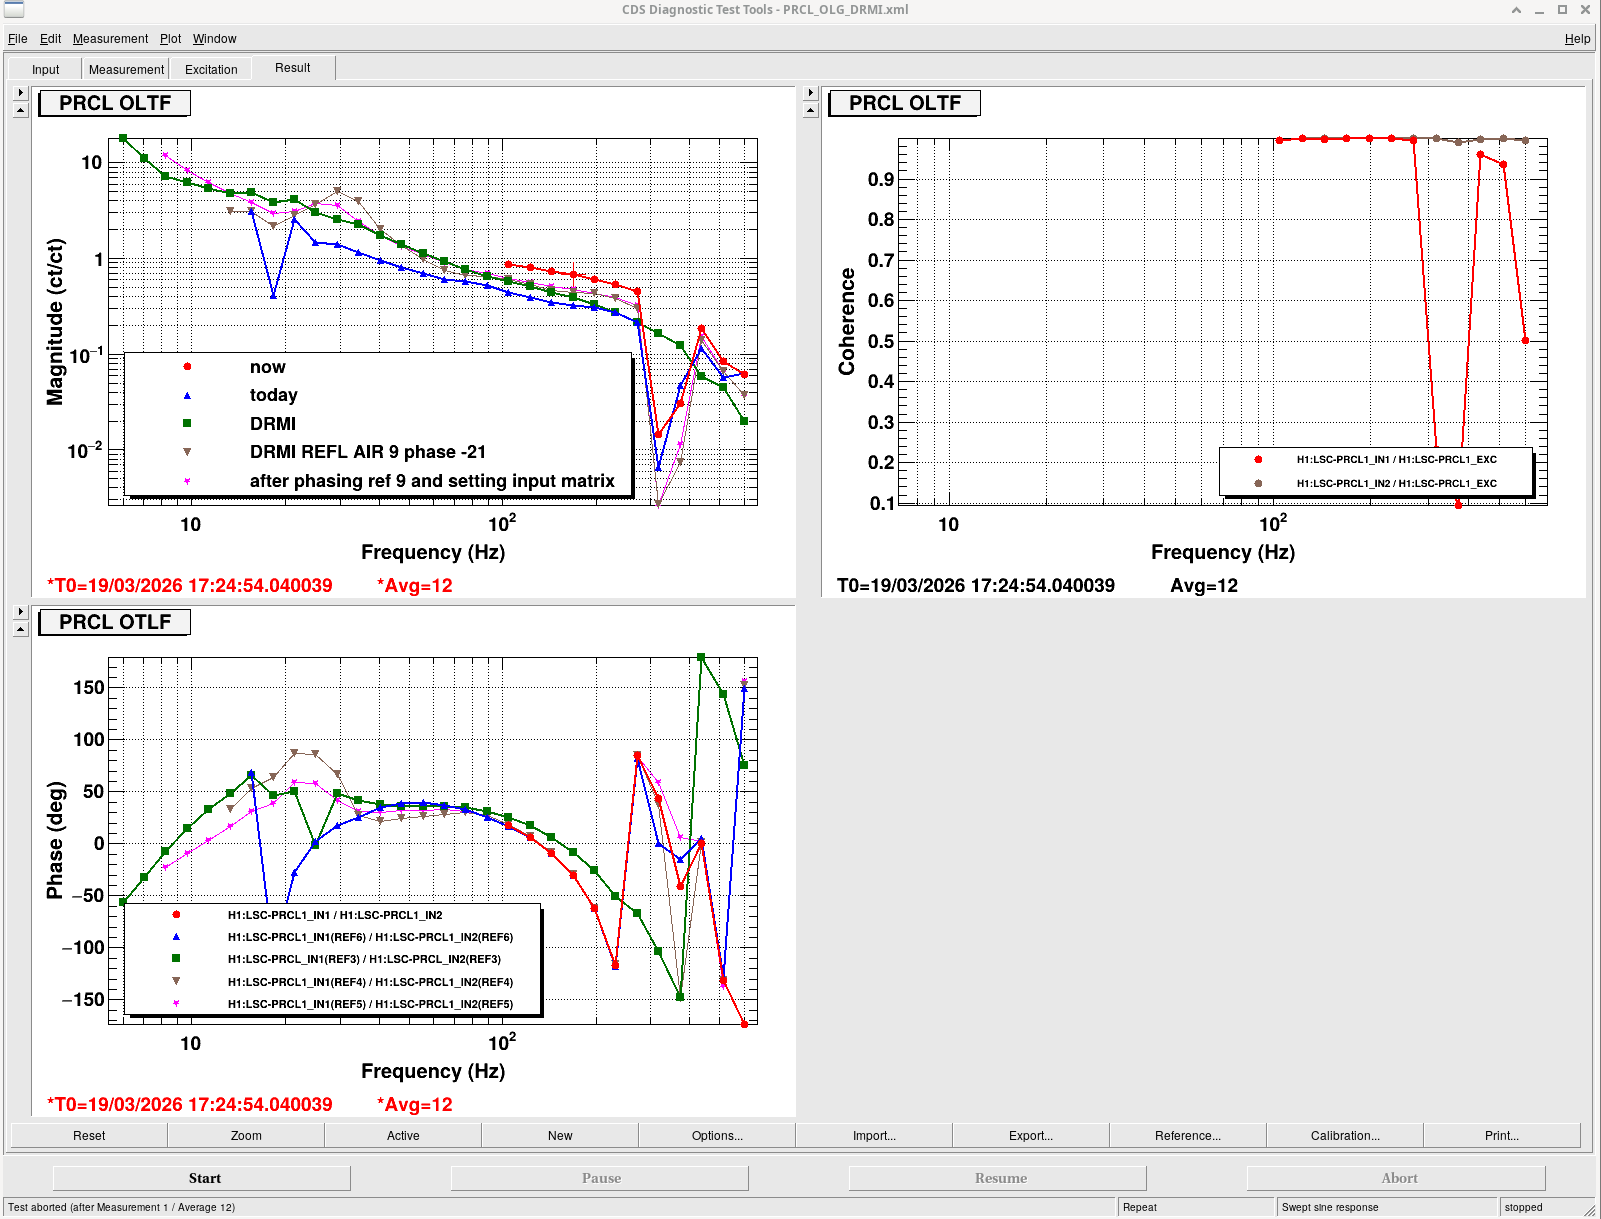
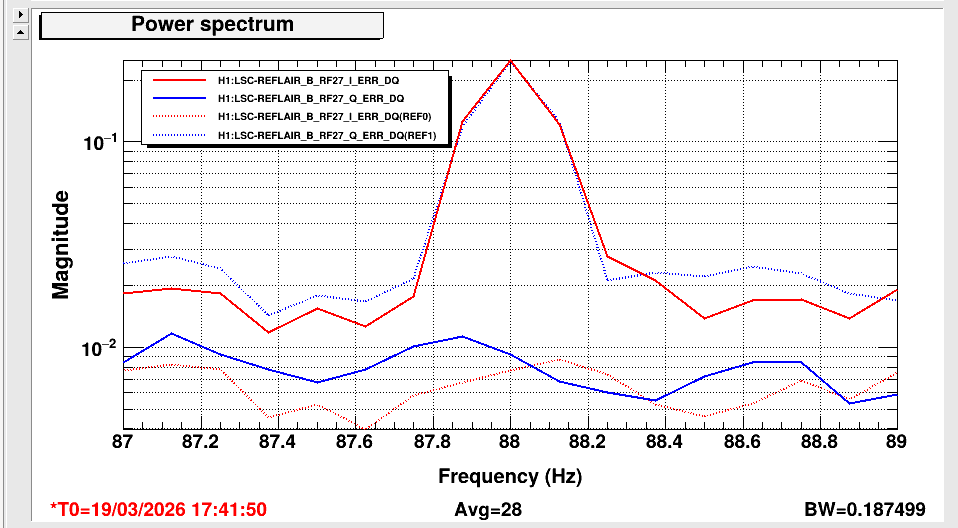
Otherwise, SQZ work was the main task today - progress was made.
LOG:
| Start Time |
System |
Name |
Location |
Lazer_Haz |
Task |
Time End |
| 14:41 |
FAC |
Randy |
LVEA |
n |
Removing +X of BSC2 (Craning) |
15:10 |
| 14:44 |
FAC |
Nellie, Kim |
LVEA |
N |
Technical Cleaning |
15:47 |
| 16:06 |
FAC |
Nellie, Kim |
LVEA |
N |
Technical Cleaning |
17:01 |
| 17:02 |
TCS |
Sophie |
Vac-Prep |
N |
CHETA |
19:24 |
| 17:17 |
ISC |
Oli, Elenna |
Optics Lab |
Local |
BHD Work |
19:31 |
| 17:30 |
SQZ |
Camilla |
Optics Lab, LVEA |
Local |
Grabbing optics |
18:26 |
| 17:41 |
EE |
Fil |
MY |
N |
Look for cables at MY |
18:41 |
| 18:13 |
VAC |
Gerardo, Camilla, Gabriele |
Optics Lab |
N |
Viewport inspection |
19:31 |
| 18:26 |
PEM |
RyanC |
LVEA/CER |
N |
Checking dust monitors |
18:36 |
| 18:28 |
SAF |
Richard |
LVEA |
N |
Checking curtains |
18:36 |
| 18:52 |
SPI |
Jeff, Jim |
Optics Lab |
Local |
SPI work |
22:00 |
| 19:42 |
OPS |
Ryan C |
CER |
N |
Dust monitor data |
19:45 |
| 20:01 |
EE |
Fil |
LVEA |
N |
Cabling by biergarten |
23:13 |
| 20:15 |
SQZ |
Sheila |
FCES |
N |
Recovering SQZ |
22:04 |
| 21:06 |
BHD |
Elenna, Keita, Oli |
OptLab |
y(local) |
BHD work |
23:54 |
| 21:21 |
TCS |
Camilla, Sophie |
LVEA |
N |
Marking stickers in prep |
22:04 |
| 22:53 |
TCS |
Sophie |
Vac prep lab |
N |
CHETA work |
23:16 |
| 23:15 |
VAC |
Gerardo |
Site buildings |
N |
Cryotrap checks around site |
01:15 |


Randy was thinking of craning the cleanroom spreader bar over the Y-Beam Manifold in prep for a cleanroom move next week, but he checked its weight (510lbs!) and it is right at the limit (500lbs) for allowable lifts over the beamtube with open gate valves, so this will have to wait until gate valves are closed. He'll roll a scissor lift into position in the meantime.
As of about 845am local time, X-arm & Y-arm look passable, but winds are supposed to pick up in the early afternoon (currently winds are just under 30mph at the Corner).