There had been a suggestion (passed to me by Sheila) that we should measure the beam positions on SRM and SR2 after the big move that we made this week (which is summarized in alog 77427).
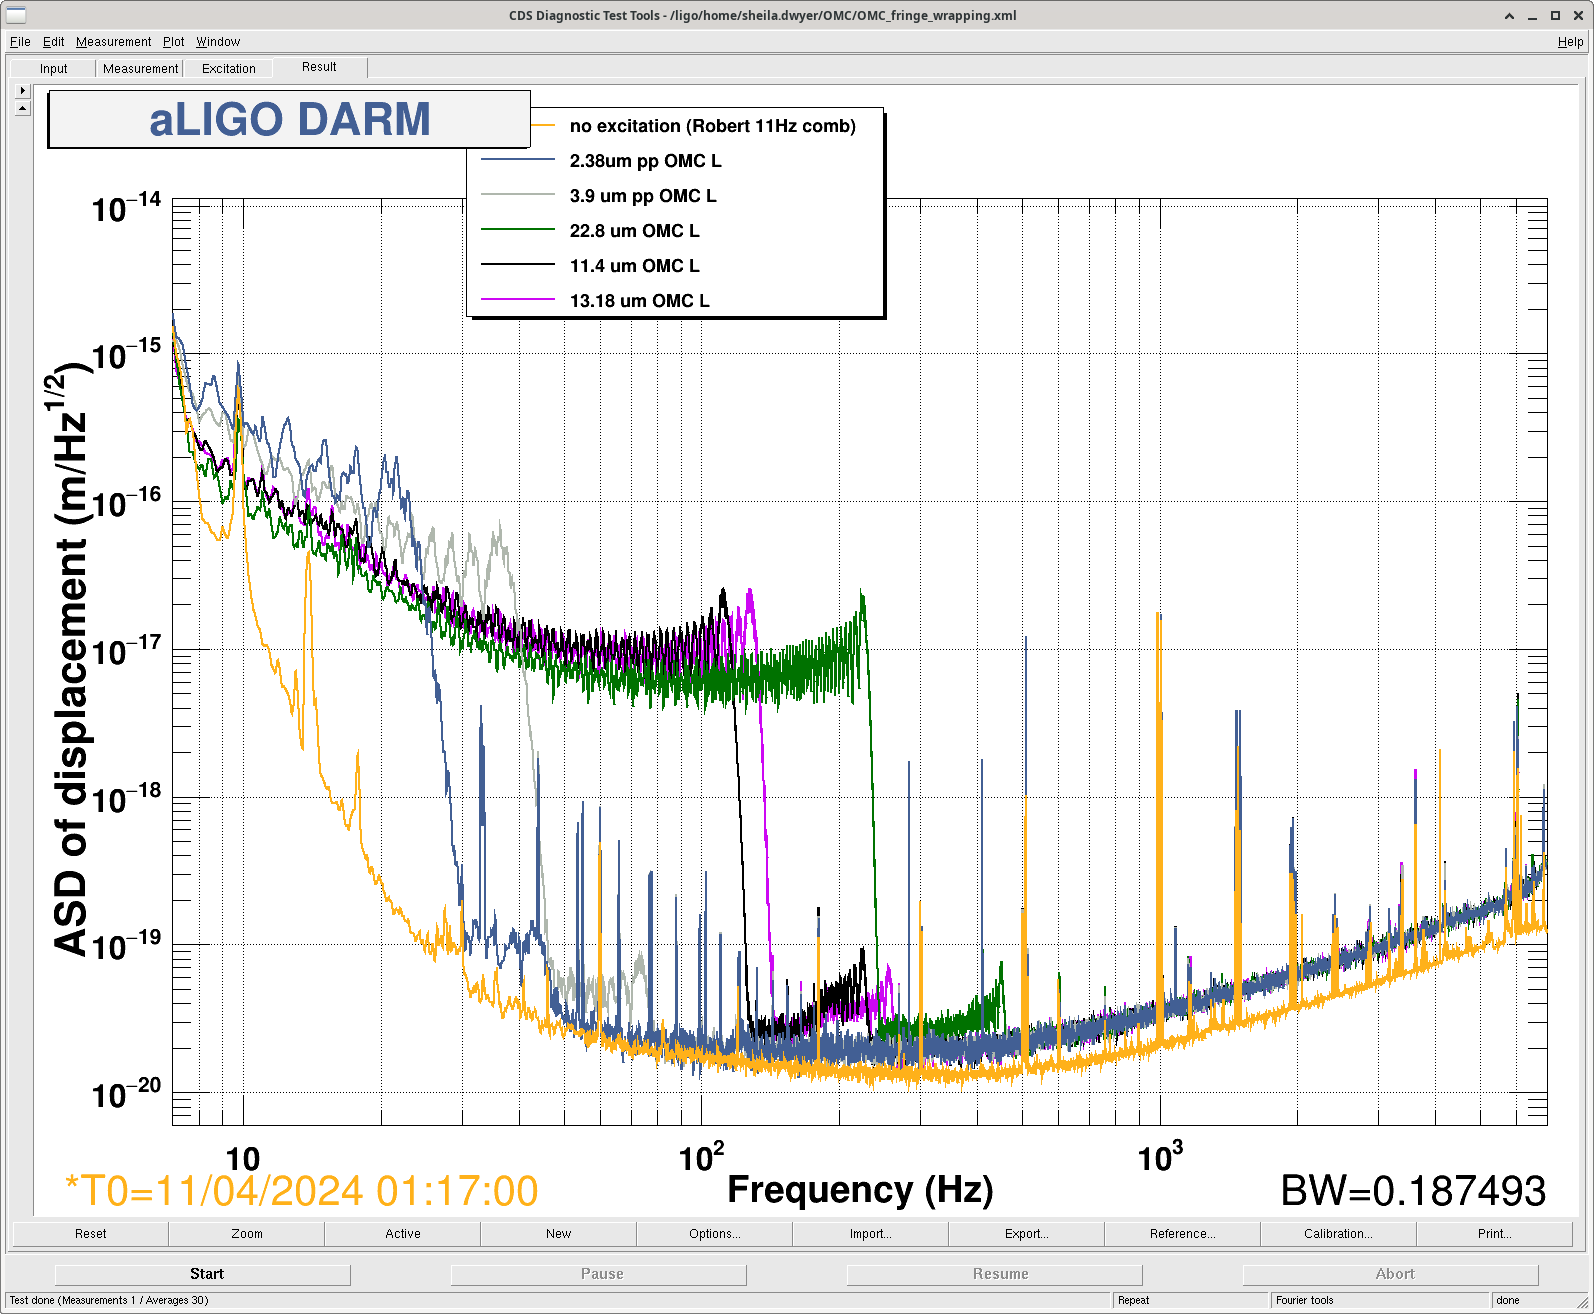
We don't have a premade script to do this like we have for the test masses, so I just did it by hand. One at a time, I put in a line using the ADS screen to SR2 or SRM pit or yaw, then changed the corresponding A2L element to minimize the line height in CAL-DELTAL_EXTERNAL. I was also watching SRCL_IN1 and SRCL_OUT, but the lines disappeared in the SRCL signals before they disappeared in the DARM signal, so I just used DARM.
All A2L values for SR2 and SRM had been 0.0, so I'm not going to bother putting in a 'before' column in the table below since they were all the same value of zreo.
After finding those values, I ran /opt/rtcds/userapps/release/isc/common/scripts/decoup/BeamPosition/CalcSpotPos.py to get from A2L coefficient to beam spot. This script had been made for IMC optics, but since SRM and SR2 are the same style, the calculation should be the same. Reminder of where this calc comes from (it's referenced in the script): alog 31402.
We don't have any 'before' measurements to compare to, but at least we now have some amount of information of where we are on these optics after the big move.
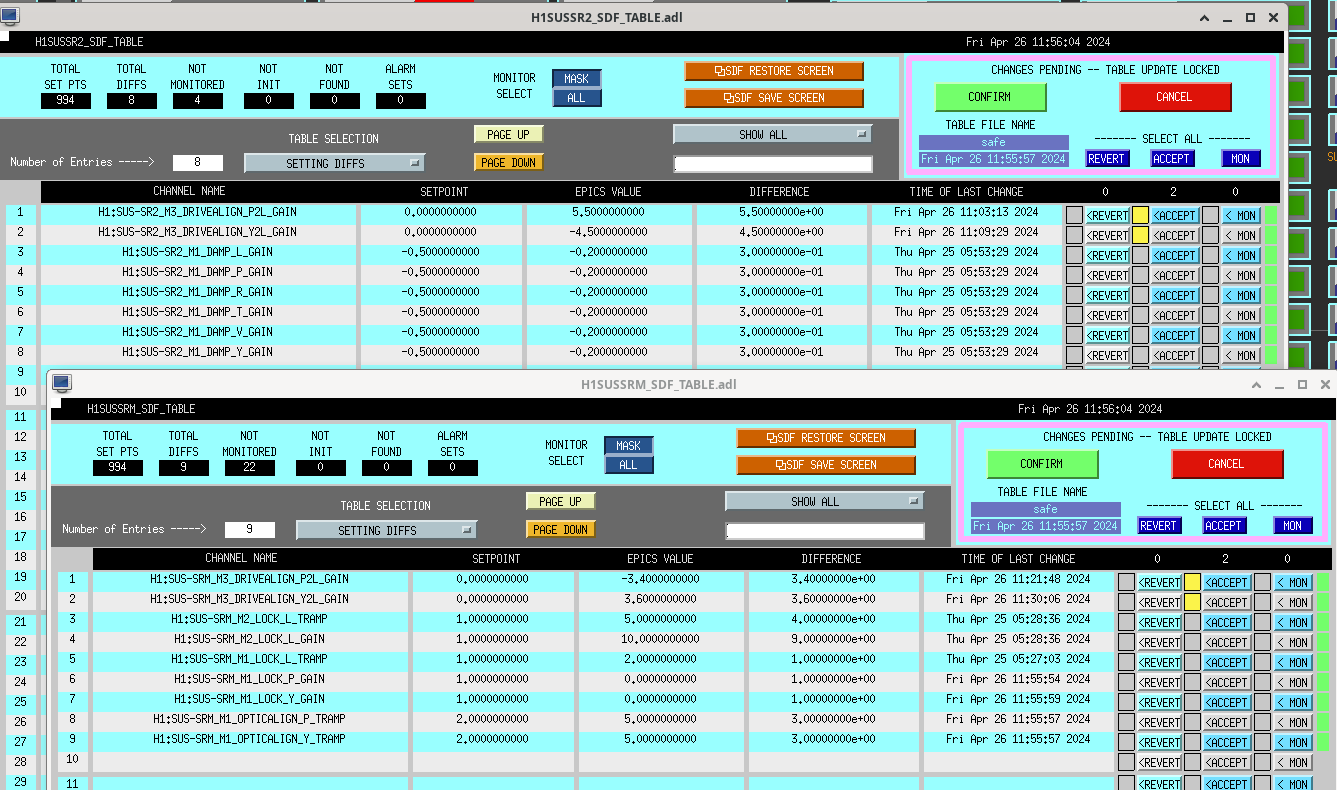
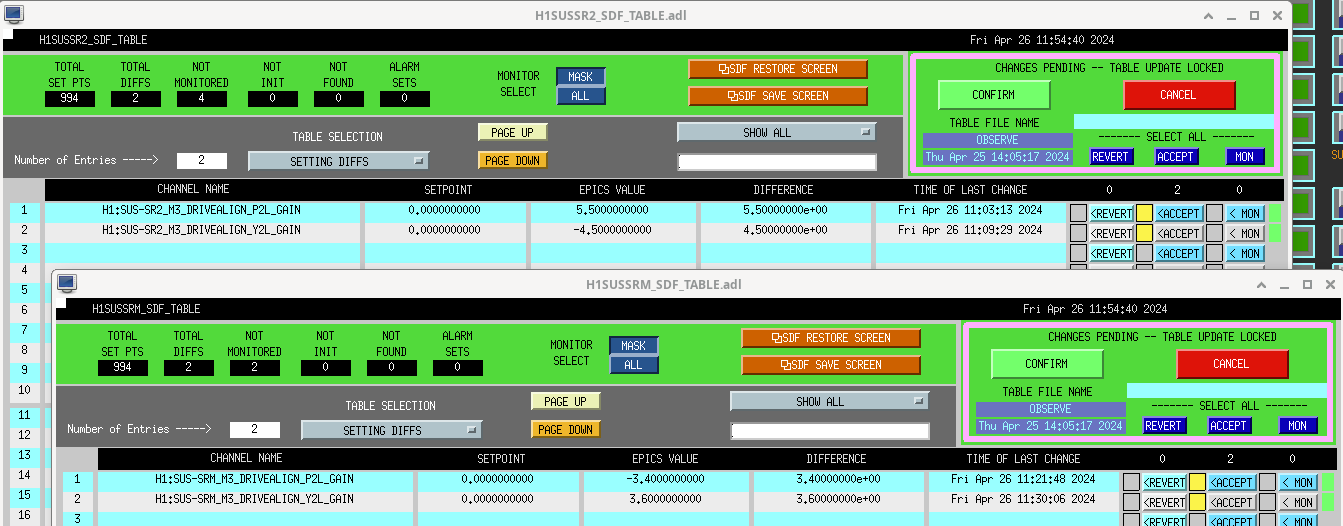
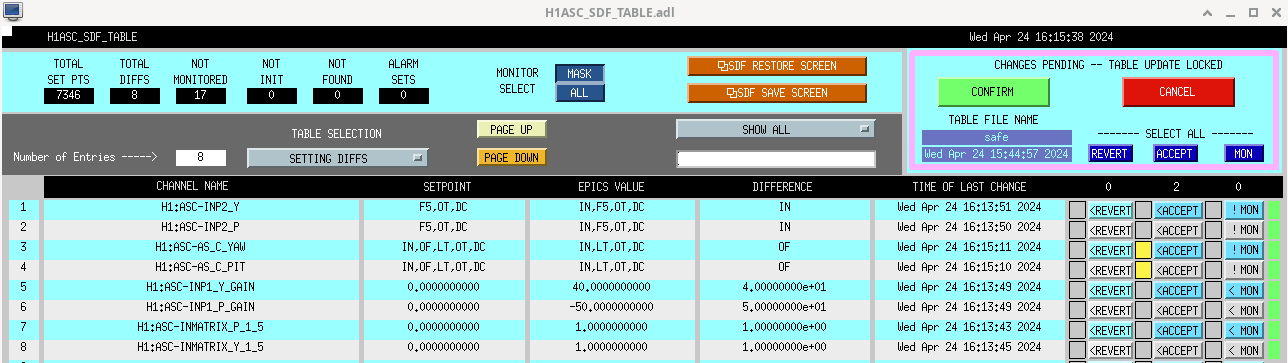
I'm pretty sure that these new A2L values can only be good, so I've accepted them in both safe and observe snaps for SR2 and SRM (see first and second attachments, only 2 rows per SDF table are accepted). These A2L gains for non-test mass suspensions are not under guardian control, so this should be good enough to keep them in place.
In the table below, the Cal-Deltal line reduction factor ends up really just being the ratio of the peak height in DARM before I started doing anything to that dof, and the noise level. To do a better job of measuring this, I would have had to increase my excitation amplitude, but that didn't seem important enough to do given the limited commissioning time we had.
| |
ampl [counts] of line at 30.5 Hz |
A2L gain step size when minimizing |
CAL-DELTAL line reduction factor |
Final A2L gain |
Inferred spot position [mm] |
| SR2 P2L |
0.1 |
0.1 |
50x |
+5.5 |
11.1 |
| SR2 Y2L |
0.1 |
0.3 |
45x |
-4.5 |
-9.1 |
| SRM P2L |
0.7 |
0.1 |
100x |
-3.4 |
-6.8 |
| SRM Y2L |
0.7 |
0.1 |
50x |
+3.6 |
7.2 |
I don't have time right now to think through the whole left-vs-right sign convention (it's discussed in alog 31402), but it does look like we're rather 'diagonal' in the SRC now, since the signs of the spot positions are opposite for SR2 vs SRM (eg one positive P2L and one negative P2L means the beam is on opposite sides of center).
