Camilla, Jennie W
Camilla and I reran the camera offset tests yesterday while in observing. There is a clear effect from yaw offset changes in the build-ups but not so clear with pitch changes.
See this image for the CAM2 servo steps and this image for the CAM1 servo steps.
CAM 2 YAW
The lowest yaw offset gives highest circulating power and highest power on POP A, B and REFL A PDs and the highest yaw offset gives the lowest power values. The lowest offsets give a dip in the range, as does the highest yaw offset. The best offsets for range seem to be close to nominal, the second highest offset step (-414 counts).
KAPPA C is highest at the lowest yaw offset, which makes sense as this is when we have the best build-ups.
CAM 2 PITCH
For the pitch as mentioned above the steps are not obvious in the circulating power plot or the POP A/B / REFL A plots. There is maybe a correlation between the lowest offset and the lowest power build-up, and the second highest offset and the highest power build-up but no clear correlation with the range or KAPPA C.
CAM1
This has similar trends to CAM2 however I think thye pitch is correlated the opposite way from 1 whihc makes me think that the motion the pitch causes is just some swaying f the alignment as the camera offsets change and it doesn't particularly matter which way we change them in pitch. The yaw offset change though shows peaks at lowest offset, troughs at highest offset and best range near nominal offset and highest KAPPA C (optical gain) at highest yaw offset.
Thu Mar 28 10:13:28 2024 INFO: Fill completed in 13min 23secs
Gerardo confirmed a good fill curbside.
Here's a BruCo scan for last night: https://ldas-jobs.ligo-wa.caltech.edu/~gabriele.vajente/bruco_1395660903_GDS_CALIB/ using GDS-CALIB_STRAIN_CLEAN
Some observations on the low frequency range (<50 Hz):
It looks like we could try to improve the low frequency by:
TITLE: 03/28 Day Shift: 15:00-23:00 UTC (08:00-16:00 PST), all times posted in UTC
STATE of H1: Observing at 152Mpc
OUTGOING OPERATOR: None
CURRENT ENVIRONMENT:
SEI_ENV state: CALM
Wind: 9mph Gusts, 8mph 5min avg
Primary useism: 0.03 μm/s
Secondary useism: 0.52 μm/s
QUICK SUMMARY:
H1's been locked 20.75hrs and is currently in OBSERVING at a range just under 160Mpc.
Robert mentioning needing to fix some accelerometers at an End Station and then start PEM injections (he also mentioned commissioning work possibly going on while he looks at the accelerometers).
TITLE: 03/28 Eve Shift: 23:00-07:00 UTC (16:00-00:00 PST), all times posted in UTC
STATE of H1: Observing at 151Mpc
INCOMING OPERATOR: None
SHIFT SUMMARY: We're Observing and have been Locked for over 12.5 hours now. Very quiet night!
LOG:
2300UTC Detector locked for 4.5 hours, commissioning wrapping up
2308 Into Observing
Closes FAMIS#25984, last checked in 76634
They all look very similar to at least the last few weeks of checks. The only thing that stood out to me was ITMY stage 2 V2 around 100Hz and 170Hz - the spikes there are slightly thicker than all the other stage 2 higher frequency spikes.
We've now been Locked for over 9 hours and are Observing.
Vicky, Naoki, Nutsinee
To scan the ZM alignment, we copied the SCAN_ALIGNMENT state in SQZ_MANAGER guardian in LLO. After some debugging, we successfully ran this state. The result is saved in here.
https://lhocds.ligo-wa.caltech.edu/exports/SQZ/GRD/ZM_SCAN/
This state scans the ZM4/ZM6 COM and DIF P/Y. We need the proper diagonalization to define the COM and DIF, but we have not done it today. The state fits the BLRMS6 at 1.7kHz and finds the optimal ZM slider value for minimizing the BLRMS6 as shown in the first attachment. After each ZM scan, the SQZ angle is also scanned and the optimal SQZ angle is found as shown in the second attachment.
The third attachment shows the BLRMS. The T1 cursor shows when the sqz-optimized scan was done. After the scan, the BLRMS6 looked good, but the BLRMS3 (yellow) was not so good and the BNS range was below 150 Mpc. So we tweaked the sqz angle and the BNS range reached more than 150 Mpc.
The original SCAN_ALIGNMENT tries to find the minimum of squeezing, but we modified it so that it can also try to find the maximum of anti squeezing. The T2 cursor in the third attachment shows when the asqz-optimized scan was done. The result is saved here.
sqz-optimized: https://lhocds.ligo-wa.caltech.edu/exports/SQZ/GRD/ZM_SCAN/240327132206/
asqz-optimized: https://lhocds.ligo-wa.caltech.edu/exports/SQZ/GRD/ZM_SCAN/240327144407/
The fourth attachment shows the ZM slider after the sqz-optimized and asqz-optimized scan. The ZM4 Y is almost the same, but other ZM alignment is different by 10-20 counts between the sqz-optimized and asqz-optimized scan. The proper diagonalization of ZM4/6 would resolve it.
Since the SCAN_ALIGNMENT touches the TRAMP of ZM slider, we reverted it after the scan as shown in the fifth attachment.
Screenshot of the SCAN_ALIGNMENT_FDS (105) guardian state maximizing anti-sqz, just like Masayuki's LLO:64903. This update to SQZ_MANAGER is committed to svn revision 27339.
It looks like this tuning improved the noise in the bucket. Maybe reducing the misterious excess broadband noise?
This also reduces the "excess noise" as estimated using Artem's method (computing the difference between the PSD now and in O4a).
Jennie and I started the camera_servo_offset_stepper.py script to run for CAM2 (at 23:18UTC - 3:28UTC) should finish by 8:18pm and scheduled CAM1 for 8:30 to 12:30pm (3:30 to 7:30UTC). These didn't run yesterday 76732 as the IFO was unlocked.
TITLE: 03/27 Day Shift: 15:00-23:00 UTC (08:00-16:00 PST), all times posted in UTC
STATE of H1: Observing
INCOMING OPERATOR: Oli
SHIFT SUMMARY: We've been locked for over 4.5 hours and have just transitioned back to Observing for the rest of the evening. The one lock loss we had was possibly cuased by work on the floor. Relocking was straight forward, I ended up moving PRM to lock PRMI in an attempt to avoid an initial alignment. It took 57 min to relock.
LOG:
| Start Time | System | Name | Location | Lazer_Haz | Task | Time End |
|---|---|---|---|---|---|---|
| 16:09 | VAC | Gerardo | site | n | Forklifting septum from woodshop to LSB receiving | 16:39 |
| 16:09 | ISC | Sheila, Artem | CR | n | ESD bias change | 18:09 |
| 16:26 | ISC | Daniel | LVEA | n | Look at PSL racks | 16:45 |
| 16:46 | FAC | Kim | H2 | n | Tech clean | 18:46 |
| 17:11 | SQZ | Julian | OptLab | yes | SHG work | 19:32 |
| 20:09 | ISC | Sheila | LVEA | n | Checking on PSL racks | 20:29 |
| 22:12 | PEM | Robert | LVEA | n | Turn off amps, clean up | 22:17 |
| 22:19 | PEM | Robert | EX | n | Shaker meas | 23:14 |
TITLE: 03/27 Eve Shift: 23:00-07:00 UTC (16:00-00:00 PST), all times posted in UTC
STATE of H1: Commissioning
OUTGOING OPERATOR: TJ
CURRENT ENVIRONMENT:
SEI_ENV state: CALM
Wind: 13mph Gusts, 11mph 5min avg
Primary useism: 0.03 μm/s
Secondary useism: 0.27 μm/s
QUICK SUMMARY:
Detector has been Locked for 4.5 hours and commissioning is wrapping up.
Since we have been moving input alignment, seeing strange behavior, and have an increased PRCL coupling that we can't explain, I figured we should answer this question.
Short answer: probably not.
Longer answer and explanation:
Going back in time in the alog, I found several great references. First, this alog 31381 from Kiwamu that shows at one point the PR2 Y2L gain was -9.5, greater than our current value of -7.4, and the miscentering corresponded to 19 mm miscentered.
I also found these other references, 31402, 42601, and Koji's elog (thanks to the above alog and also Georgia). The beam miscentering can be calculated via d = 2* alpha * beta / D. Alpha is calculated by alpha = A2L * L_eul / (A2A * A_eul)
For an HSTS, d = 39.28 mm * alpha (Craig's comment in 42601)
PR2 Y2L = -7.4, L_eul = 0.25, Y2Y = 1 and A_eul = -5.23820 (for the UL coil).
Therefore, d = 39.28 mm * 0.37 = 14.53 mm
From Kiwamu in 31381, PR2 is 150 mm in diameter and the beam is about 6 mm. So this Y2L gain is fine, assuming that the coils are balanced.
A good test is probably to check that the PR2 coils are balanced.
Daniel plugged in the SR785 into the common mode board this morning.
I've followed the instructions in 64204, and 67214 summarized here:
make sure the excitation A is enabled on the common mode board, the 785 is plugged in.
cd /ligo/gitcommon/psl_measurements/templates
conda activate /ligo/home/craig.cahillane/.conda/envs/psl
python ../code/SRmeasure.py carm_olg_template.yml
The plot options in the template don't work.
to find your data go to: /ligo/gitcommon/psl_measurements/data/carm_olg and try ls -lrtp to find the most recent file
To make a plot:
python ../code/quick_tf_plot.py /ligo/gitcommon/psl_measurements/data/carm_olg/CARM_OLG_27-03-2024_131841.txt
The CARM olg right now is something like 17 kHz, consistent with 76448 but a little higher than 70920 and 65676 and 67584. These all look fine according to the loop stability, but we could try reducing the CARM gain a bit to be more similar to O4a.
I reduced the gain by 3dB on both inputs 1 and 2, resulting in the second attachment. I've lowered the gain setting in laser noise supression to 3dB from 6dB as well so that we will run like this.
Ryan C, Austin, Oli, Jeff K, Betsy, Dave, Eric, Fil, RAL/CIT team and Rahul
Happy to report that we have finished the assembly of our first A+ HAM Relay Triple Suspension (HRTS) (freestanding version) with Class A parts as per the assembly procedure described in D1900449_V7. HRTS is a new small scale triple pendulum suspension required for Balanced Homodyne Detection system. This is first of the twelve suspensions we have to deliver for both the sites (six each for LHO and LLO, which includes one spare per site) for observing run O5.
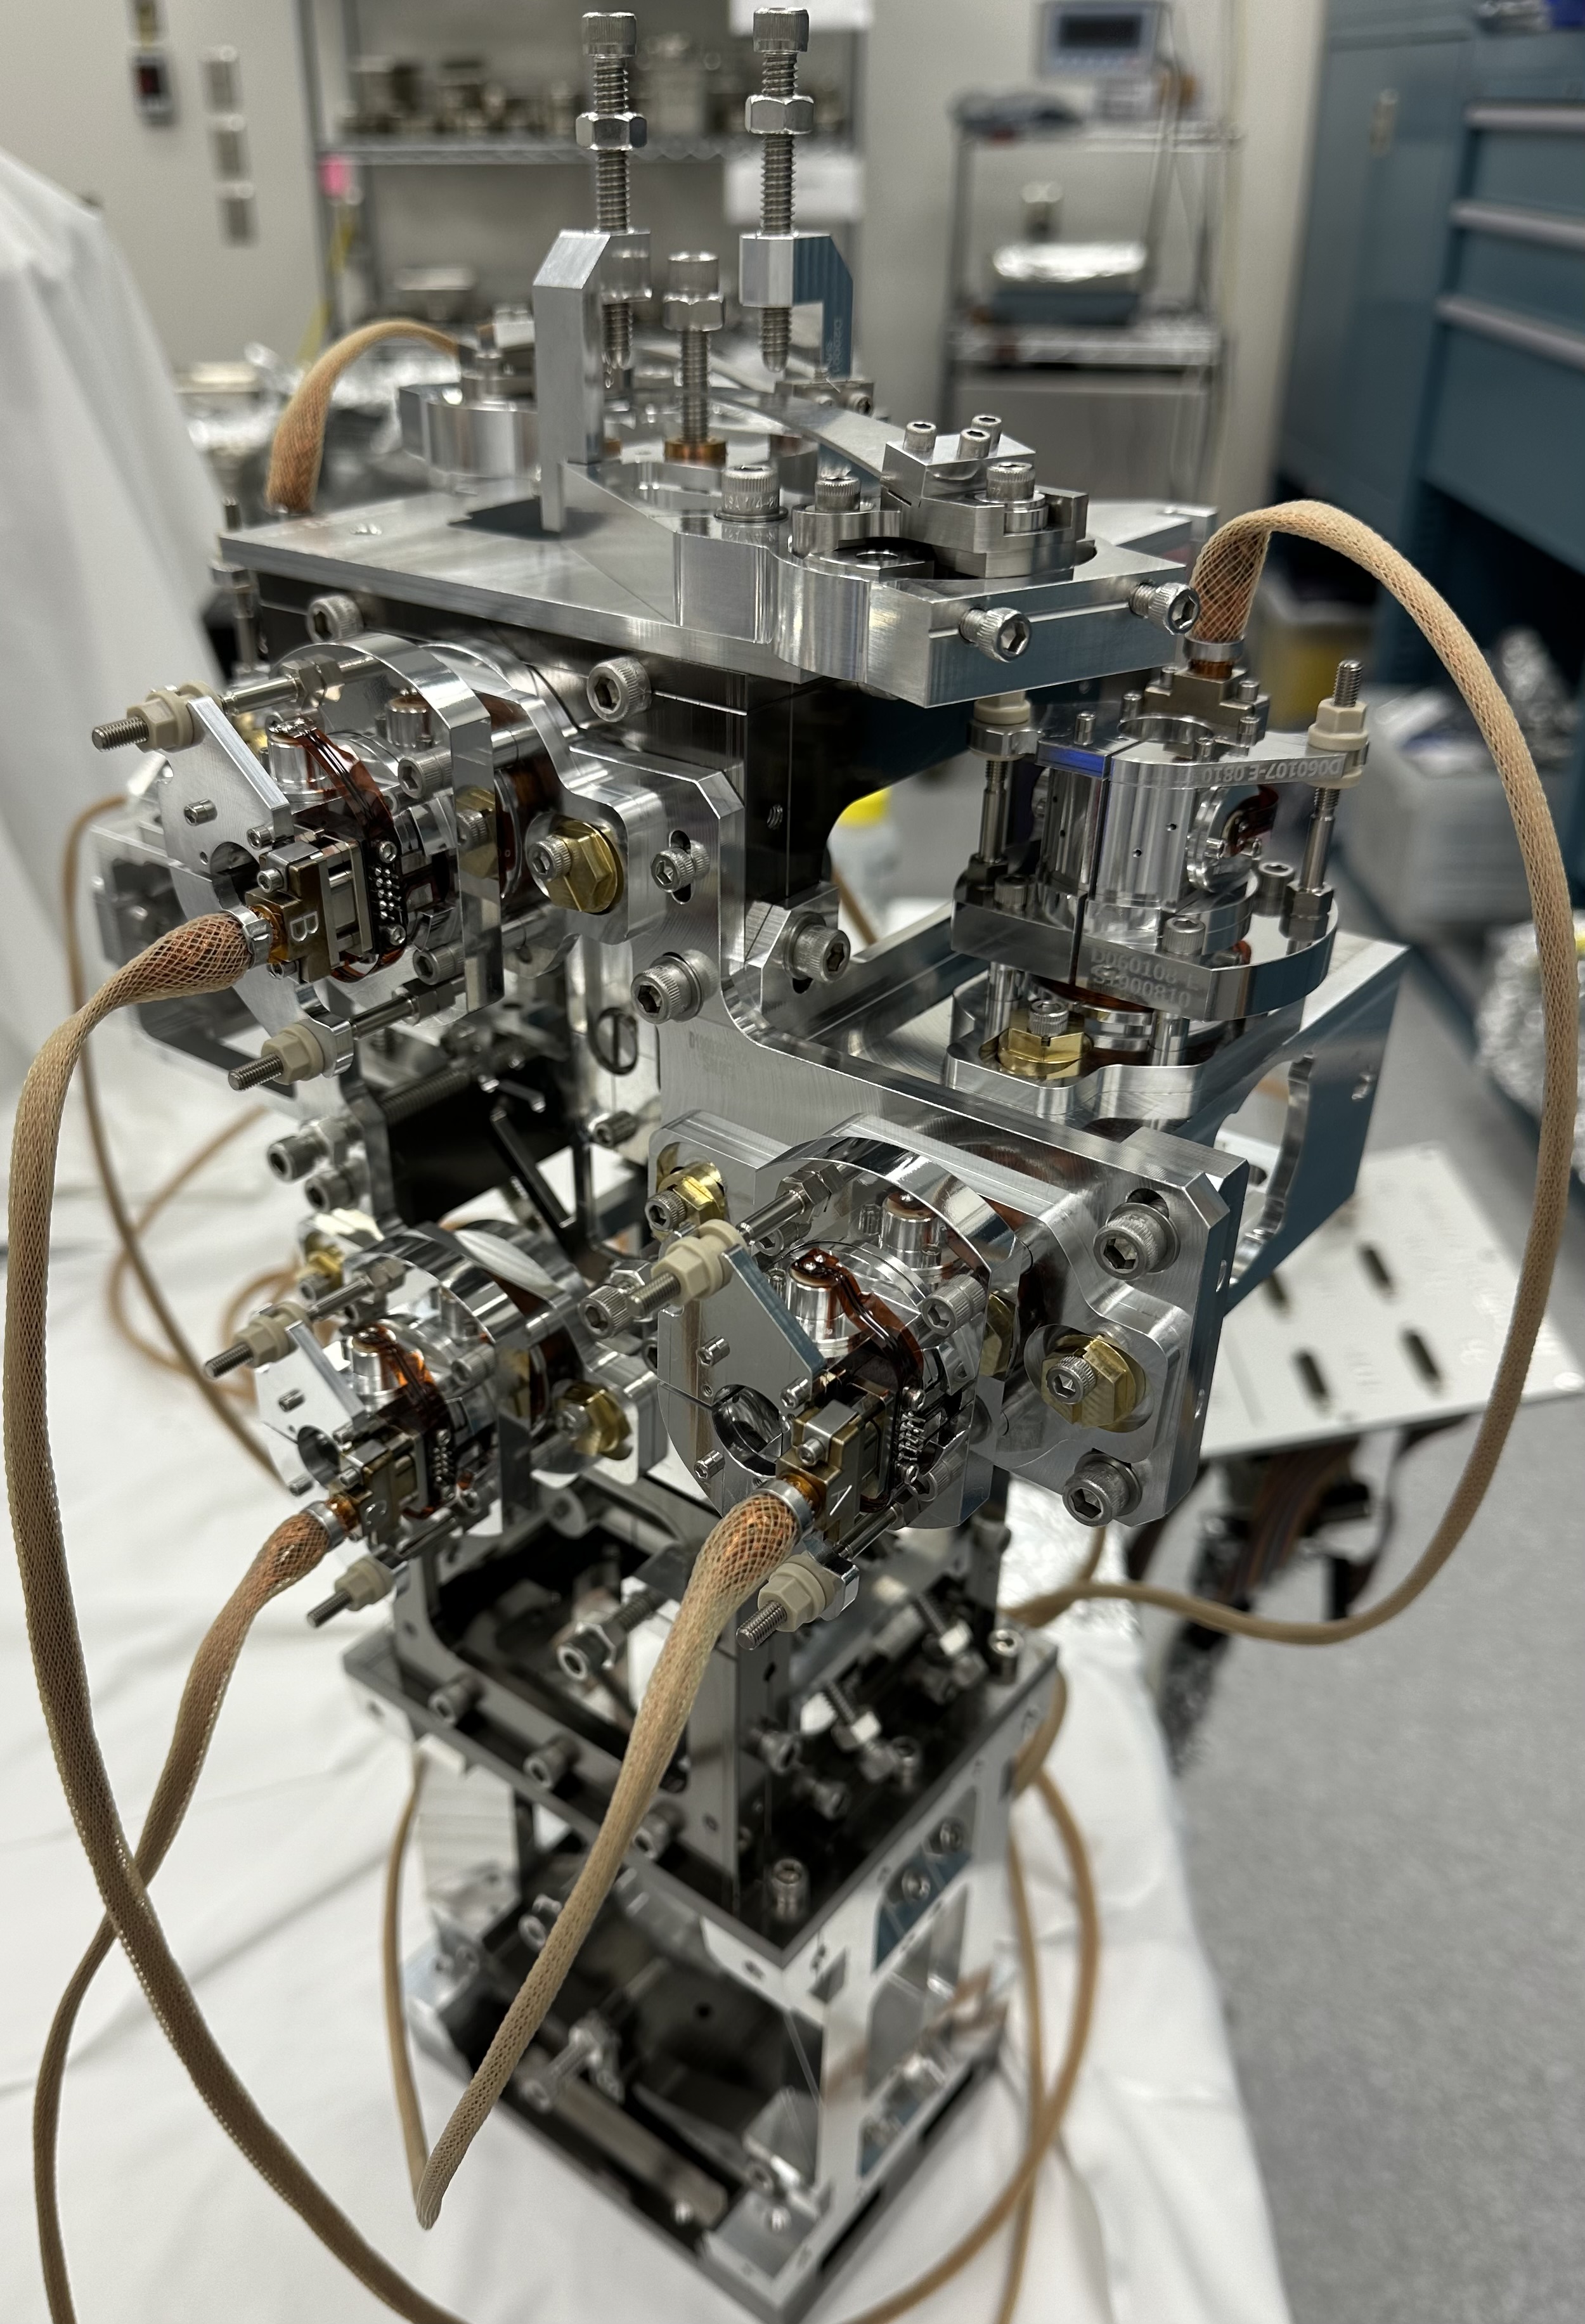
HRTS comes in two configuration, freestanding (table mounted which is discussed in this alog) and suspended (to be built, will be attached to the new beamsplitter suspension BBSS). The details about the assembly and characterization along with pictures are discussed below,
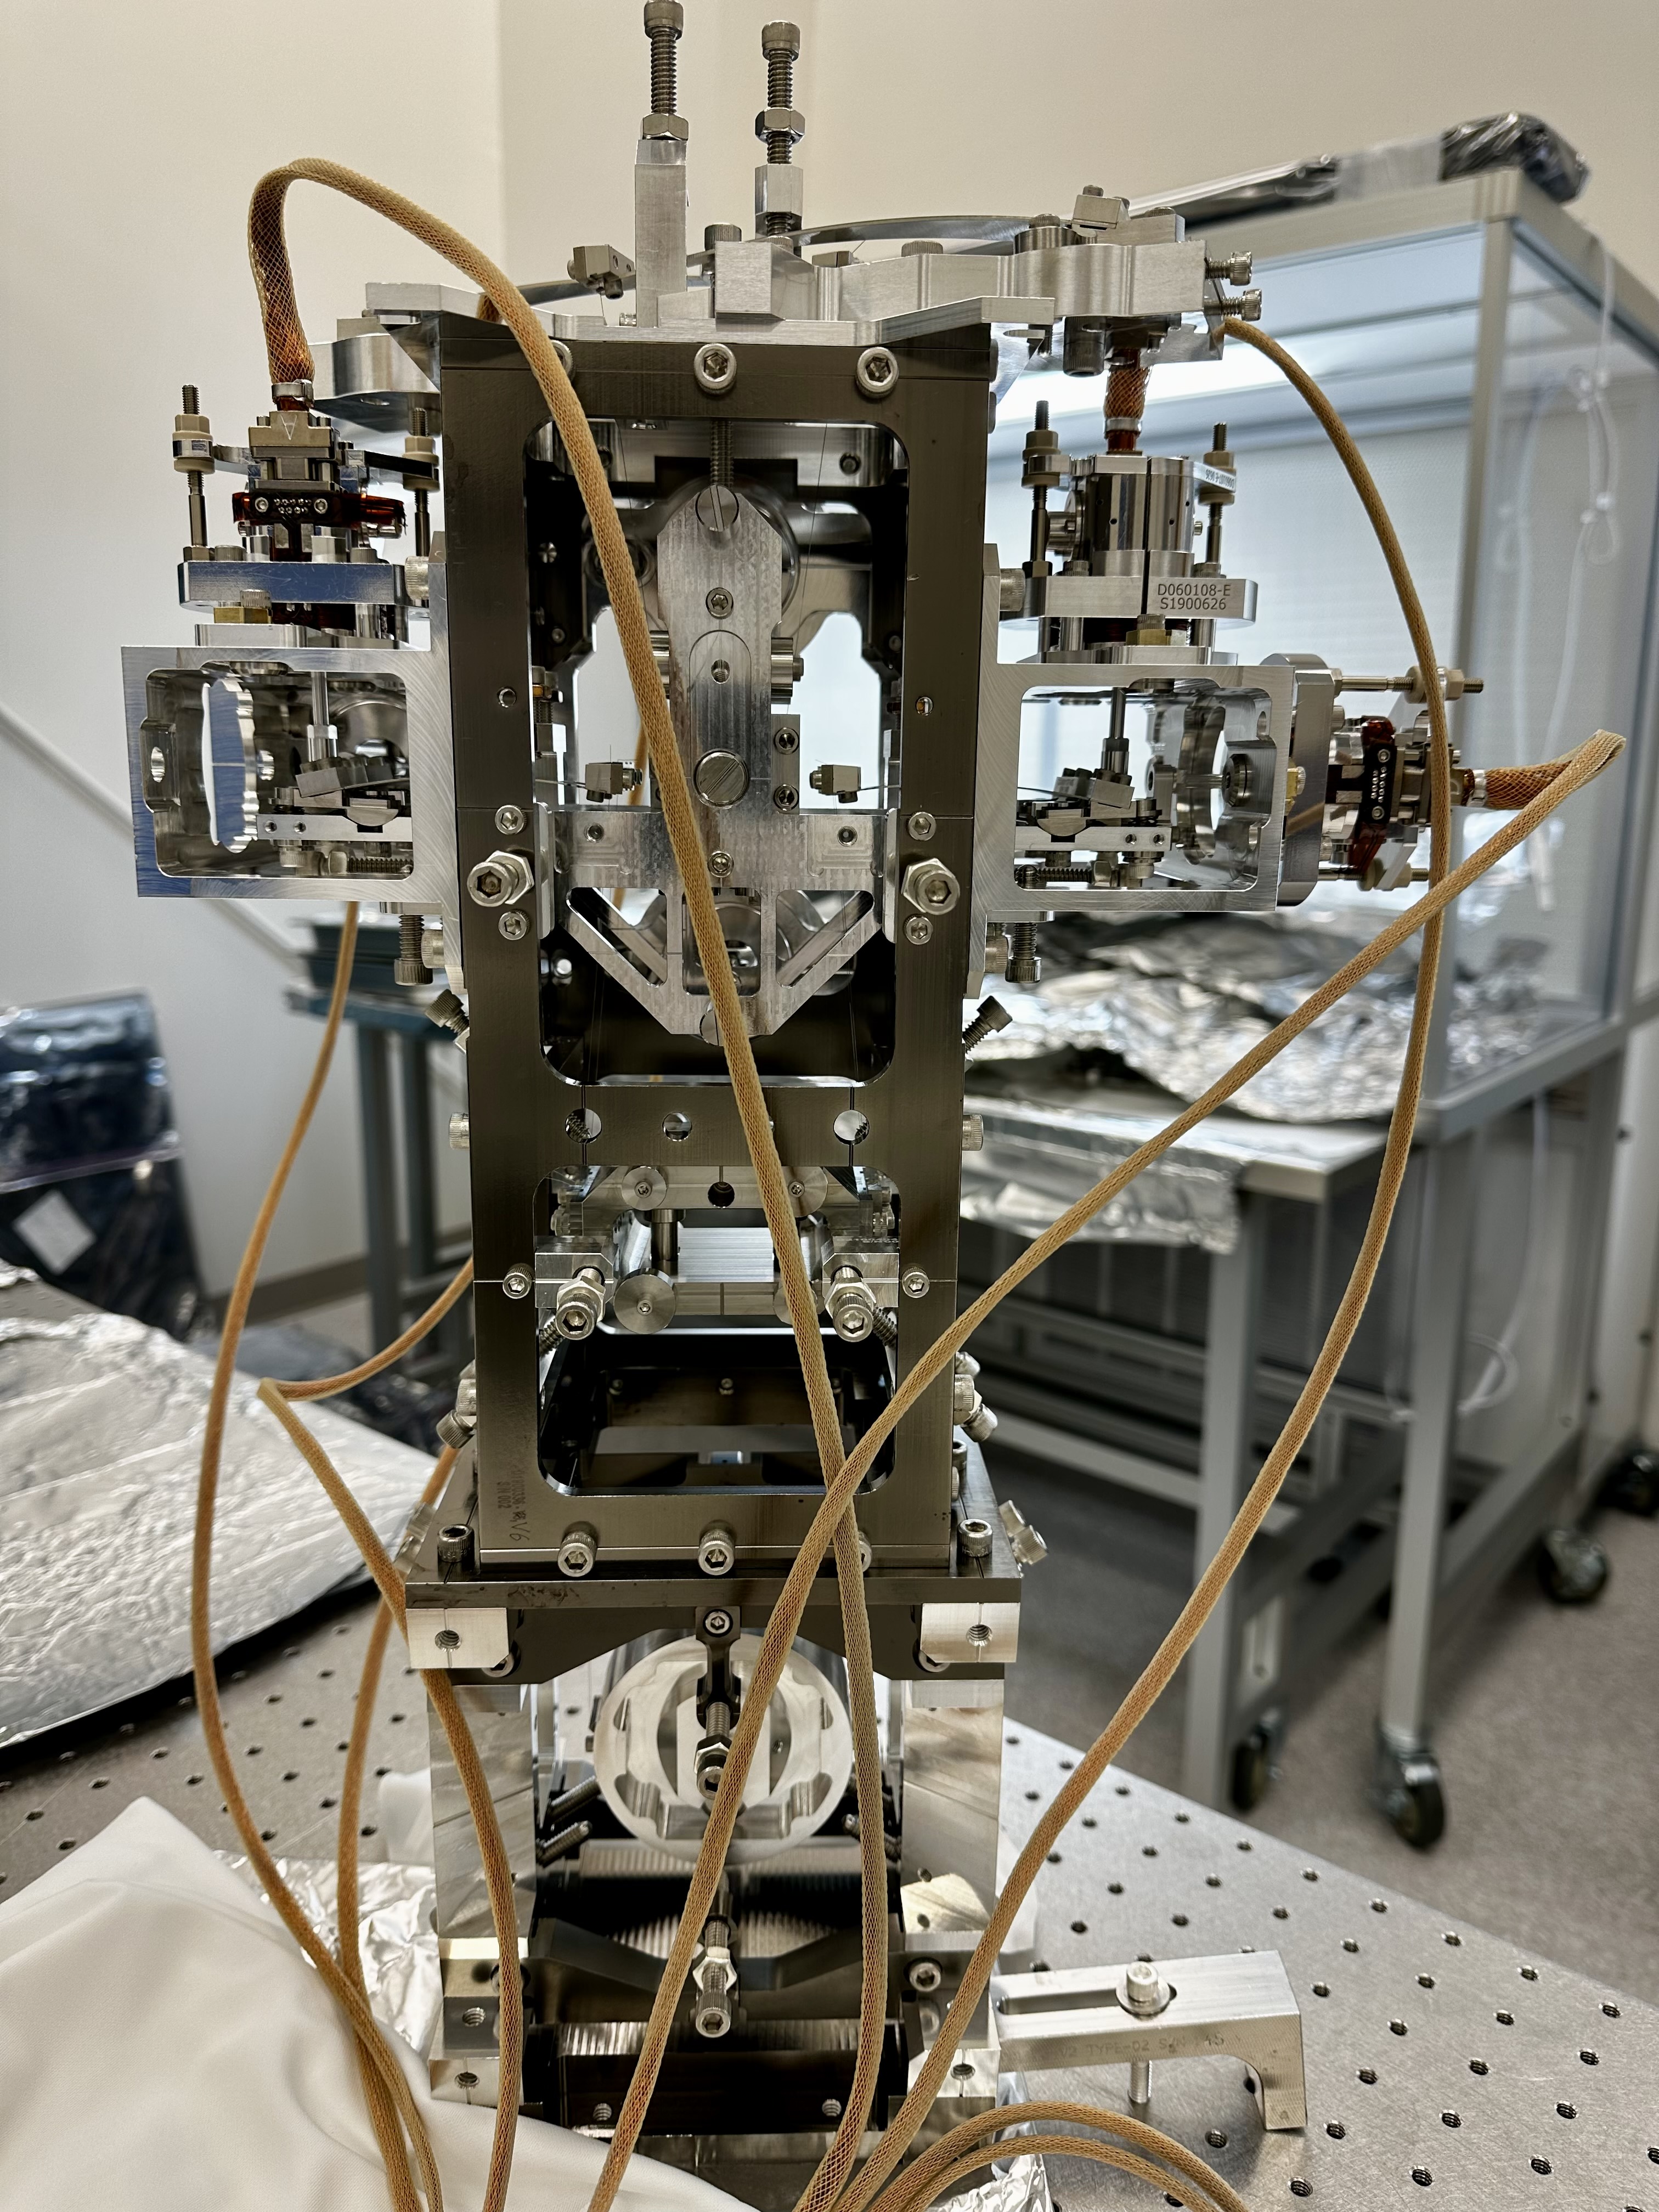
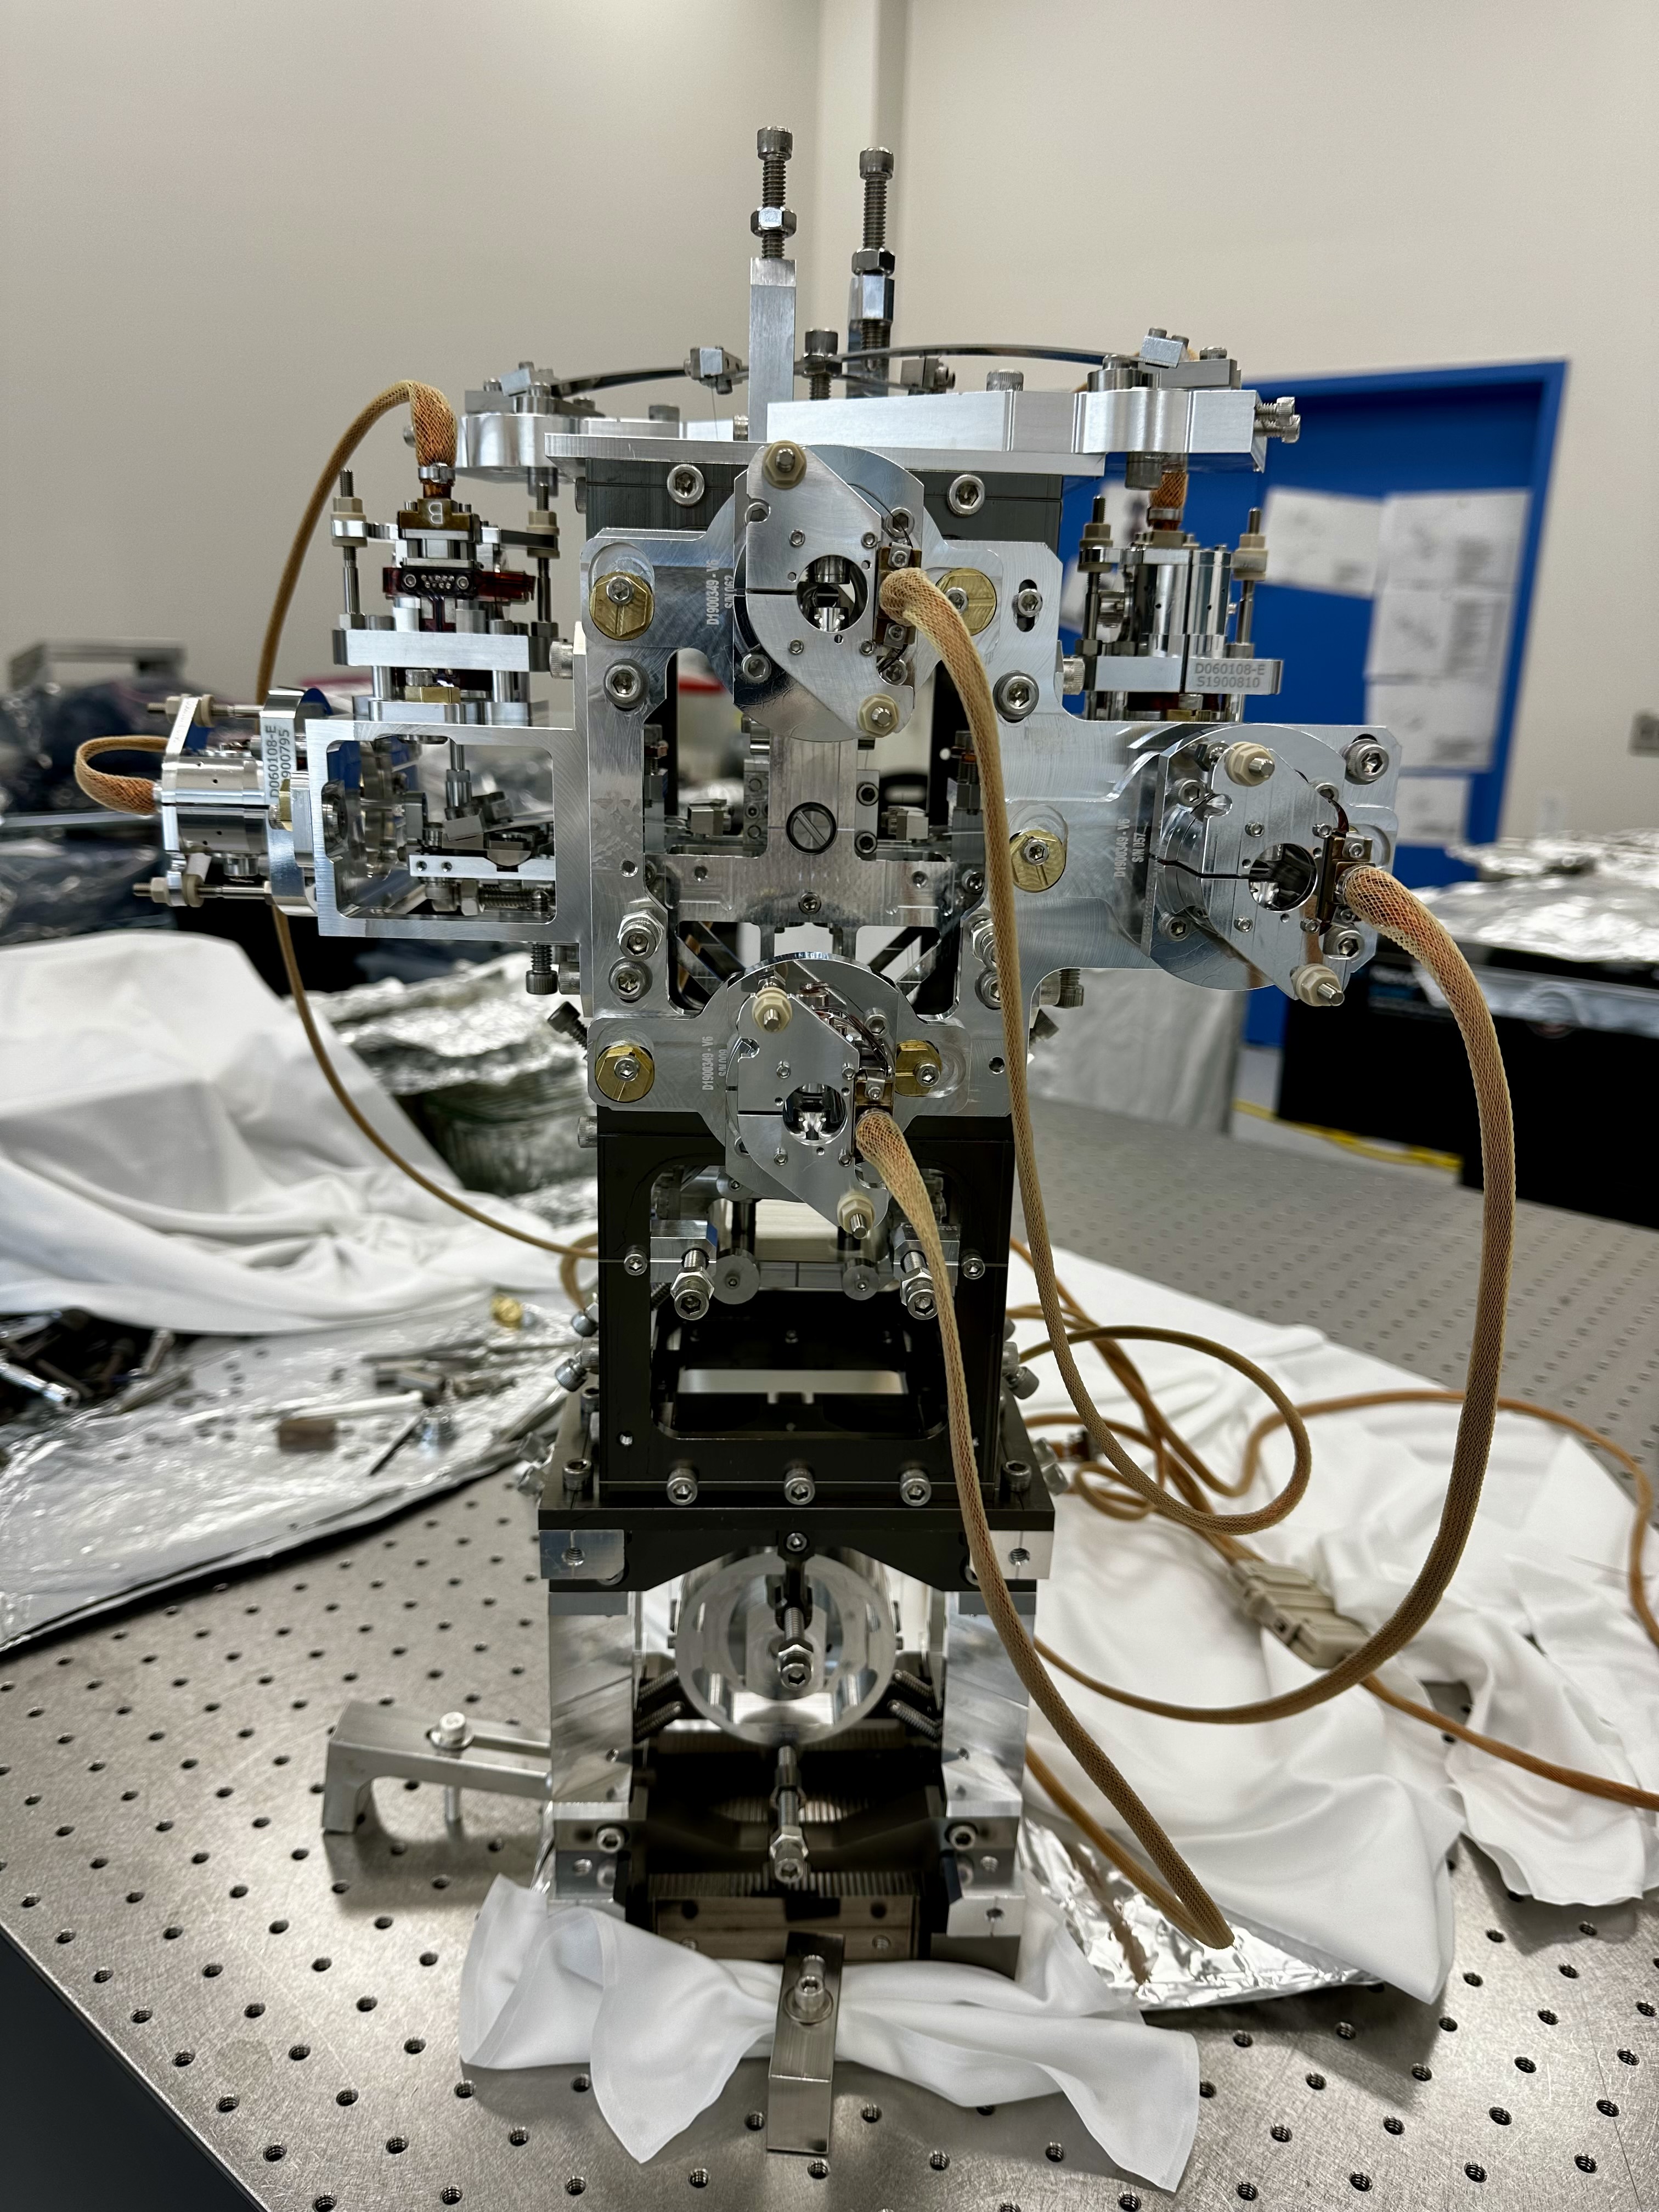
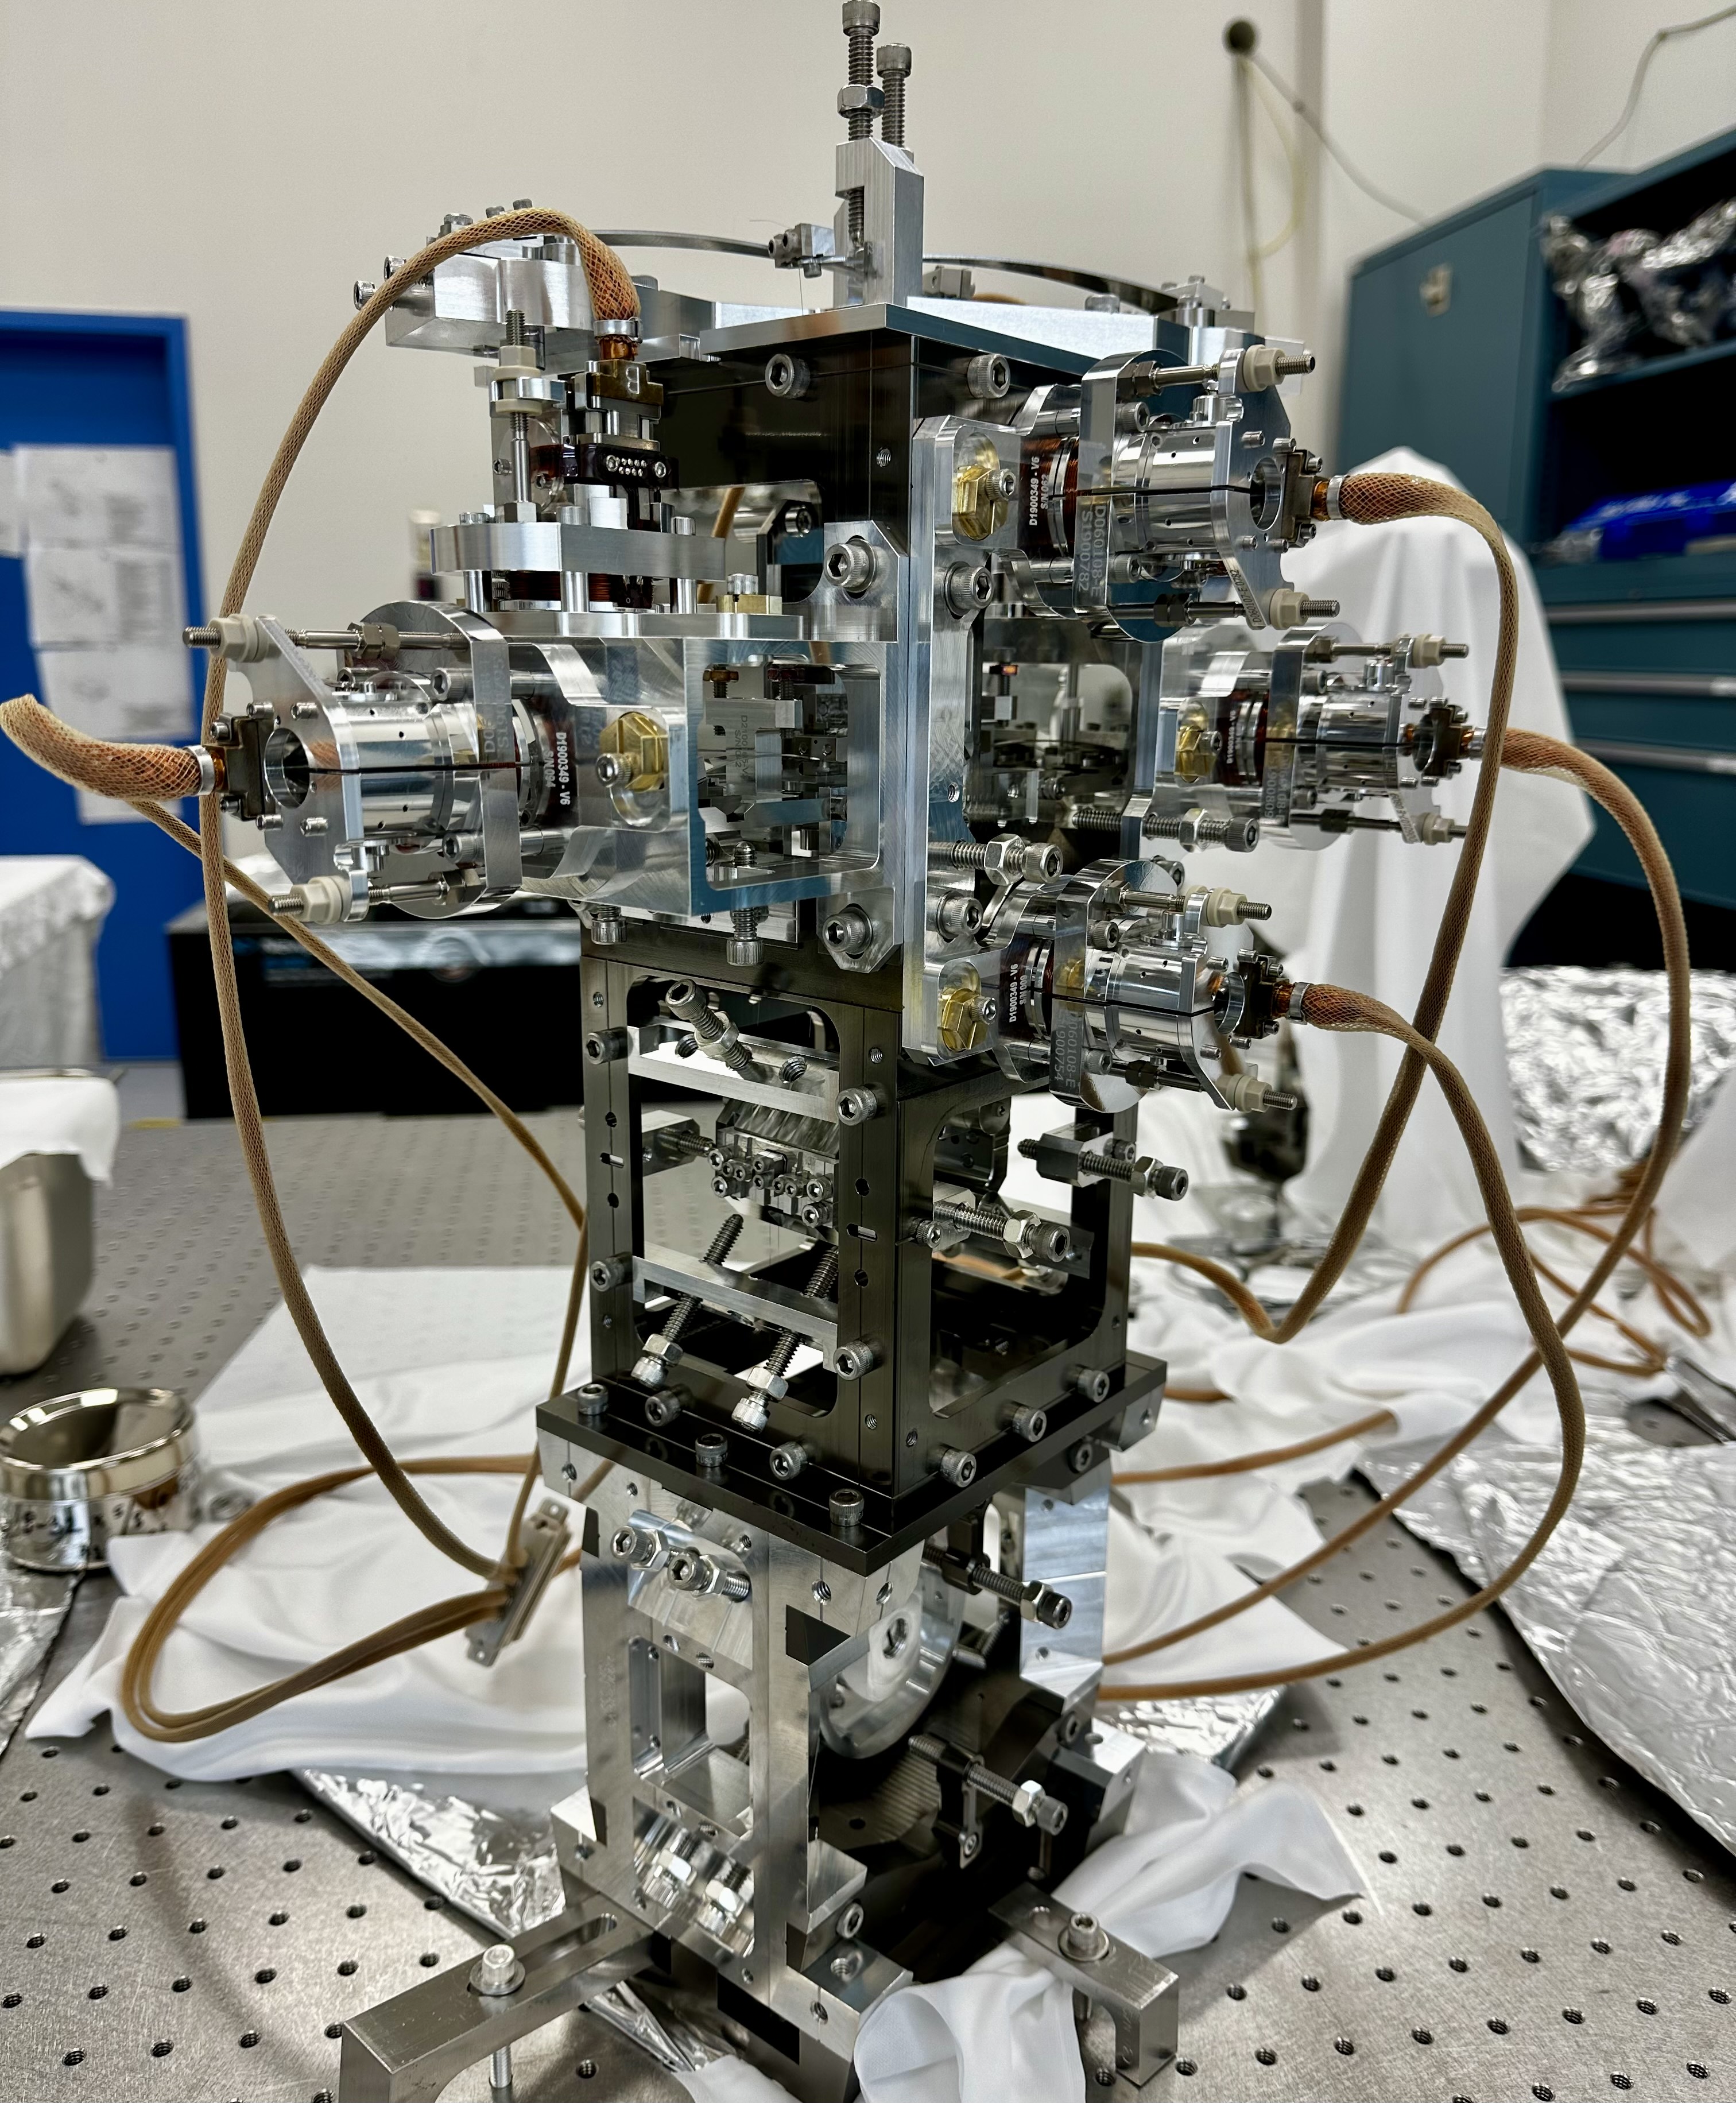
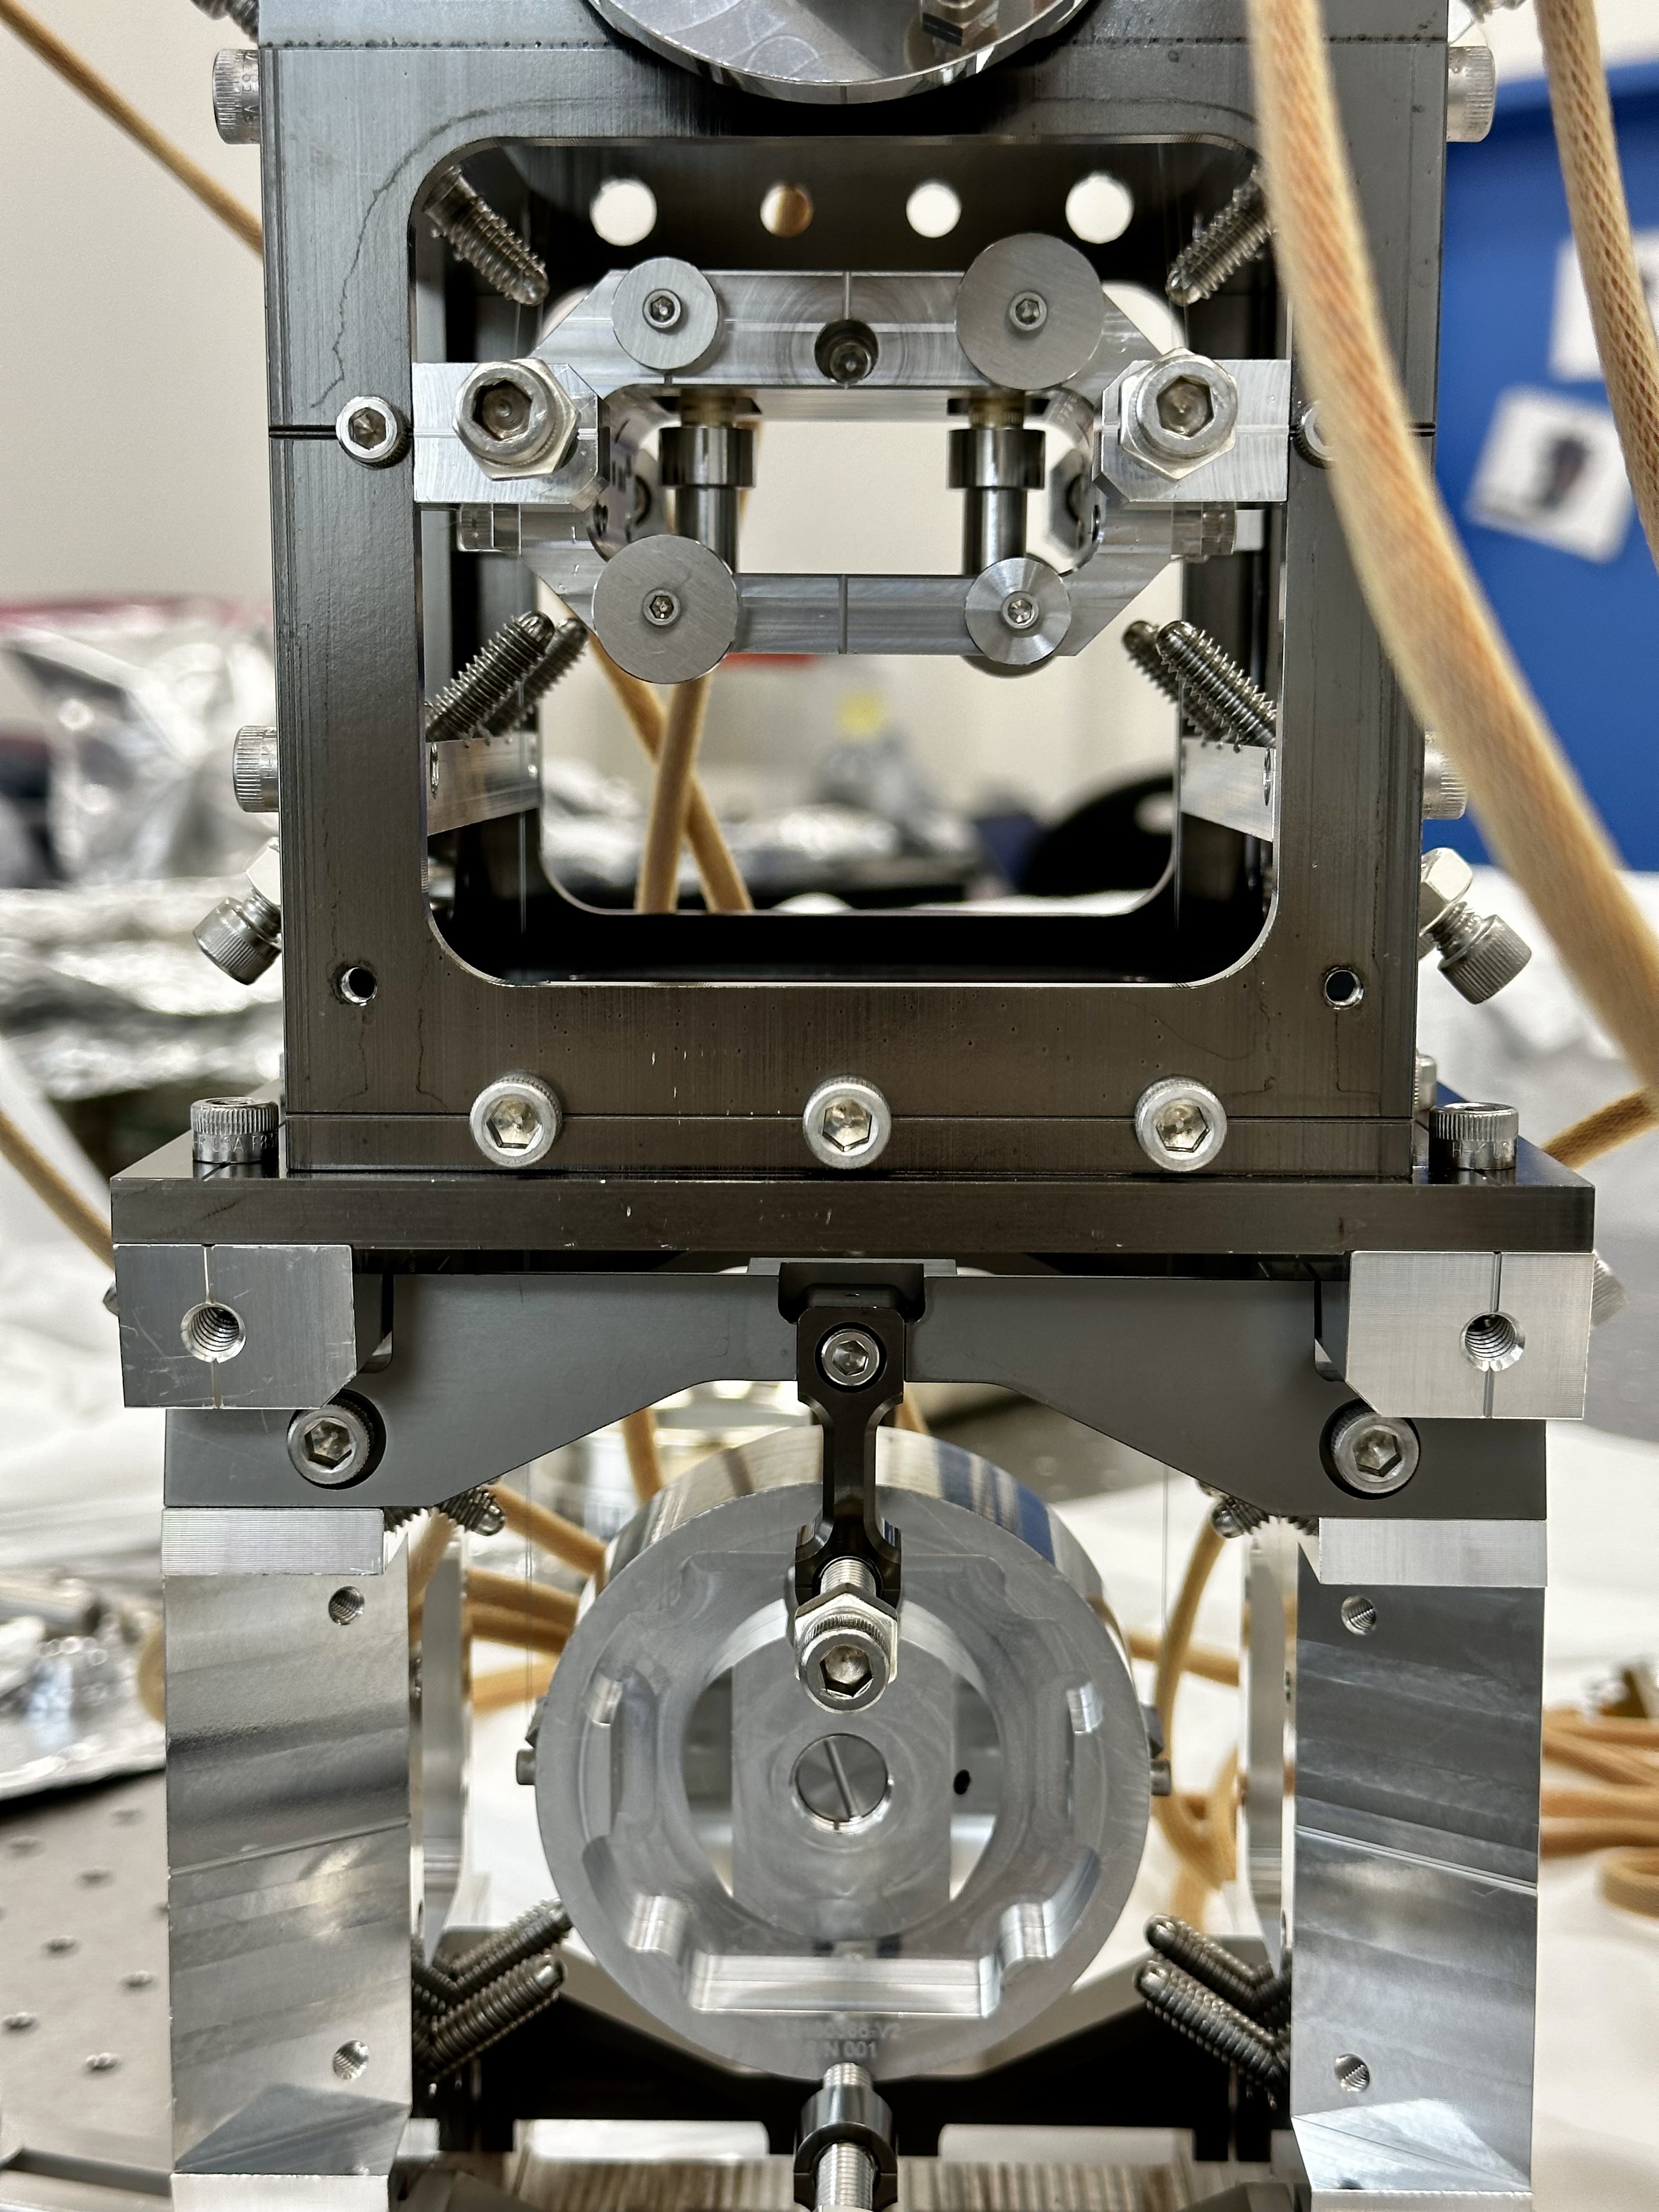
Attachment01 shows the AR side of the SUS, attachment02 shows the HR side. For isometric view, please see attachment03.
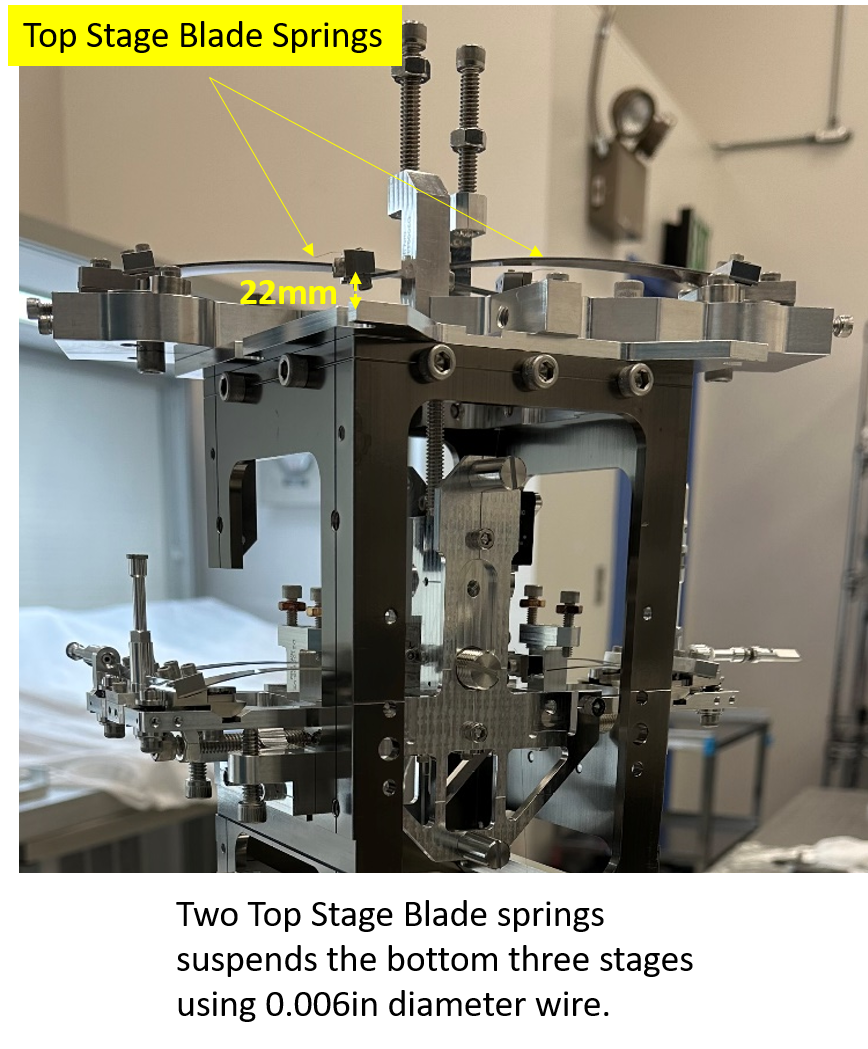
This multistage suspension (three suspended stages) has blade springs at the upper stage and top mass for vertical isolation. There are two blade springs at the very top stage (D2100389) as shown in the picture here. The blade spring are mounted on spring loaded clamps which can be adjusted for Yaw dof and height (sus point). The two wires (diameter 0.006in) from the two top stage blade springs suspends the Top Mass (D2100362) which has four blade springs, as shown here.
Wire diameters are as follows:-
Top Stage to Top Mass = 0.006in, length 115mm
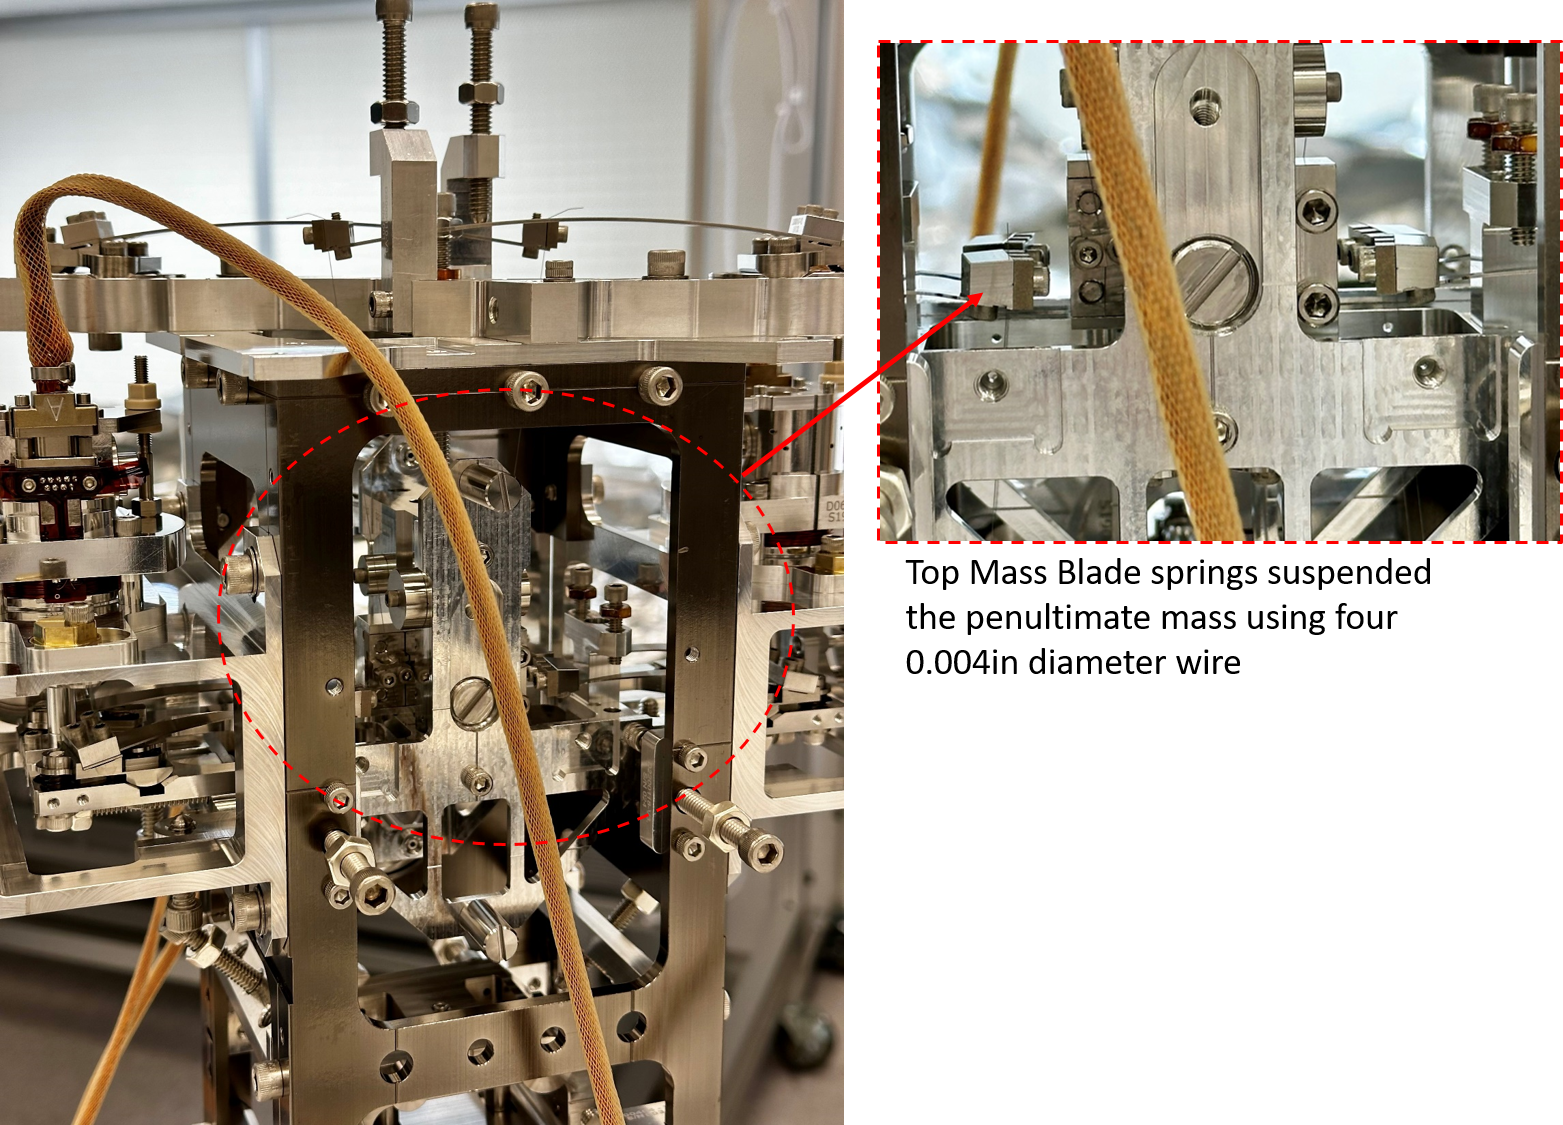
Top Mass to Penultimate Mass = 0.004in, length 115mm
Penultimate Mass to Optic = 0.0025in, length 160mm
Suspended masses (as per specifications):-
Top Mass = 750gm
Penultimate mass = 802gm
Dummy optic = 300gm
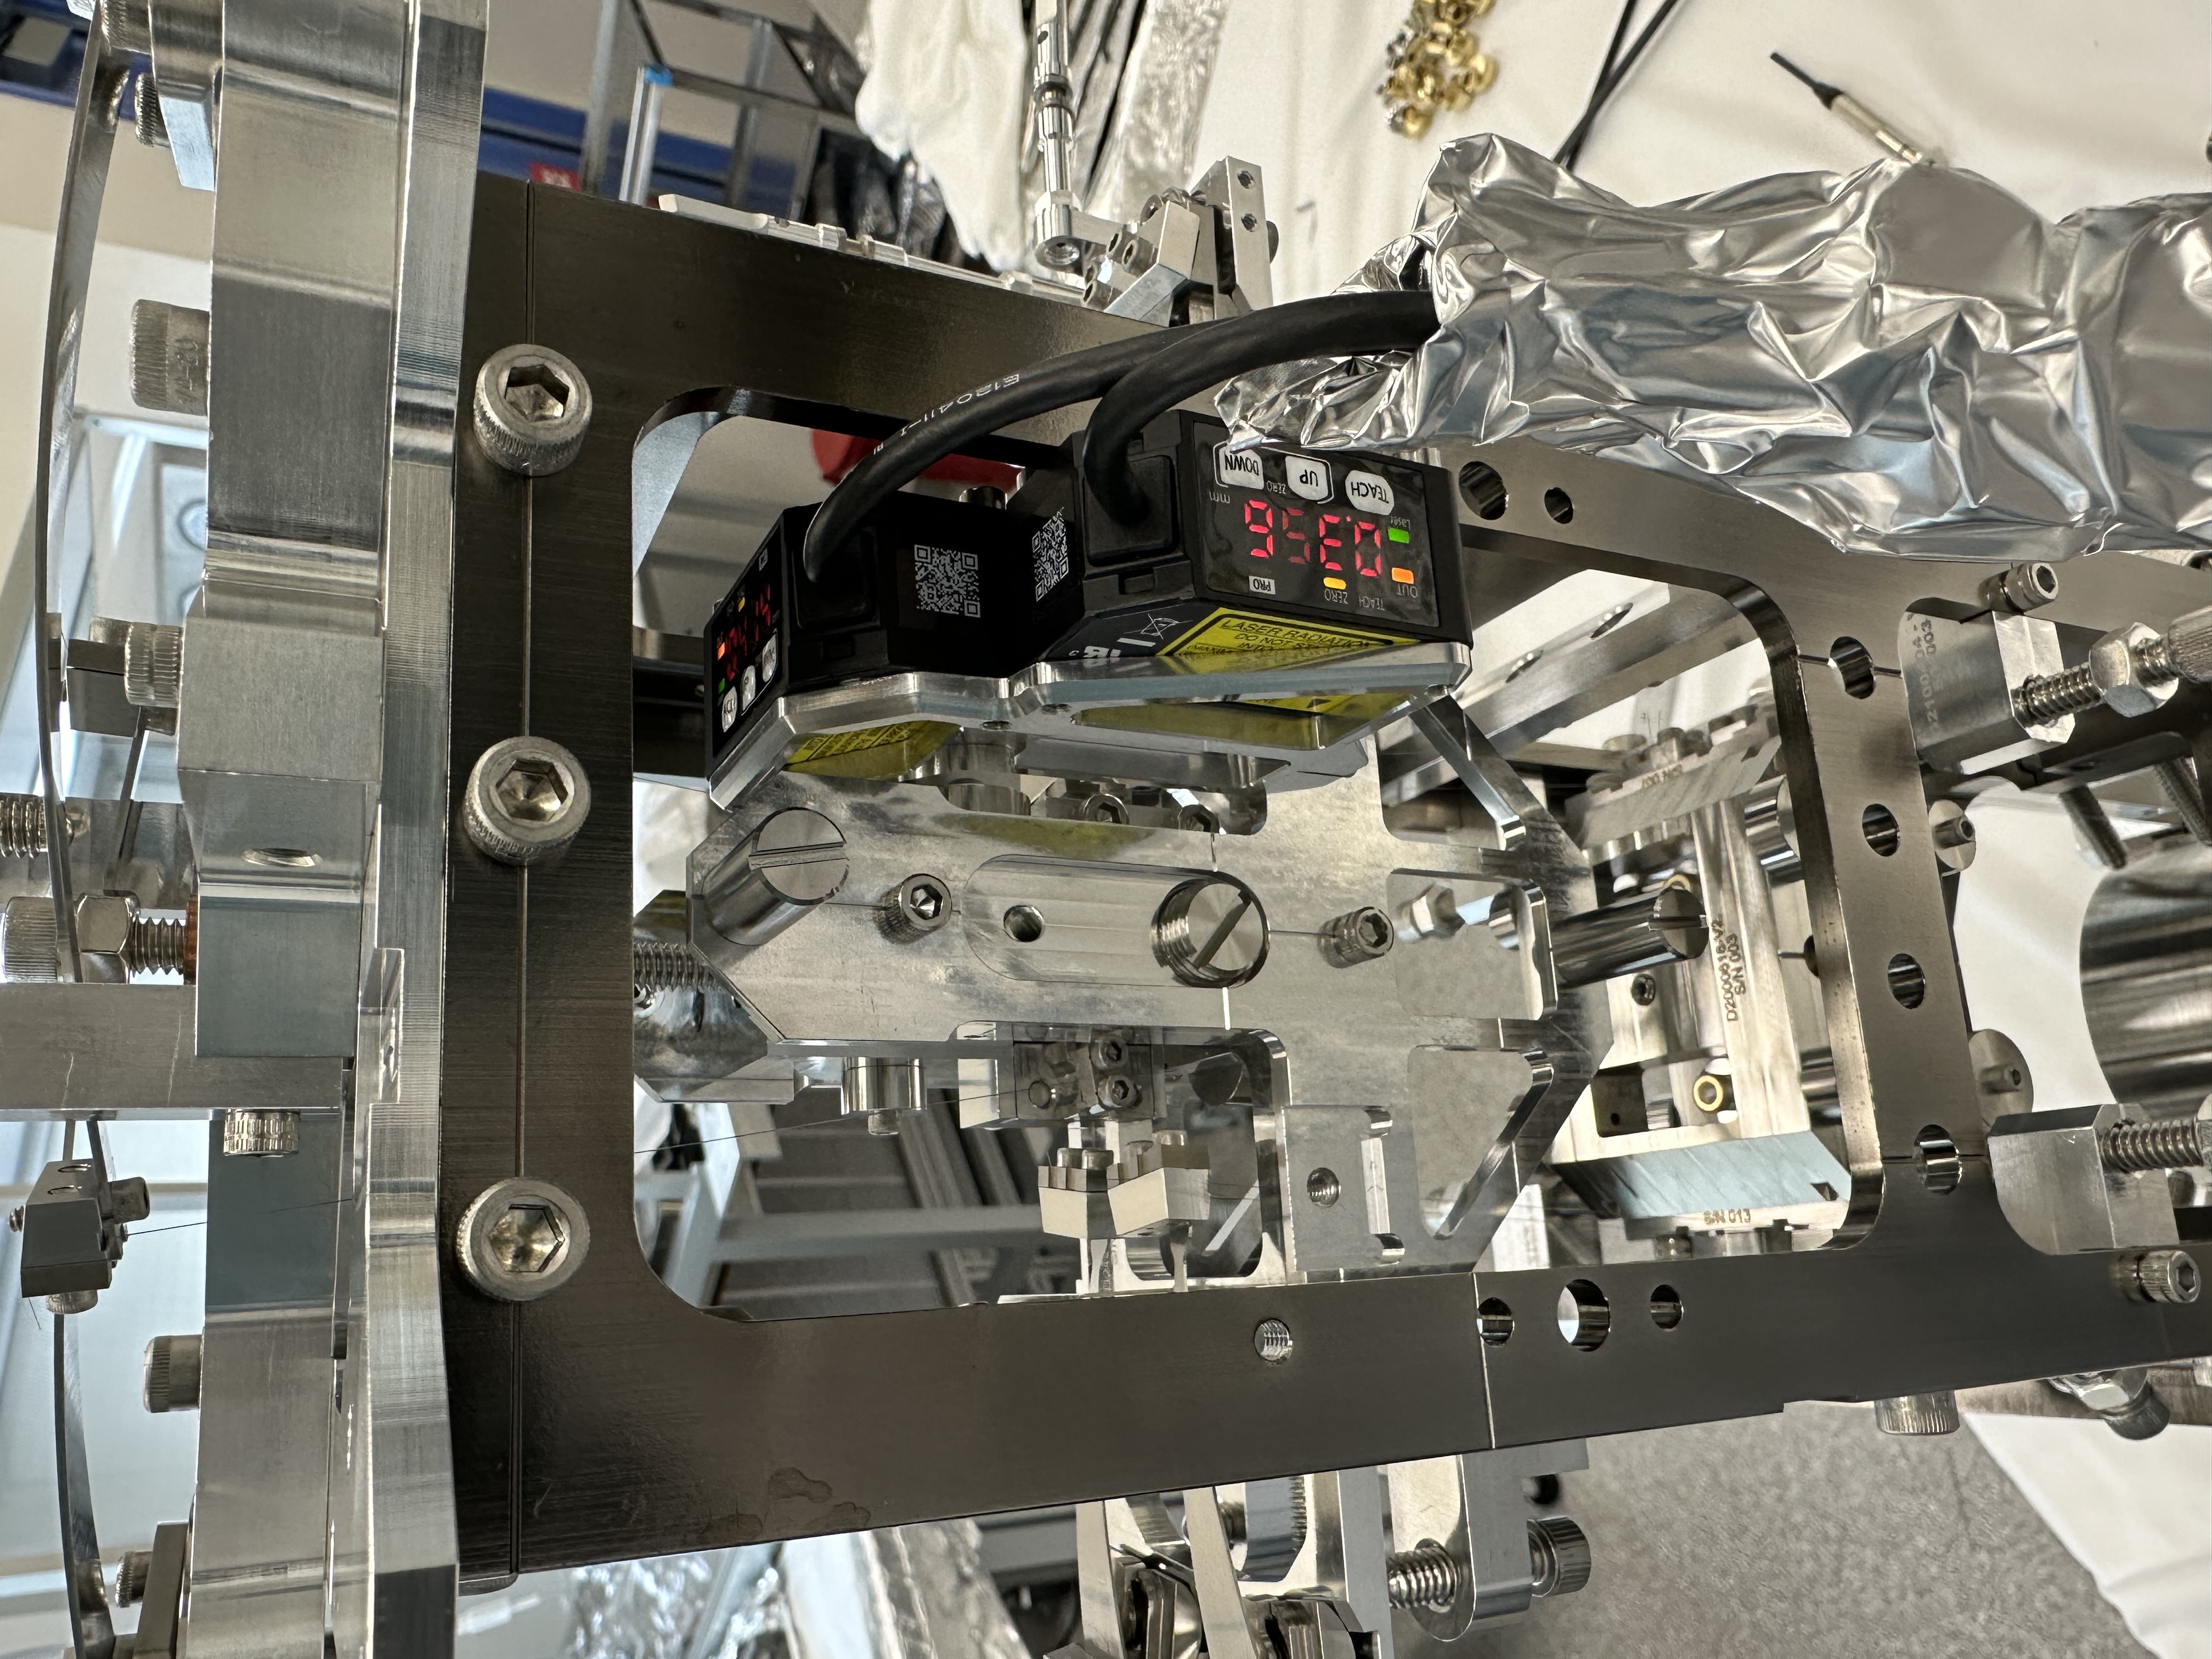
The Top Mass blade spring clamps are spring loaded (just like the top stage) which gives them the ability to adjust for blade tip height. We use a tool (T2400063) provided by the RAL UK team for measuring (while adjusting) the blade spring tip height (this tool can only be used for this stage) - as shown in this picture. A calibration block has also been provided for calibrating the tool before using it. The penultimate mass is suspended from the top mass blade springs using four wires of diameter 0.004in. The Optic (dummy optic for now) is suspended using two wires in a loop from the penultimate mass - see picture here. All the wires were pulled using their dedicated wire jigs, which defines the wire length and position within the wire clamps.
We had some issues with wire installation procedure (wires at the top mass stage kinks/breaking too often during handling). After discussions with colleagues here and at RAL we now have a new tool (currently under fabrication) which will aide in wire installation procedure. Also, with practice we are getting better at handling wires of this thickness (thinner than human hair).
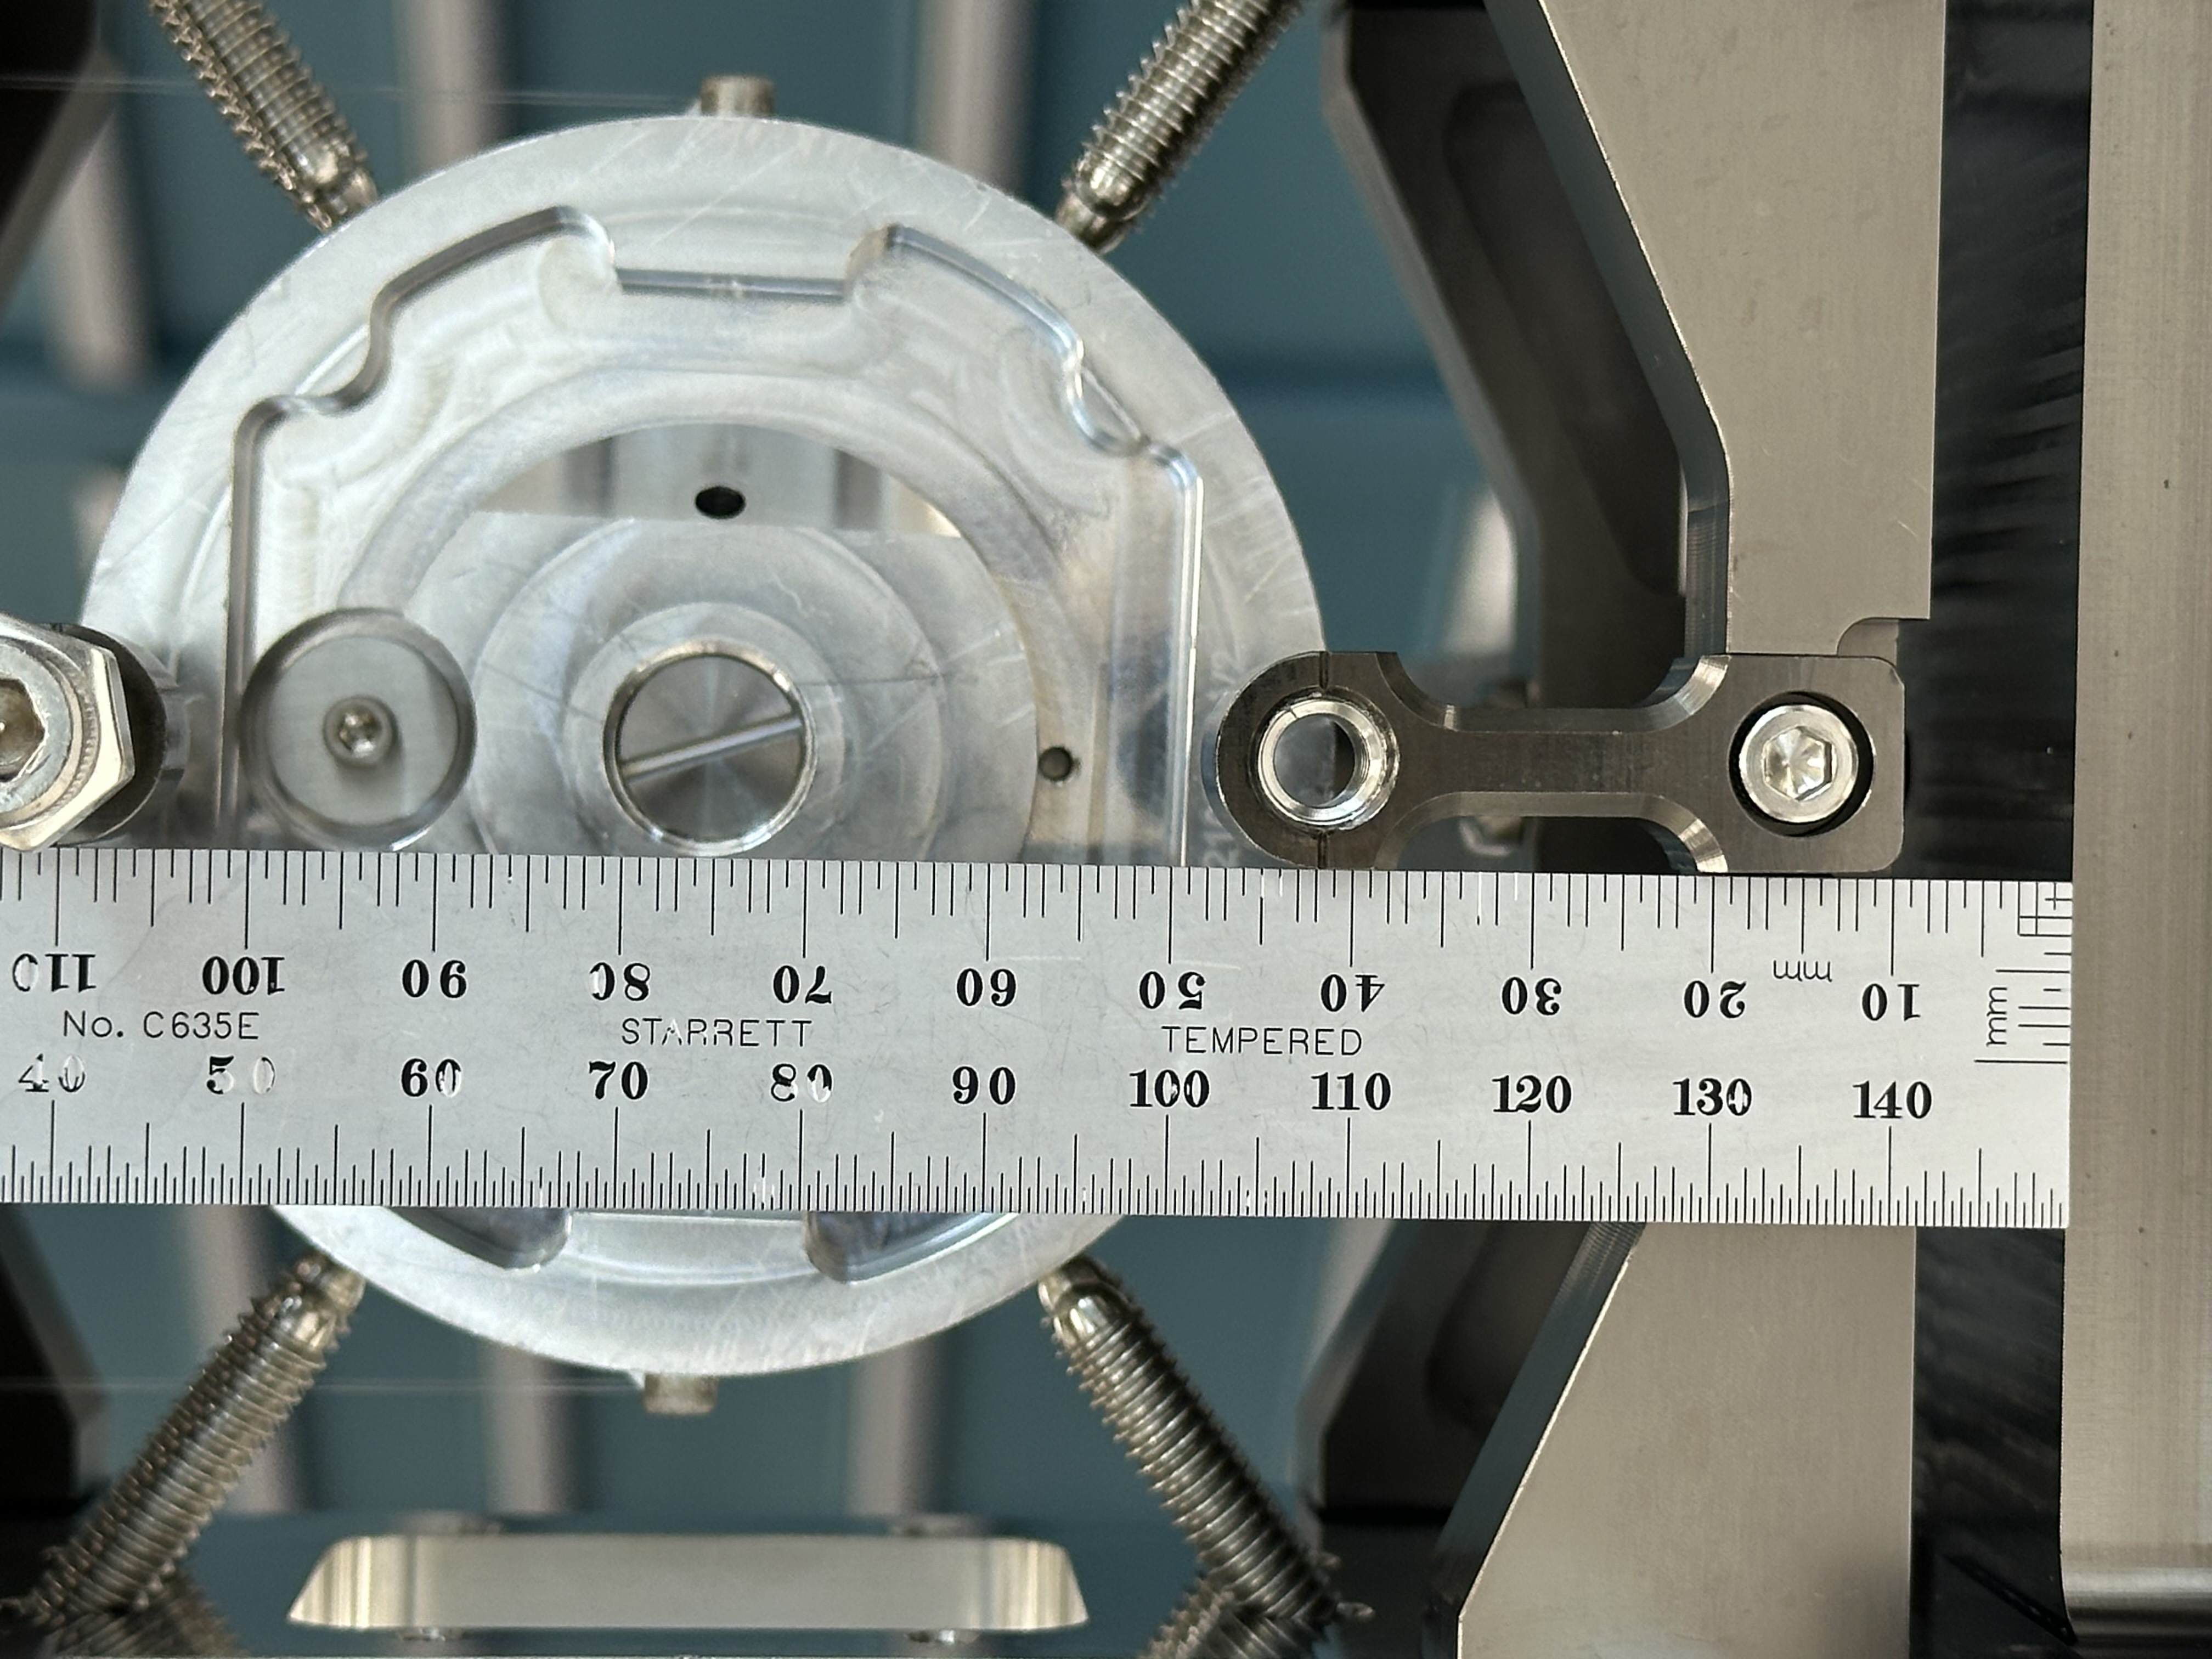
Once the assembly was complete, we measured and adjusted the height of the top stage blade springs, which comes out to be 22.5mm from the top plate. This adjustment was made to lower the entire chain such that each stage aligns with their respective position, as marked on the frame. The bottom edge of the dummy optic is now approximately suspended at 40.5mm from bottom of the frame (s/n 002) - which as per the design specifications. The other degrees of freedom like pitch, yaw, roll also looks respectable without any major adjustment, although we can further improve the pitch on penultimate mass (using balance mass and pitch adjuster mechanism provided at two stages).
HRTS is controlled using six BOSEMs, their flag/magnet attachment are as per the controls arrangement document E2300341. After attaching the BOSEMs and with little adjustment all six flags looked nicely centered.
Before centering them we measured their Open Light Current (OLC) and calculated the offsets and gains which are as follows,
|
BOSEM D060106-E (s/n) |
OLC |
Offsets (-OLC/2) |
Gain (30,000/OLC) |
|
F1 (S1900810) |
26807 |
-13403.5 |
1.119 |
|
F2 (S1900795) |
31010 |
-15505 |
0.967 |
|
F3(S1900754) |
30165 |
-15082.5 |
0.994 |
|
LF(S1900809) |
29316 |
-14658 |
1.023 |
|
RT(S1900782) |
28820 |
-14410 |
1.040 |
|
SD(S1900626) |
26768 |
-13384 |
1.120 |
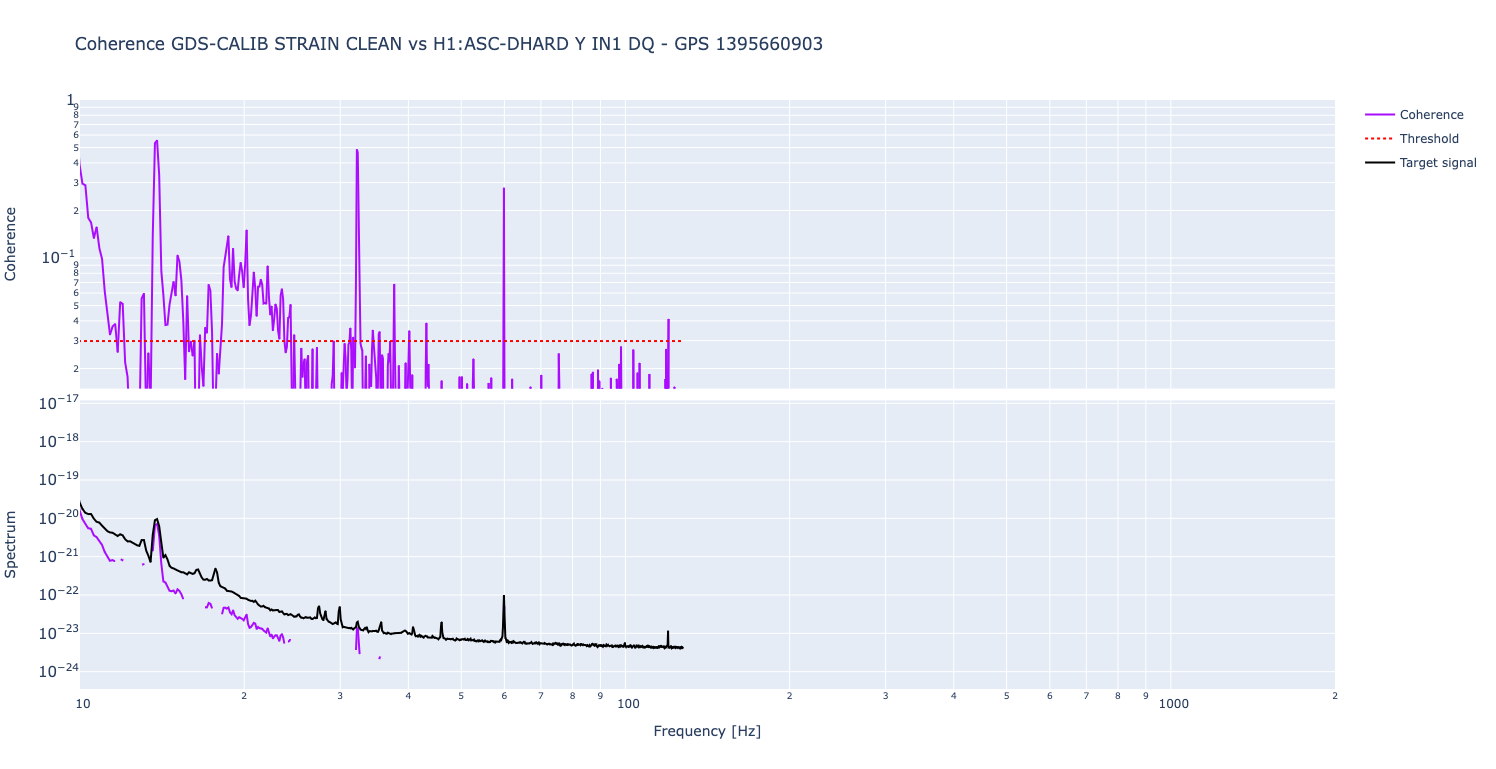
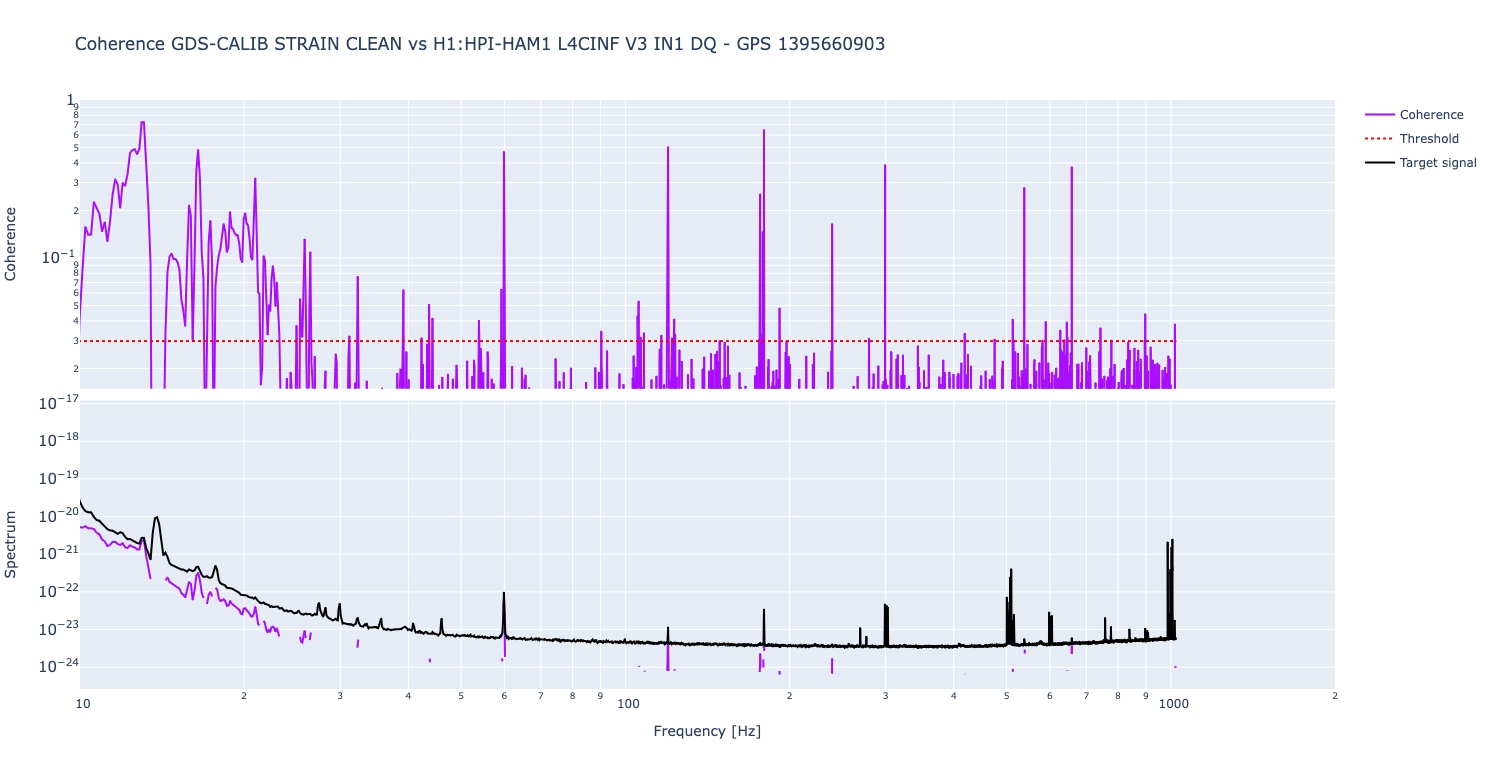
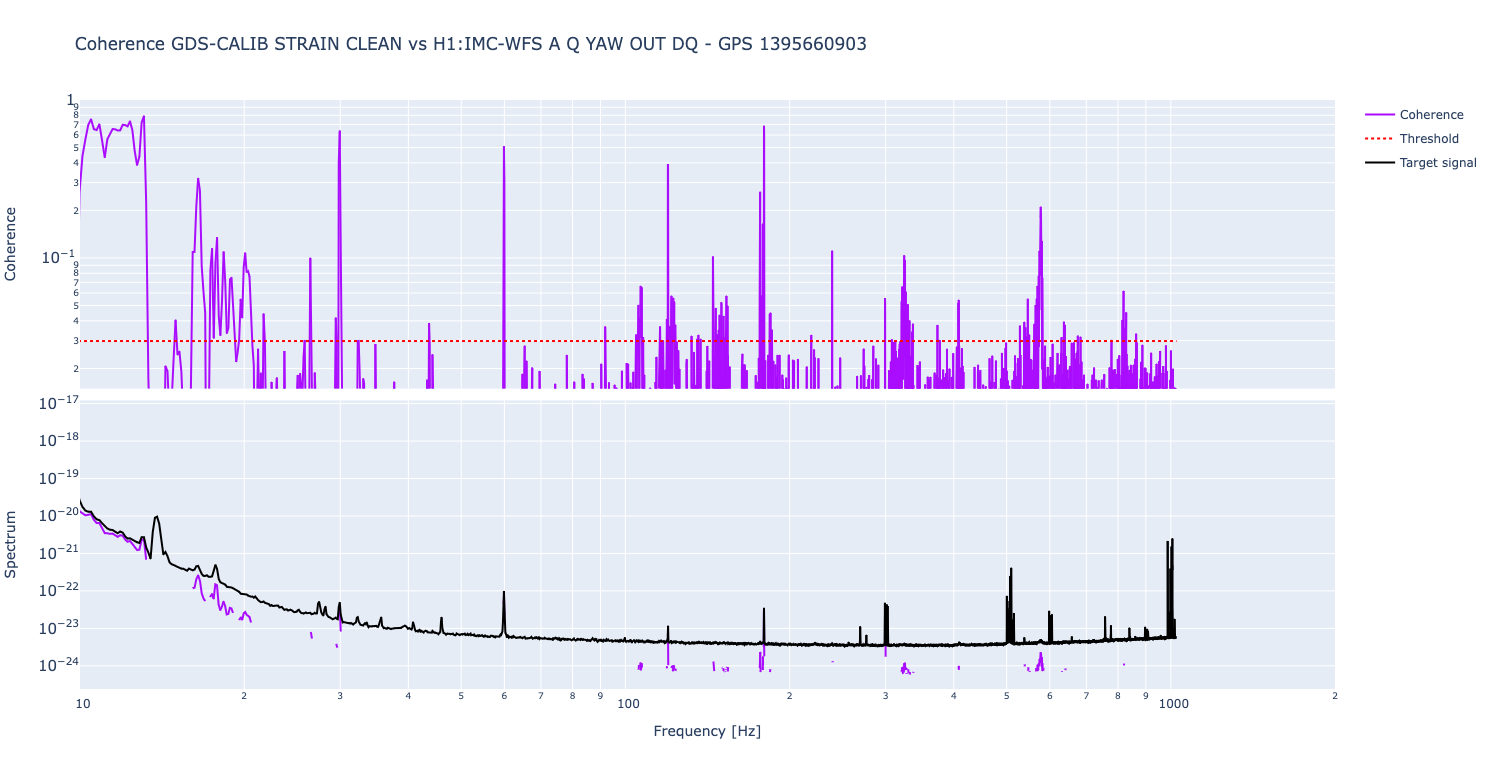
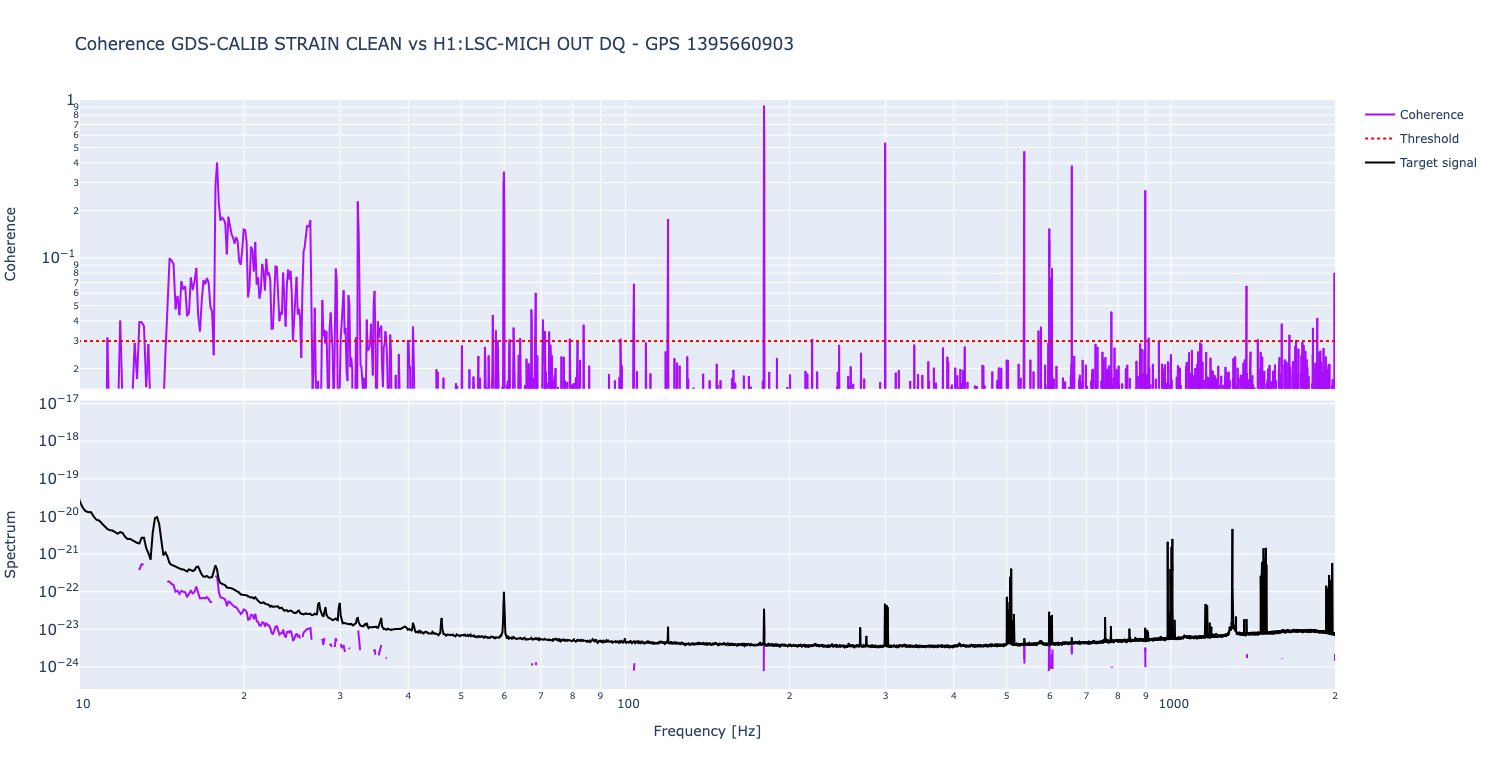
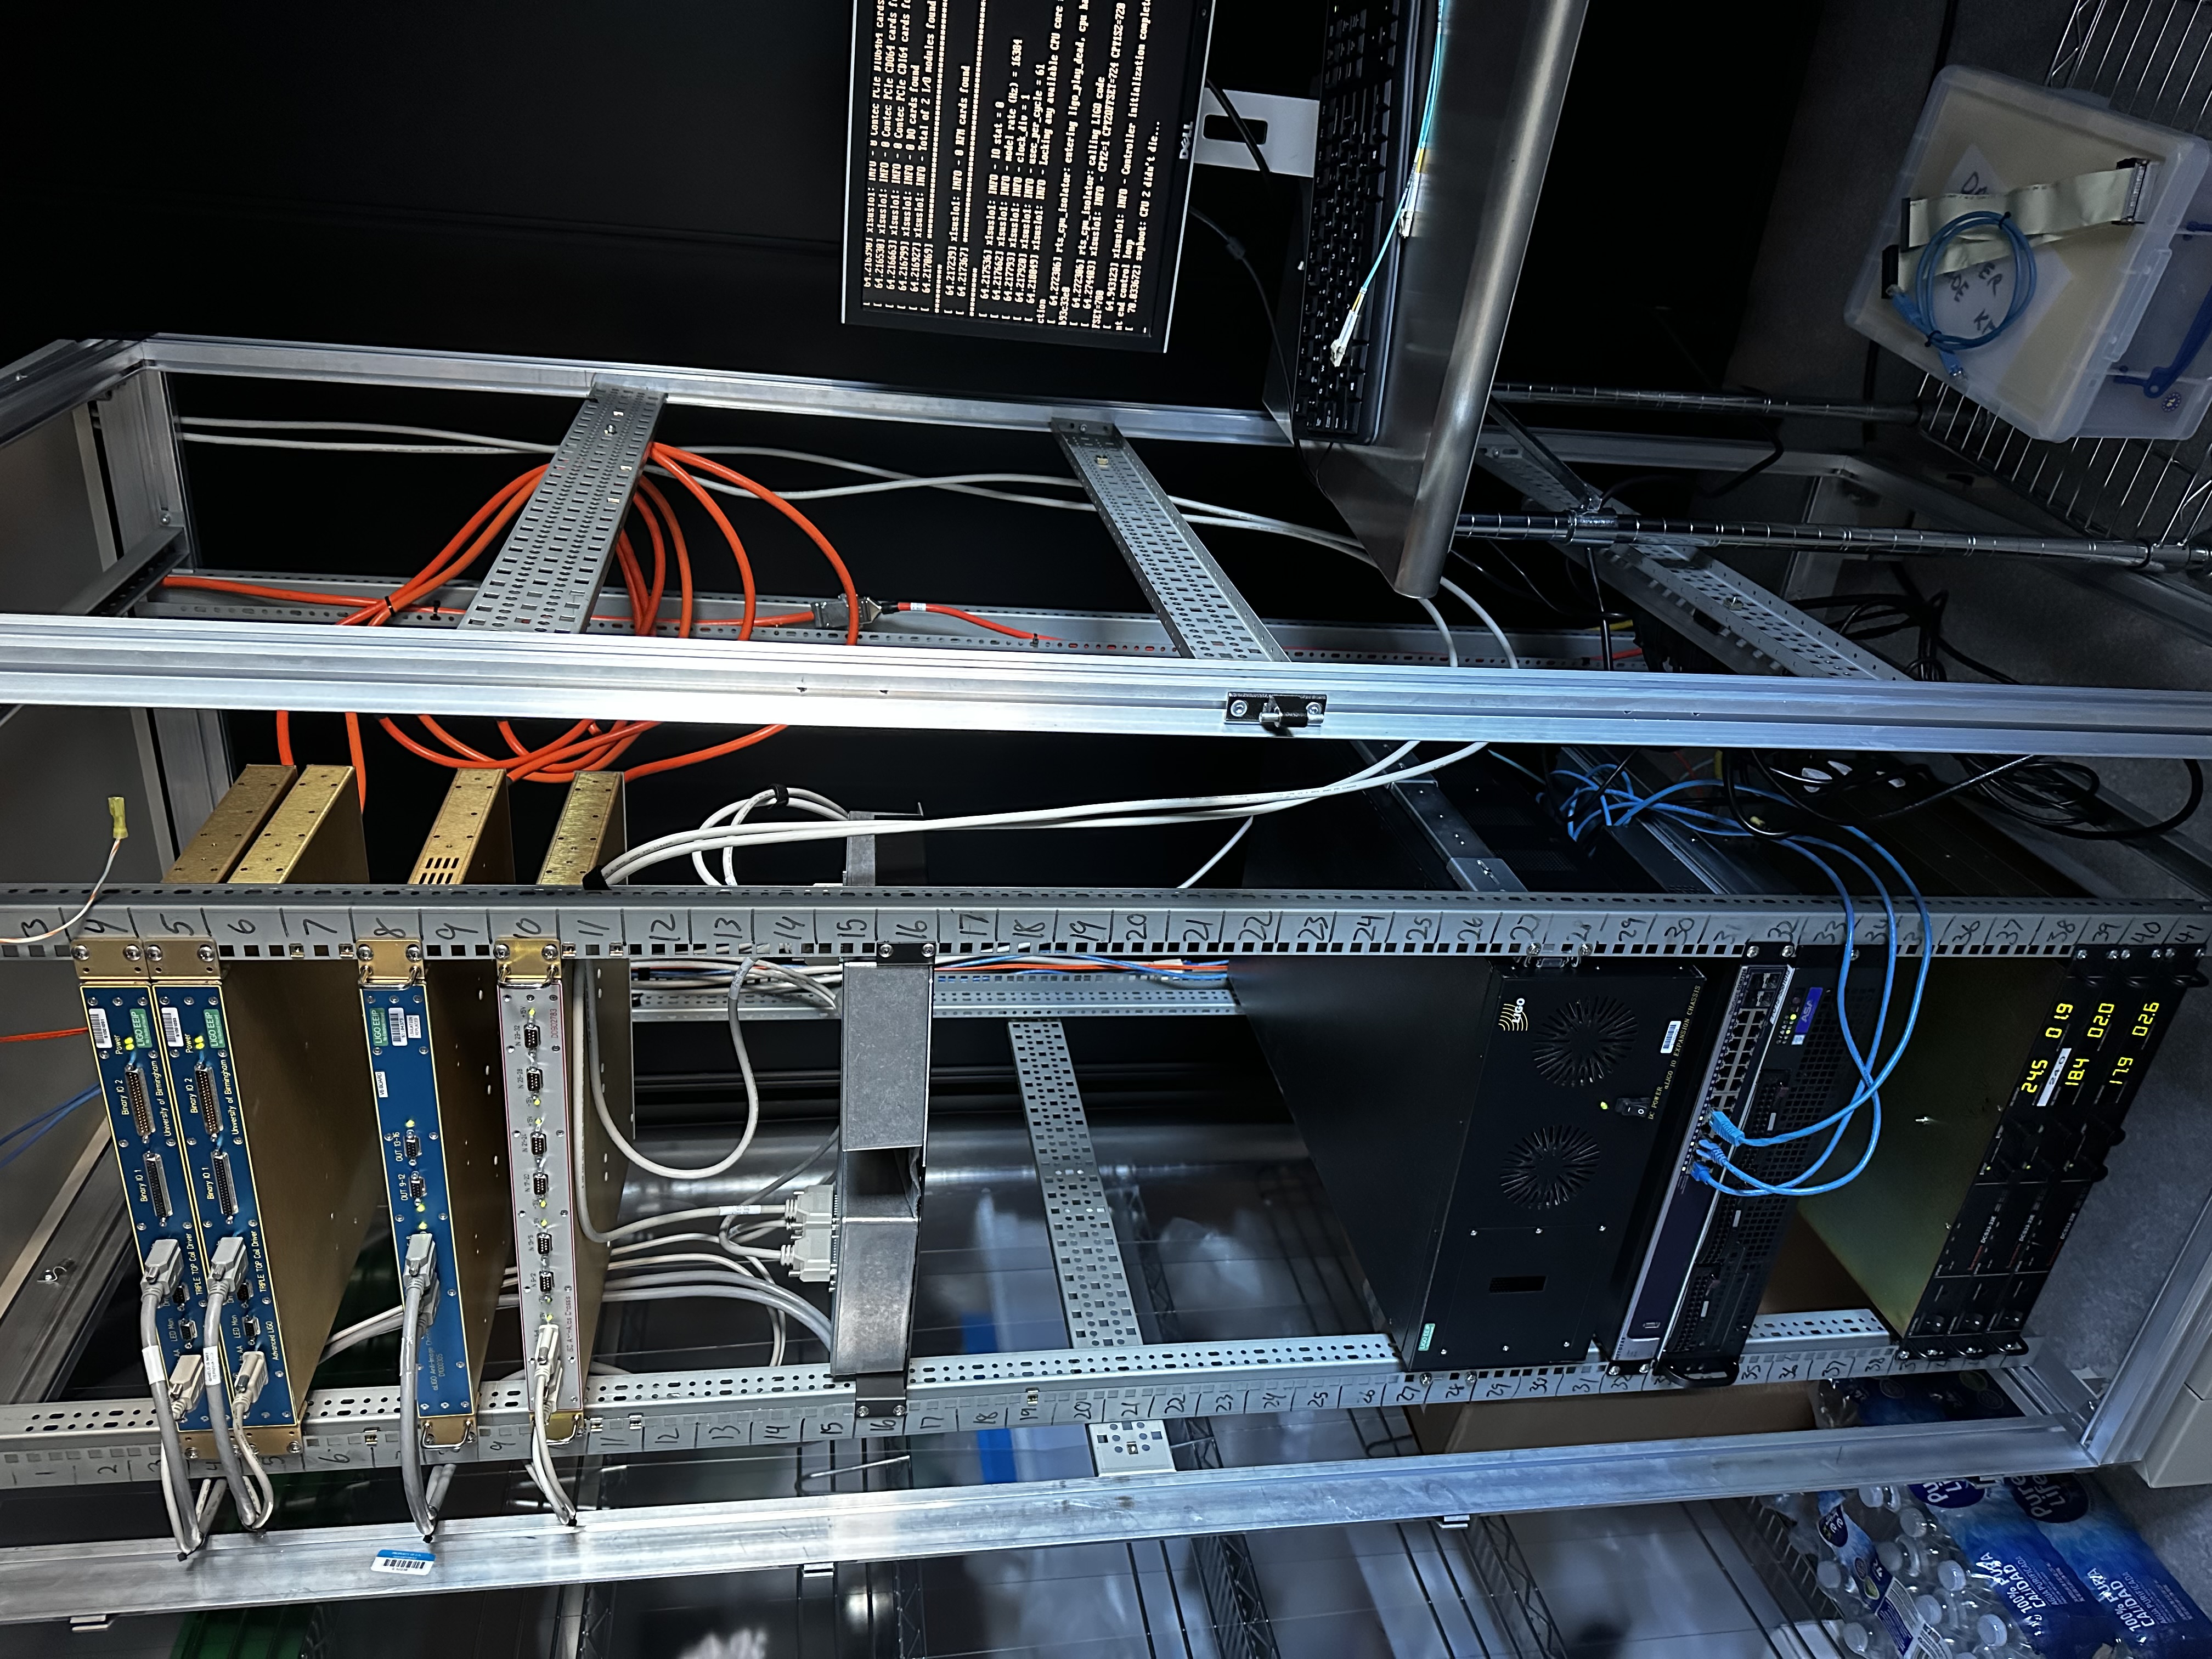
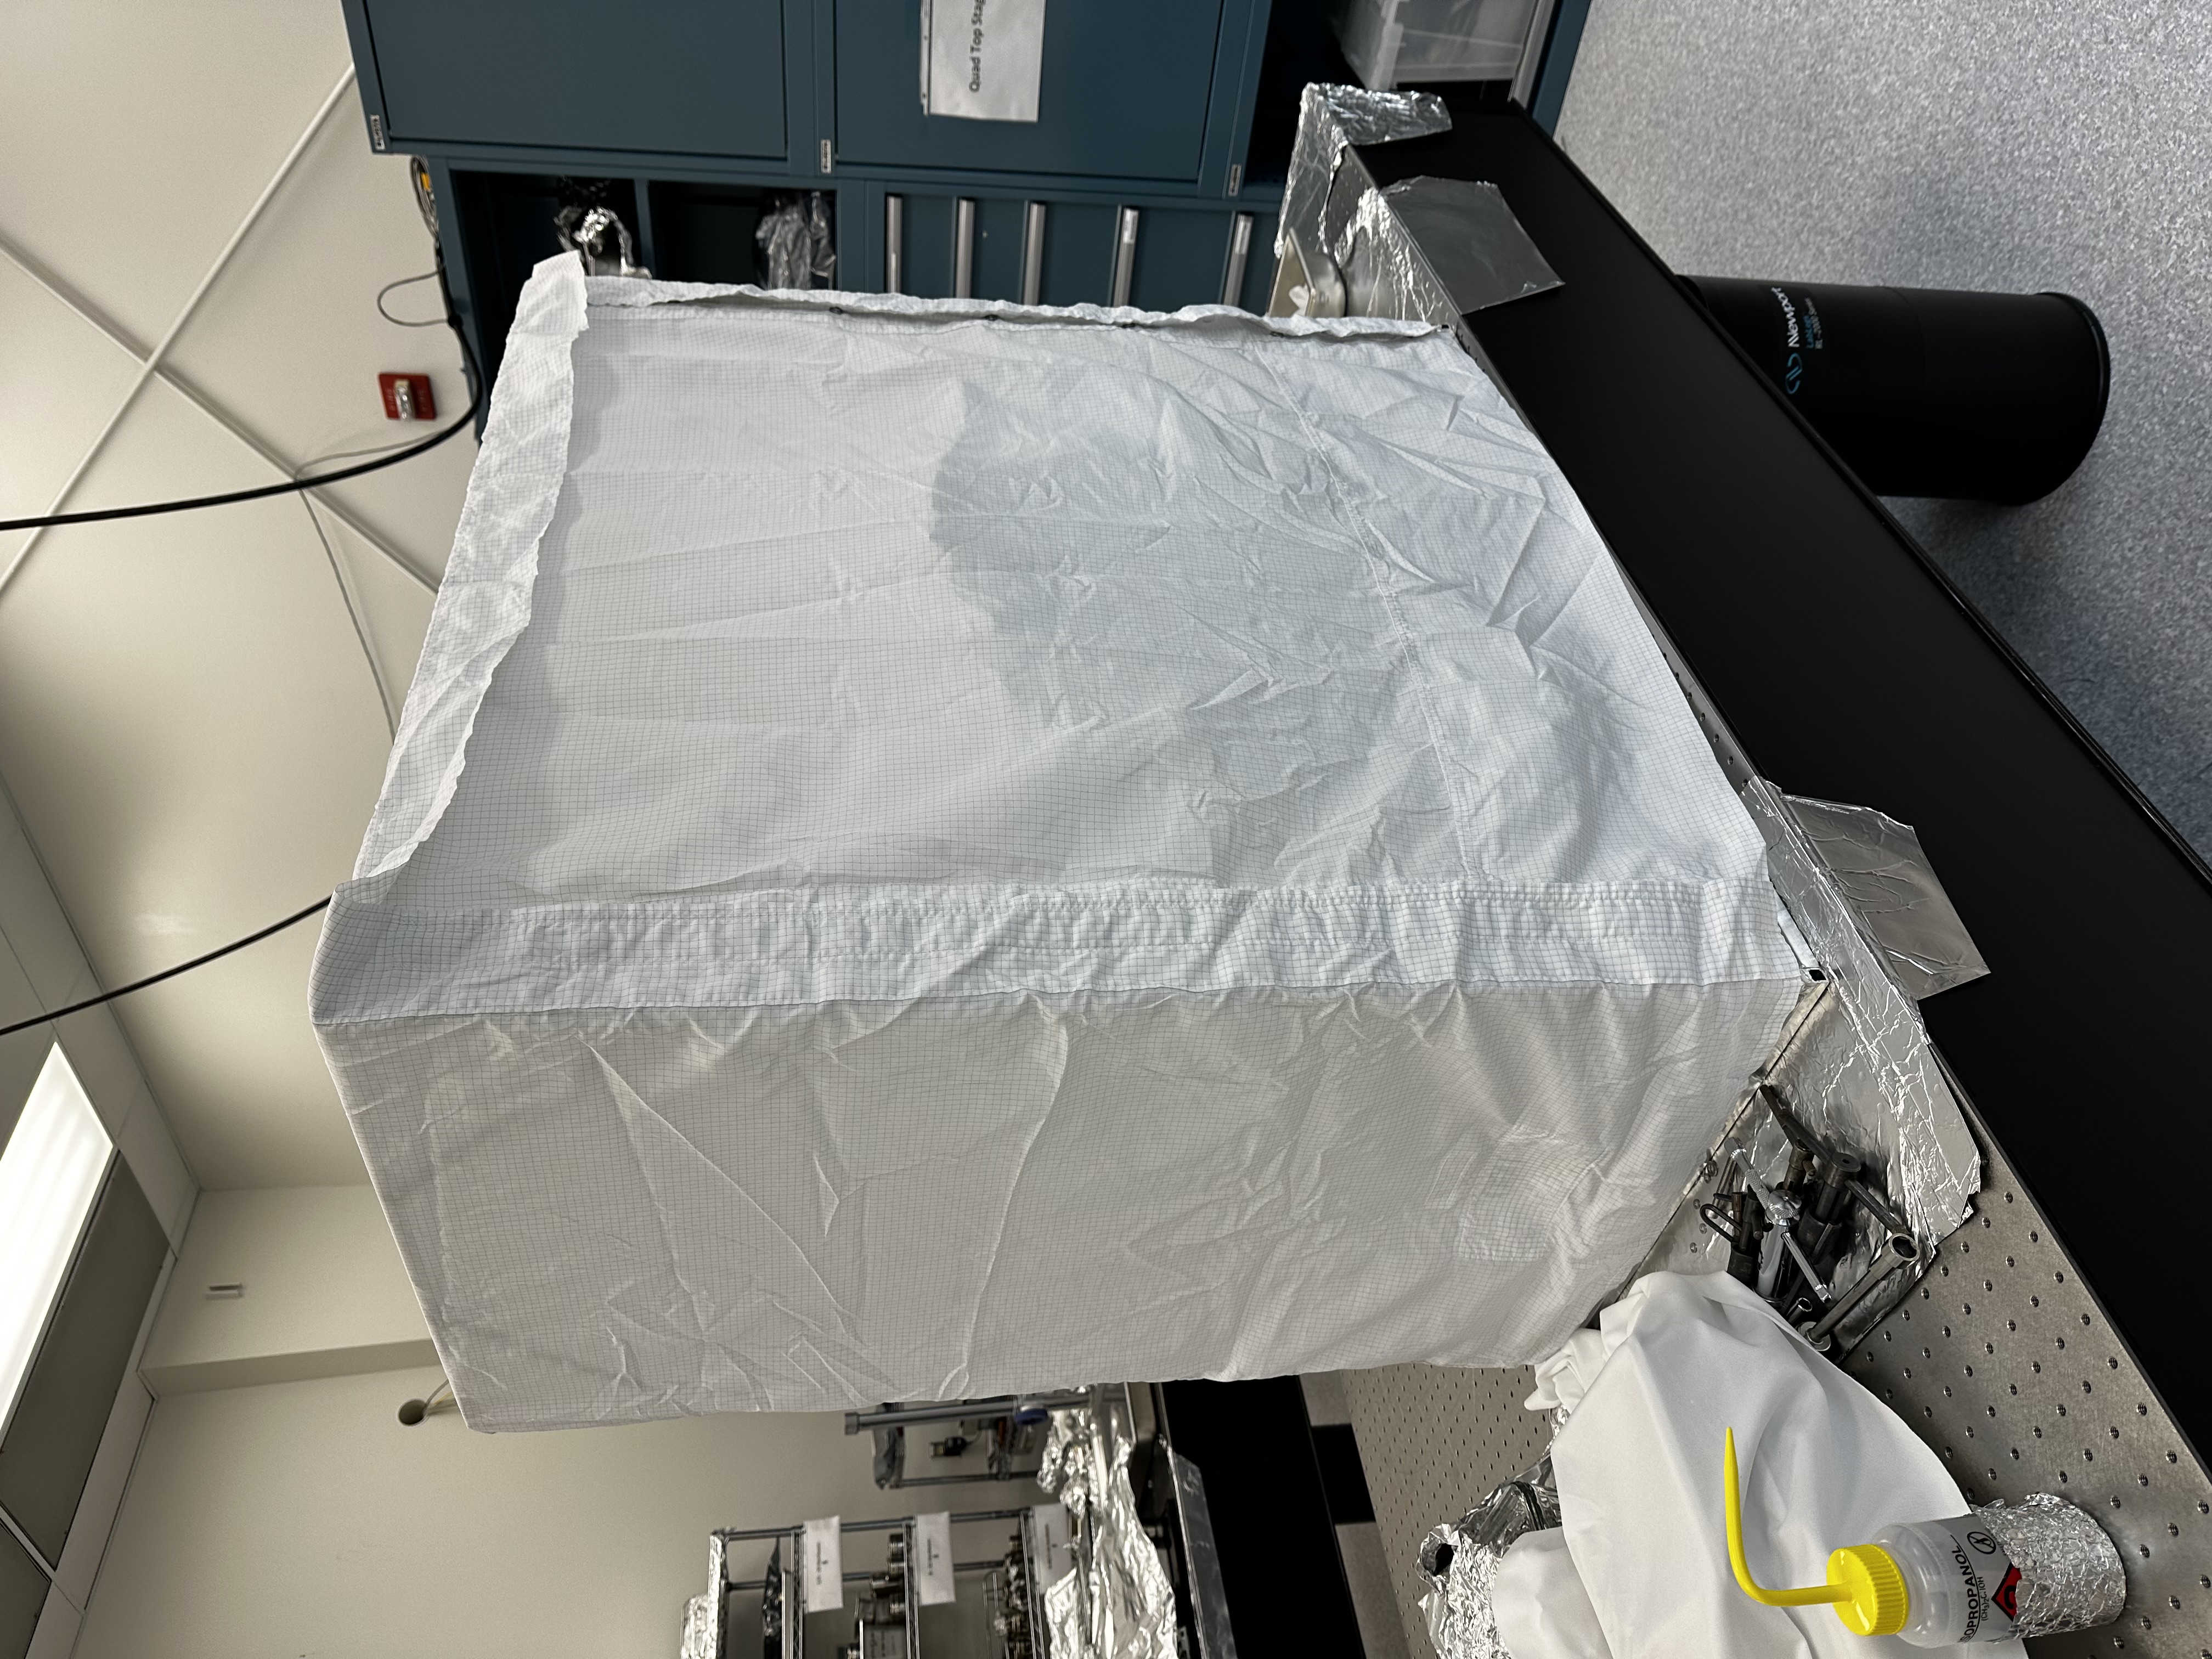
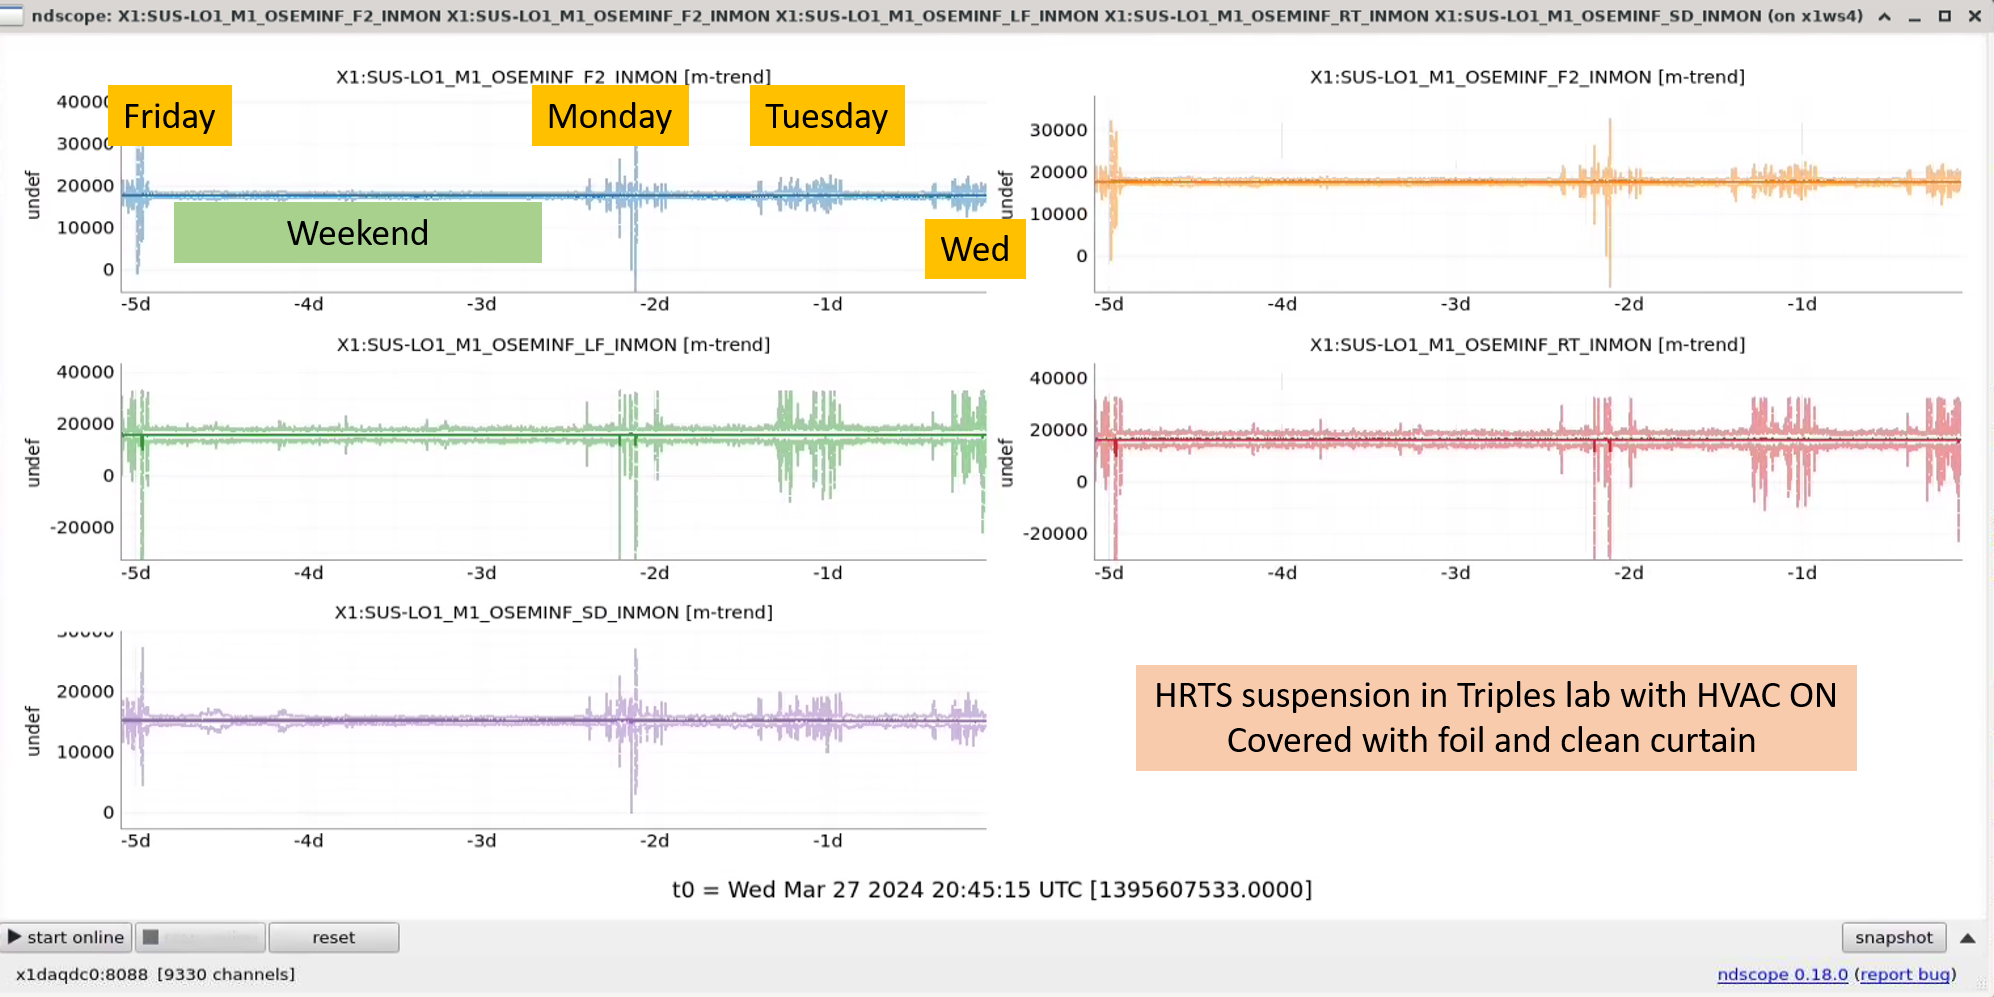
We have a dedicated test stand at the triples lab in the Stagings building, thanks to Fil, Eric and Dave. The hardware (power supply, satellite boxes, Triple Coil driver, IO, AA and AI chassis) can be seen in this picture. We also have a working MEDM screen for HRTS on X1 controls thanks to Jeff Kissel and Oli. Using this infrastructure we started testing out our suspension. The first challenge was too much vibration in the lab due to turbulent air, vibration due to building doors opening/closing etc. Our suspension is sitting on a heavy optical bench and we have also used a teflon sheet for absorbing some of the ground vibrations. However, since the turbulent air in the lab was too much for us to take any meaningful measurements, hence we covered the SUS in two layers of foil and then clean room cloth - as shown over here. We then exited the lab and it took 30mins or so for things to calm down (while HVACs in the lab are still running). Long story short, we took the first top to top transfer function measurements for HRTS and the plots are attached below. I am attaching the DTT plots as well as the ones processed in Matlab.
If you look at the DTT plots, the coherence is not too bad despite all the external vibrations leading to saturations (we have 18bit DAC). In Matlab we can compare our results against the model (Mathematica from M Barton, imported to Matlab). The Longitudinal (L),Transverse (T) and Yaw (Y) dof aligns nicely with the model, ie all peaks and magnitude looks good. Pitch (P) also has most of the peaks at right places (except a missing peak at 4.5Hz), and is off in magnitude which we are investigating. Vertical (V) is noisy (which is expected as the suspension can be easily excited in vertical motion) and has a cross-coupling from Roll (R) (at around 1.8Hz)? Roll (page8) looks the worst of all especially the shape and magnitude at frequency below 2Hz.
I am still fine tweaking the balancing of the suspension, further isolating it environmental noise and discussing with colleagues to take better measurements. In the meanwhile this is a decent start for us, eleven more to go.
Tagging EPO -- Rahul has new babies! This is the newest type of suspension -- and by far housing the smallest triple suspension. So cute!
Looking at the ndscope of the raw inmons from HRTS BOSEMs over a period of last 6 days, the weekends and evening times are nice and quiet and it gets noisy during business hours. LF and RT BOSEMs which corresponds to V and R dof gets especially rattled.
We tried the in-lock charge measurements but forgot about the New-DARM configuration so caused a lockloss in the SWAP_TO_ITMX state.
It seems also that only ETMY was ever moved during the part of the test that did run (I'd expect everything but ETMX measured, because the last one requires switching control to the other TM which caused lock loss). In the measurement last week, it seems excitation was applied on all masses as it should be. Attached are plots from this week and last week.
I've attached the plots for ETMY, since that's the only one that had the excitations this last week.
Naoki, Daniel, Nutsinee
Today we increased RF6 from -22dBm to -13 dBm and 8 dBm. We saw excess noise at 8 dBm above 300Hz but no excess noise at -13dBm. REF 12 is the squeezing at -22dB before we started the test. Using the time from alog76553. REF9 and REF10 both show squeezing at -13dBm RF6 at different squeeze angle where one has a better sensitivity at low frequency bucket. REF13 shows squeezing at 8dBm RF6. The excess noise above 300Hz cannot be improved with squeeze angle. Investigation is required.
We turned off ADF sqz angle servo during the test. We readjusted the ADF squeeze angle demod phase and accepted the new value in the SDF.
We are parking RF6 at -12dBm. Since Daniel didn't like the unlucky number 13.
| Loop | Was (-22dBm RF6) | Now (-12 dBm RF6) |
| CLF gain | 10 | 0 |
| LO gain | -7 | -12 |
| FC LSC gain | -2.6 | -0.86 |
| FC ASC gain | 0.1 | 0.03 |
The -22dBm, -12dBm, 8dBm RF6 correspond to 9 uW, 28 uW, 420 uW CLF REFL power.
We rechecked the FDS -22dBm time as the time in the above plot wasn't sqz opitmized to the bucket. Can see in attached plot, CLF at -22dBm and -13dBm have the same SQZ in the bucket, as expected.
Looking back at the past data it seems we may not have adjusted the CLF ISS gain properly during the test causing our sqz level to be stuck at 3dB at kHz region. CLF_REFL_DC was oscillating when RF6 was at -13 dBm and at 8 dBm. This looks like an easy fix and we should try again at some point.
Daniel Nutsinee
Reducing the gain didn't seem to fix the oscillation. We cranked up the CLF power so the RF6 read 6dBm and went out to look at the signal on the scope. We saw 60kHz beat note on the OPO refl and a crooked 105kHz sinewave on the CLF refl. We don't know where the 60kHz beat on the OPO refl came from. We couldn't make any improvement by changing the CLF ISS gain.
After some investigation we realized the oscillation disappeared when we unplugged the RLF. The oscillation came back when the RLF was plugged back in. The oscillation associated with the RLF seemed obvious only when we operated at high power. Next time we try high CLF power again we should attenuate the RLF RF output to the AOM.
The funny thing was PMC refl saw this oscillation as well. We hope this was just an electronics cross talk.
For even higher CLF power with +6dBm at the RF6 demod, we set the CLF servo IN2 gain to-18dB (from 0dB), the CLF ISS gain to 0dB (from 17dB), and the ISS input set point to 2.037 (from 0.347).
Camilla, Nutsinee, Sheila
Screenshot of different sqz angles attached. Nutsinee's final attachment compares sqz with two different CLF servo signs.
We offloaded IFO ASC and used "Save ZMs IFO" script to save the ZM settings that we found.
We moved the ADF back to 1.3kHZ as think the 322Hz ADF we used eariler is impacting the range.
Attachment 1 - looking for freq-dep SQZ loss/rotations. Here we fit a common model of frequency-dependent losses and rotations to all squeeze angle spectra simultaneously. FIS data would probably clean this up at low-frequencies, maybe removing the ~20 Hz anti-sqz bump.
Dots + thick lines = subtracted sqz data, with a moving average for clarity. Thin line = common fit model. Equations in the plot title. For each frequency bin \Omega, we fit the loss(\Omega) and the sqz angle offset theta(\Omega) given the \phi_0 for the dataset. The fit to all sqz angle spectra is done independently for each frequency bin.
This dataset suggest higher freq-dep losses at low frequencies in-band, but before we typically we had lower freq-dep losses below darm pole, e.g. Fig. 3 of the O3 quantum response paper (P2100050). I'm not really sure yet how to interpret this, and don't think there's a clear expectation for one way or another. As a basic sanity check, I compared another time with anti-sqz from March 17 LHO:76434 (which had different PSAMS settings) - there, evidence for frequency-dependent losses at lower frequencies is weaker, but there is still some evidence for it.
-------------------------------------------------------------------------------------------------------------------------------------------------------------------------------------------------------------------------------------------------------------------------------------------------
Attachment 2 - squeezing-related DARM comparison, O4a vs. pre-O4b. Blue/yellow = O4a. Purple/pink = pre-O4b. Interesting things (from a sqz perspective):
A comment regarding the excess noise - it seems clear that the excess mid-band DARM noise is not caused by / related to squeezing, because it's there even without squeezing injected. That said, squeezing seems to be having its own issues at these lower frequencies, below the DARM pole. Not clear how the worse low-frequency squeezing (after subtraction) could be a consequence of whatever causes the excess noise without squeezing. Likely different issues / things to be optimized happening at the same time/frequencies.
After PSAMS optimization with alignment scripts, it could be interesting to try a similar SQZ dataset with FIS.