Sheila, Rahul, Camille, Julian, Naoki
After ZM4 and ZM5 PSAMS offload in 75677 and 75709, we aligned ZM4/5/6 with seed and successfully offloaded the DAC outputs of ZM4/5/6.
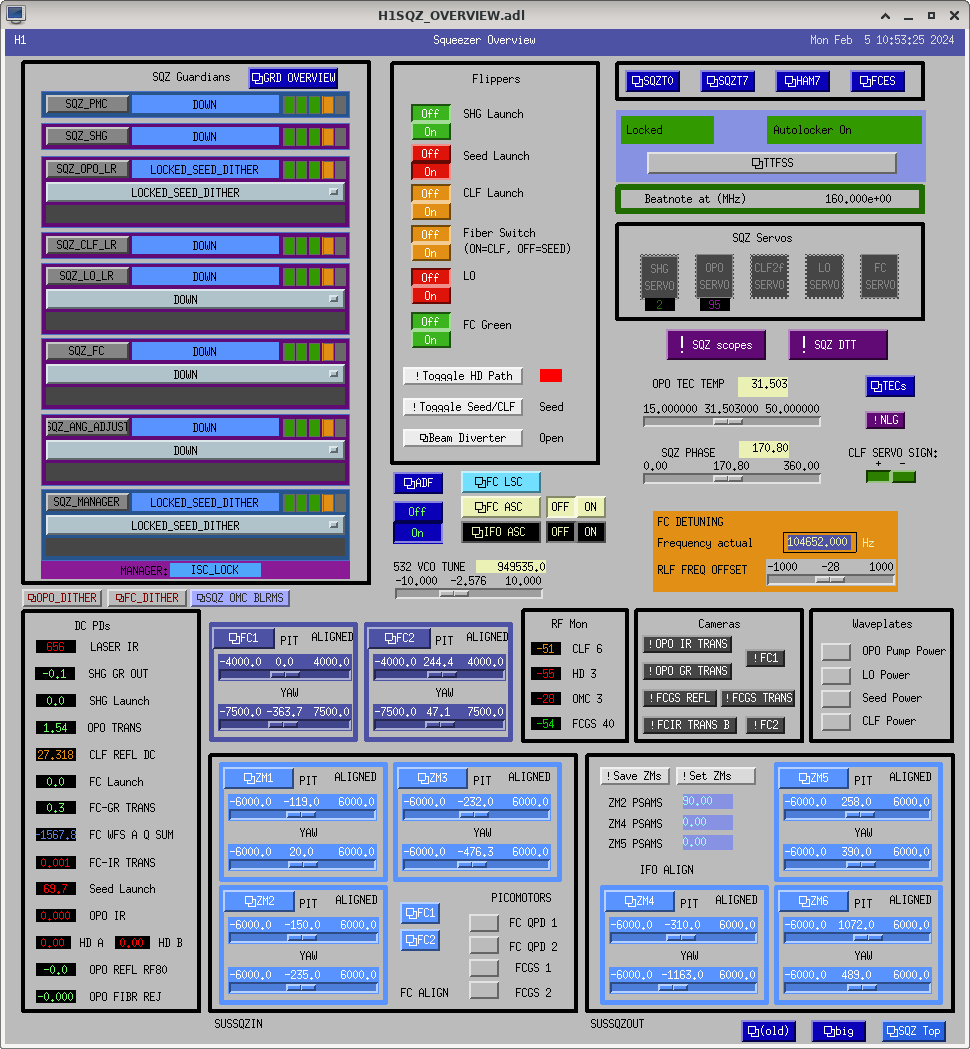
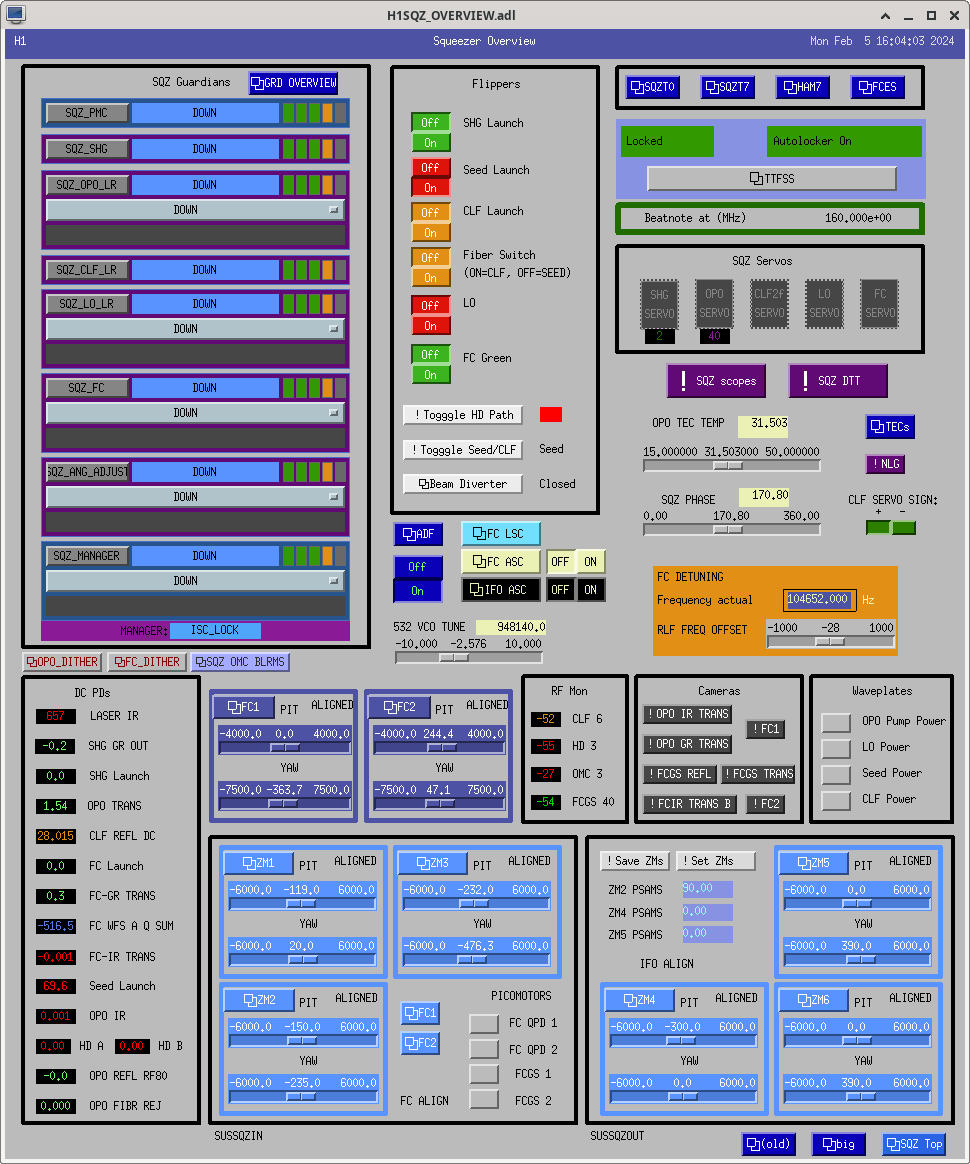
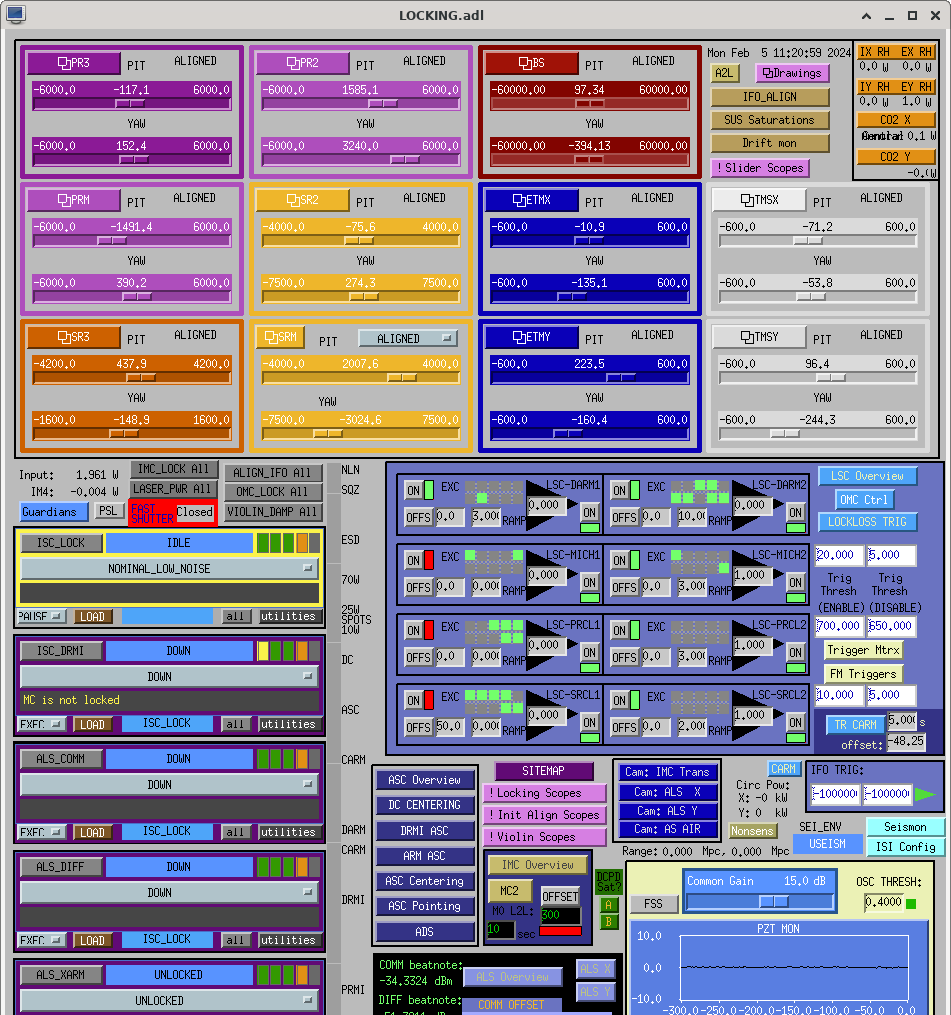
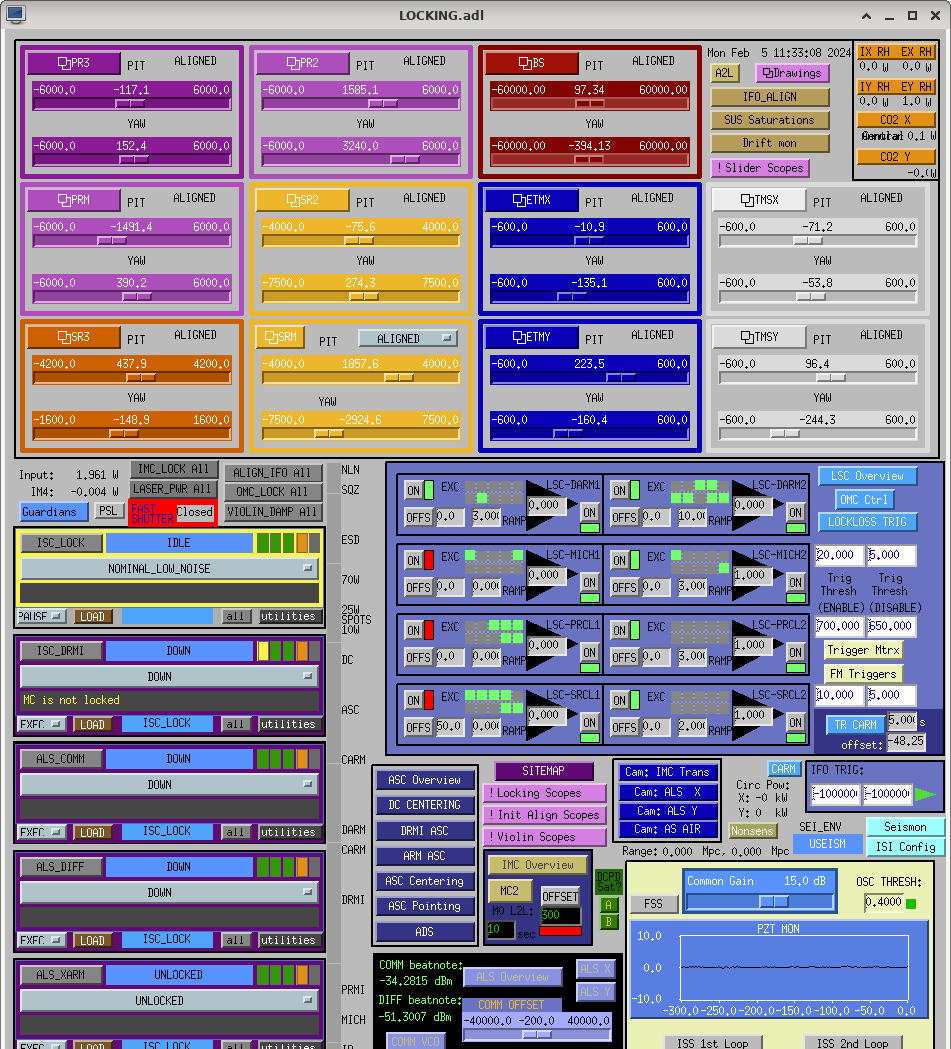
Fig 1 and 2 show the ZM slider values before and after our alignment work.
Before moving ZMs, first we checked the alignment of two irises in HAM6 and HAM7. The irises in HAM7 were OK, but the irises in HAM6 were not centered, so we moved SRM to center two irises in HAM6.
Fig 3 and 4 show the SRM slider values before and after our alignment work.
After the SRM alignment, the H1:ASC-AS_C_NSUM_OUT16 was around 0.2 with 36dB whitening gain and 80 of H1:SQZ-RLF_QPD_A_SUM.
For yaw, we reduced ZM6 yaw from 489 to 390 and compensated the alignment of two irises in HAM6 by ZM4. Since the DAC output of ZM4 got large, we made the ZM4 yaw slider value 0 and mechanically offloaded the ZM4 yaw.
For pitch, we reduced ZM6 pitch from 1072 to 0 and compensated the alignment of two irises in HAM6 by ZM4 and ZM5. After that, two irises in HAM7 were not centered anymore so we moved the height of two irises in HAM7. Since the DAC output of ZM4 and ZM5 got large, we made the ZM5 pitch slider value 0 and mechanically offloaded the ZM4 and ZM5 pitch.
We will measure the beam profile in HAM7 tomorrow.
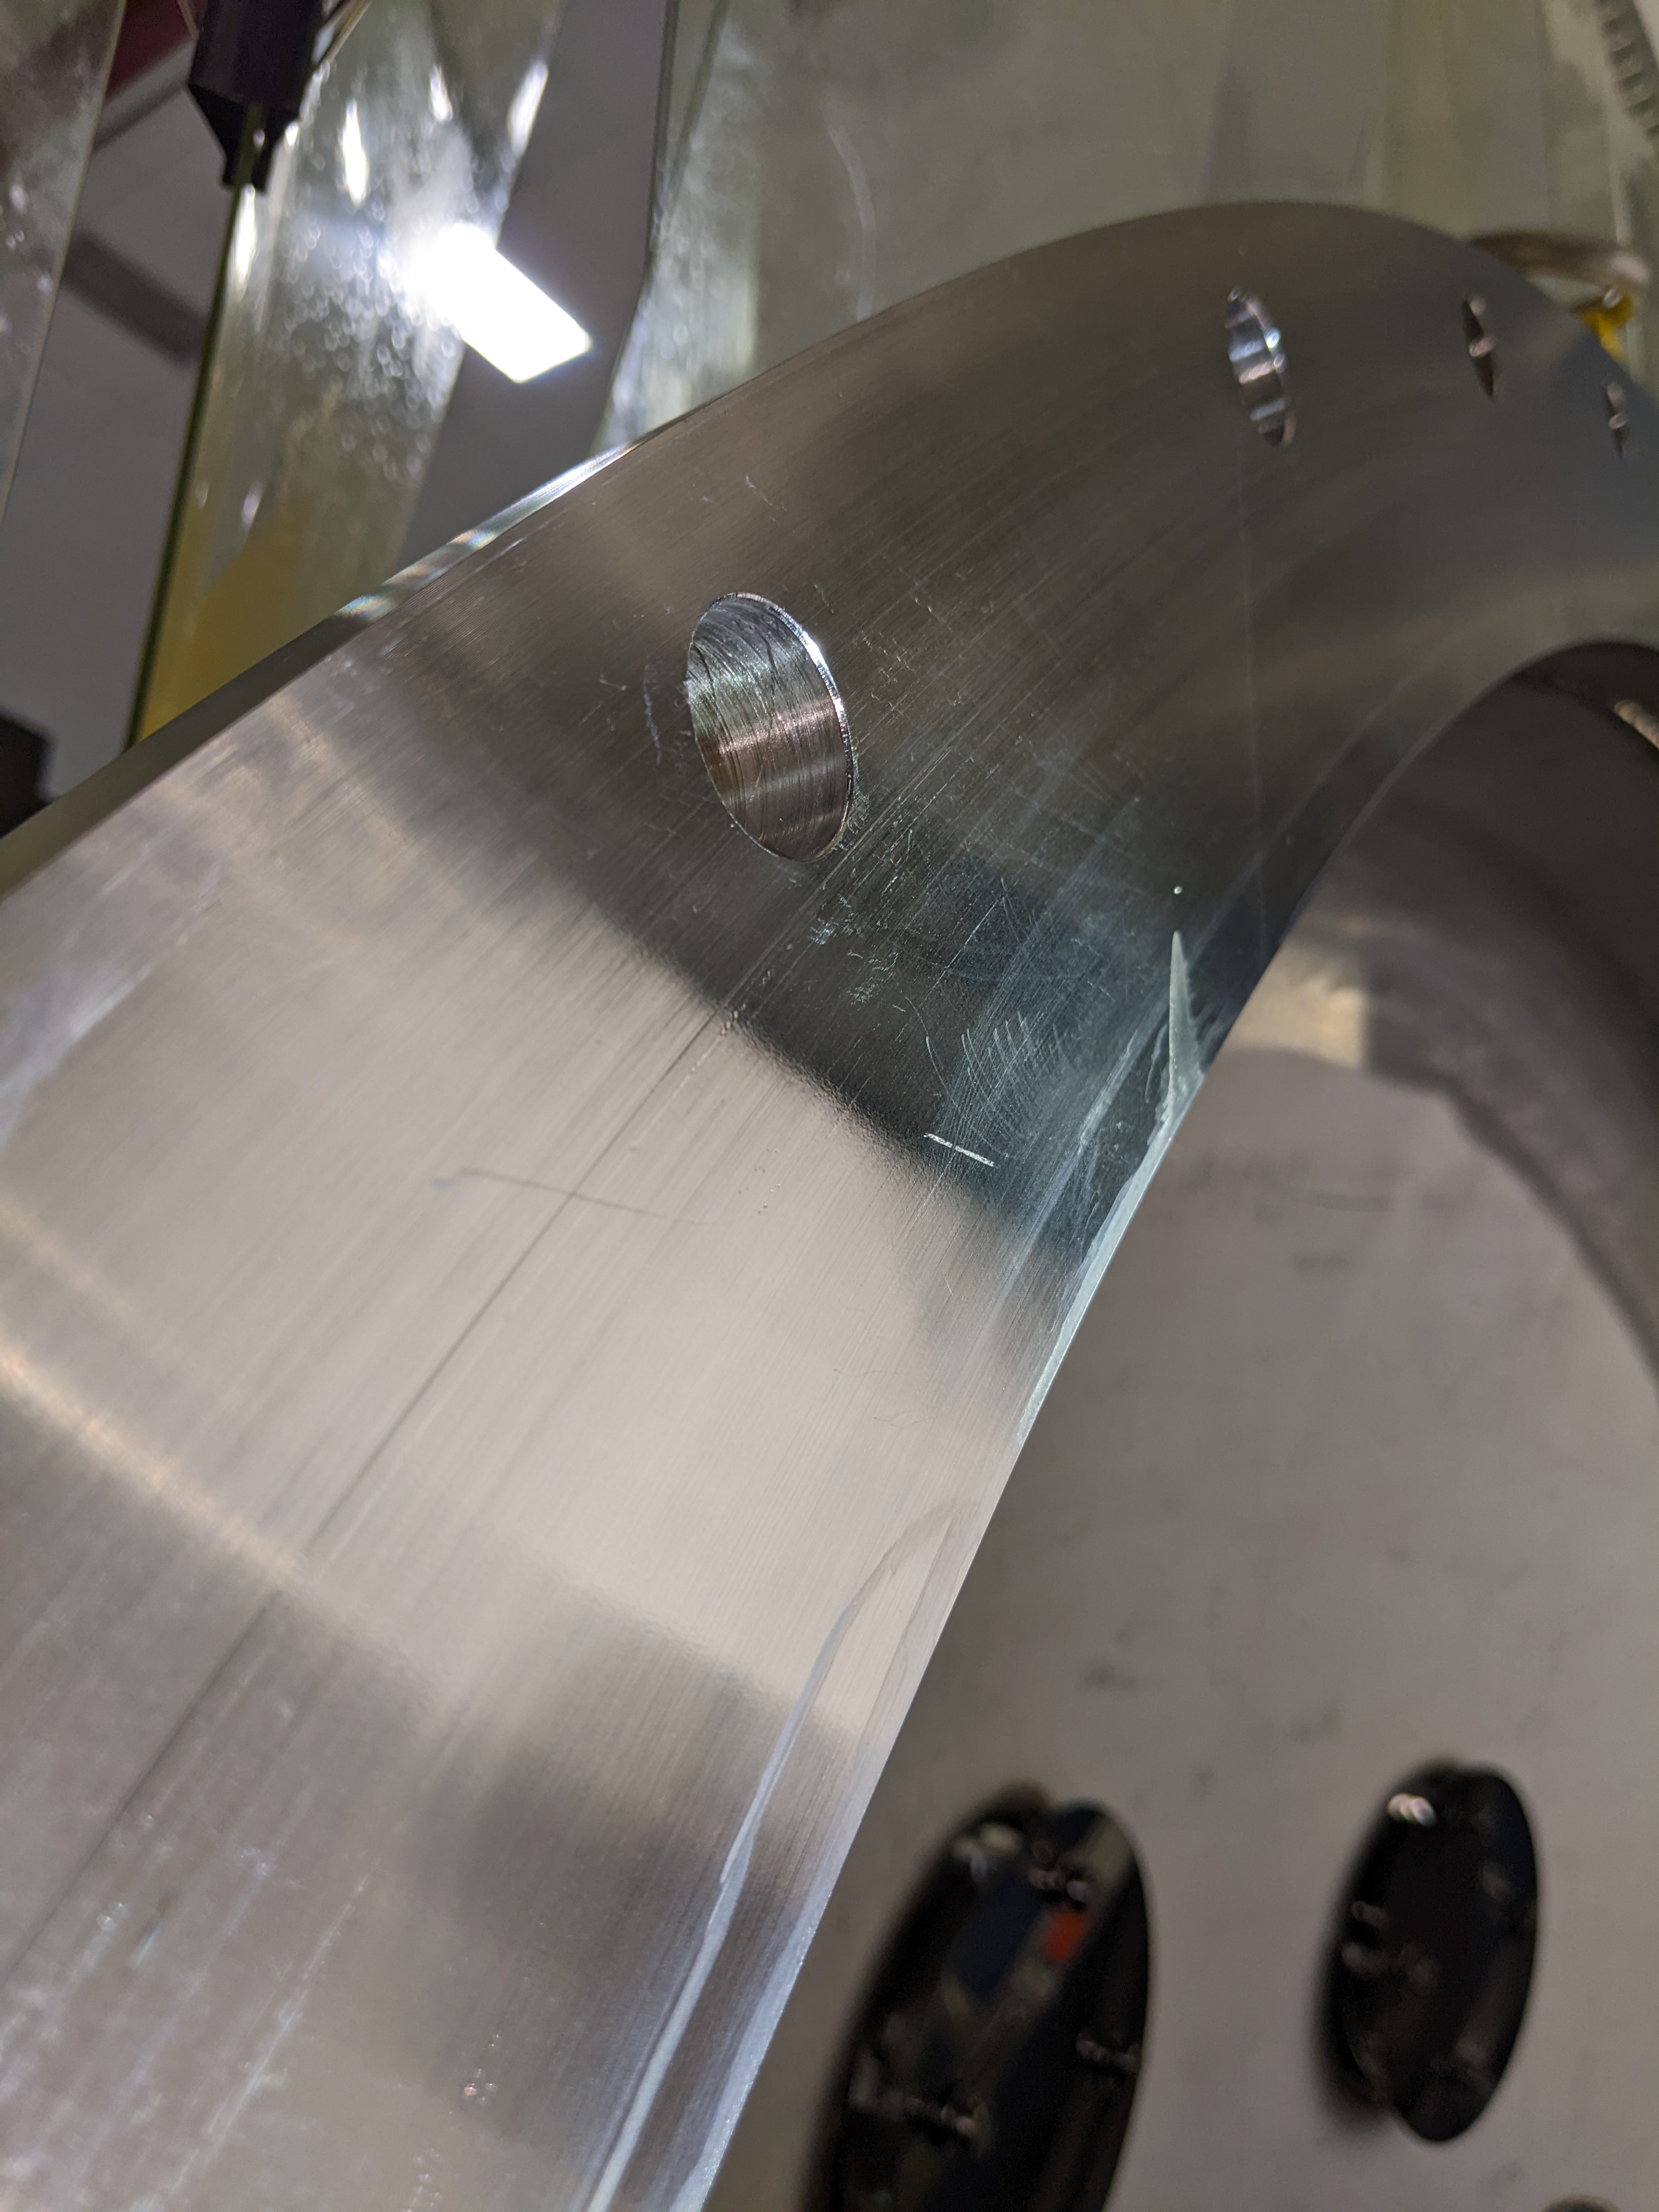
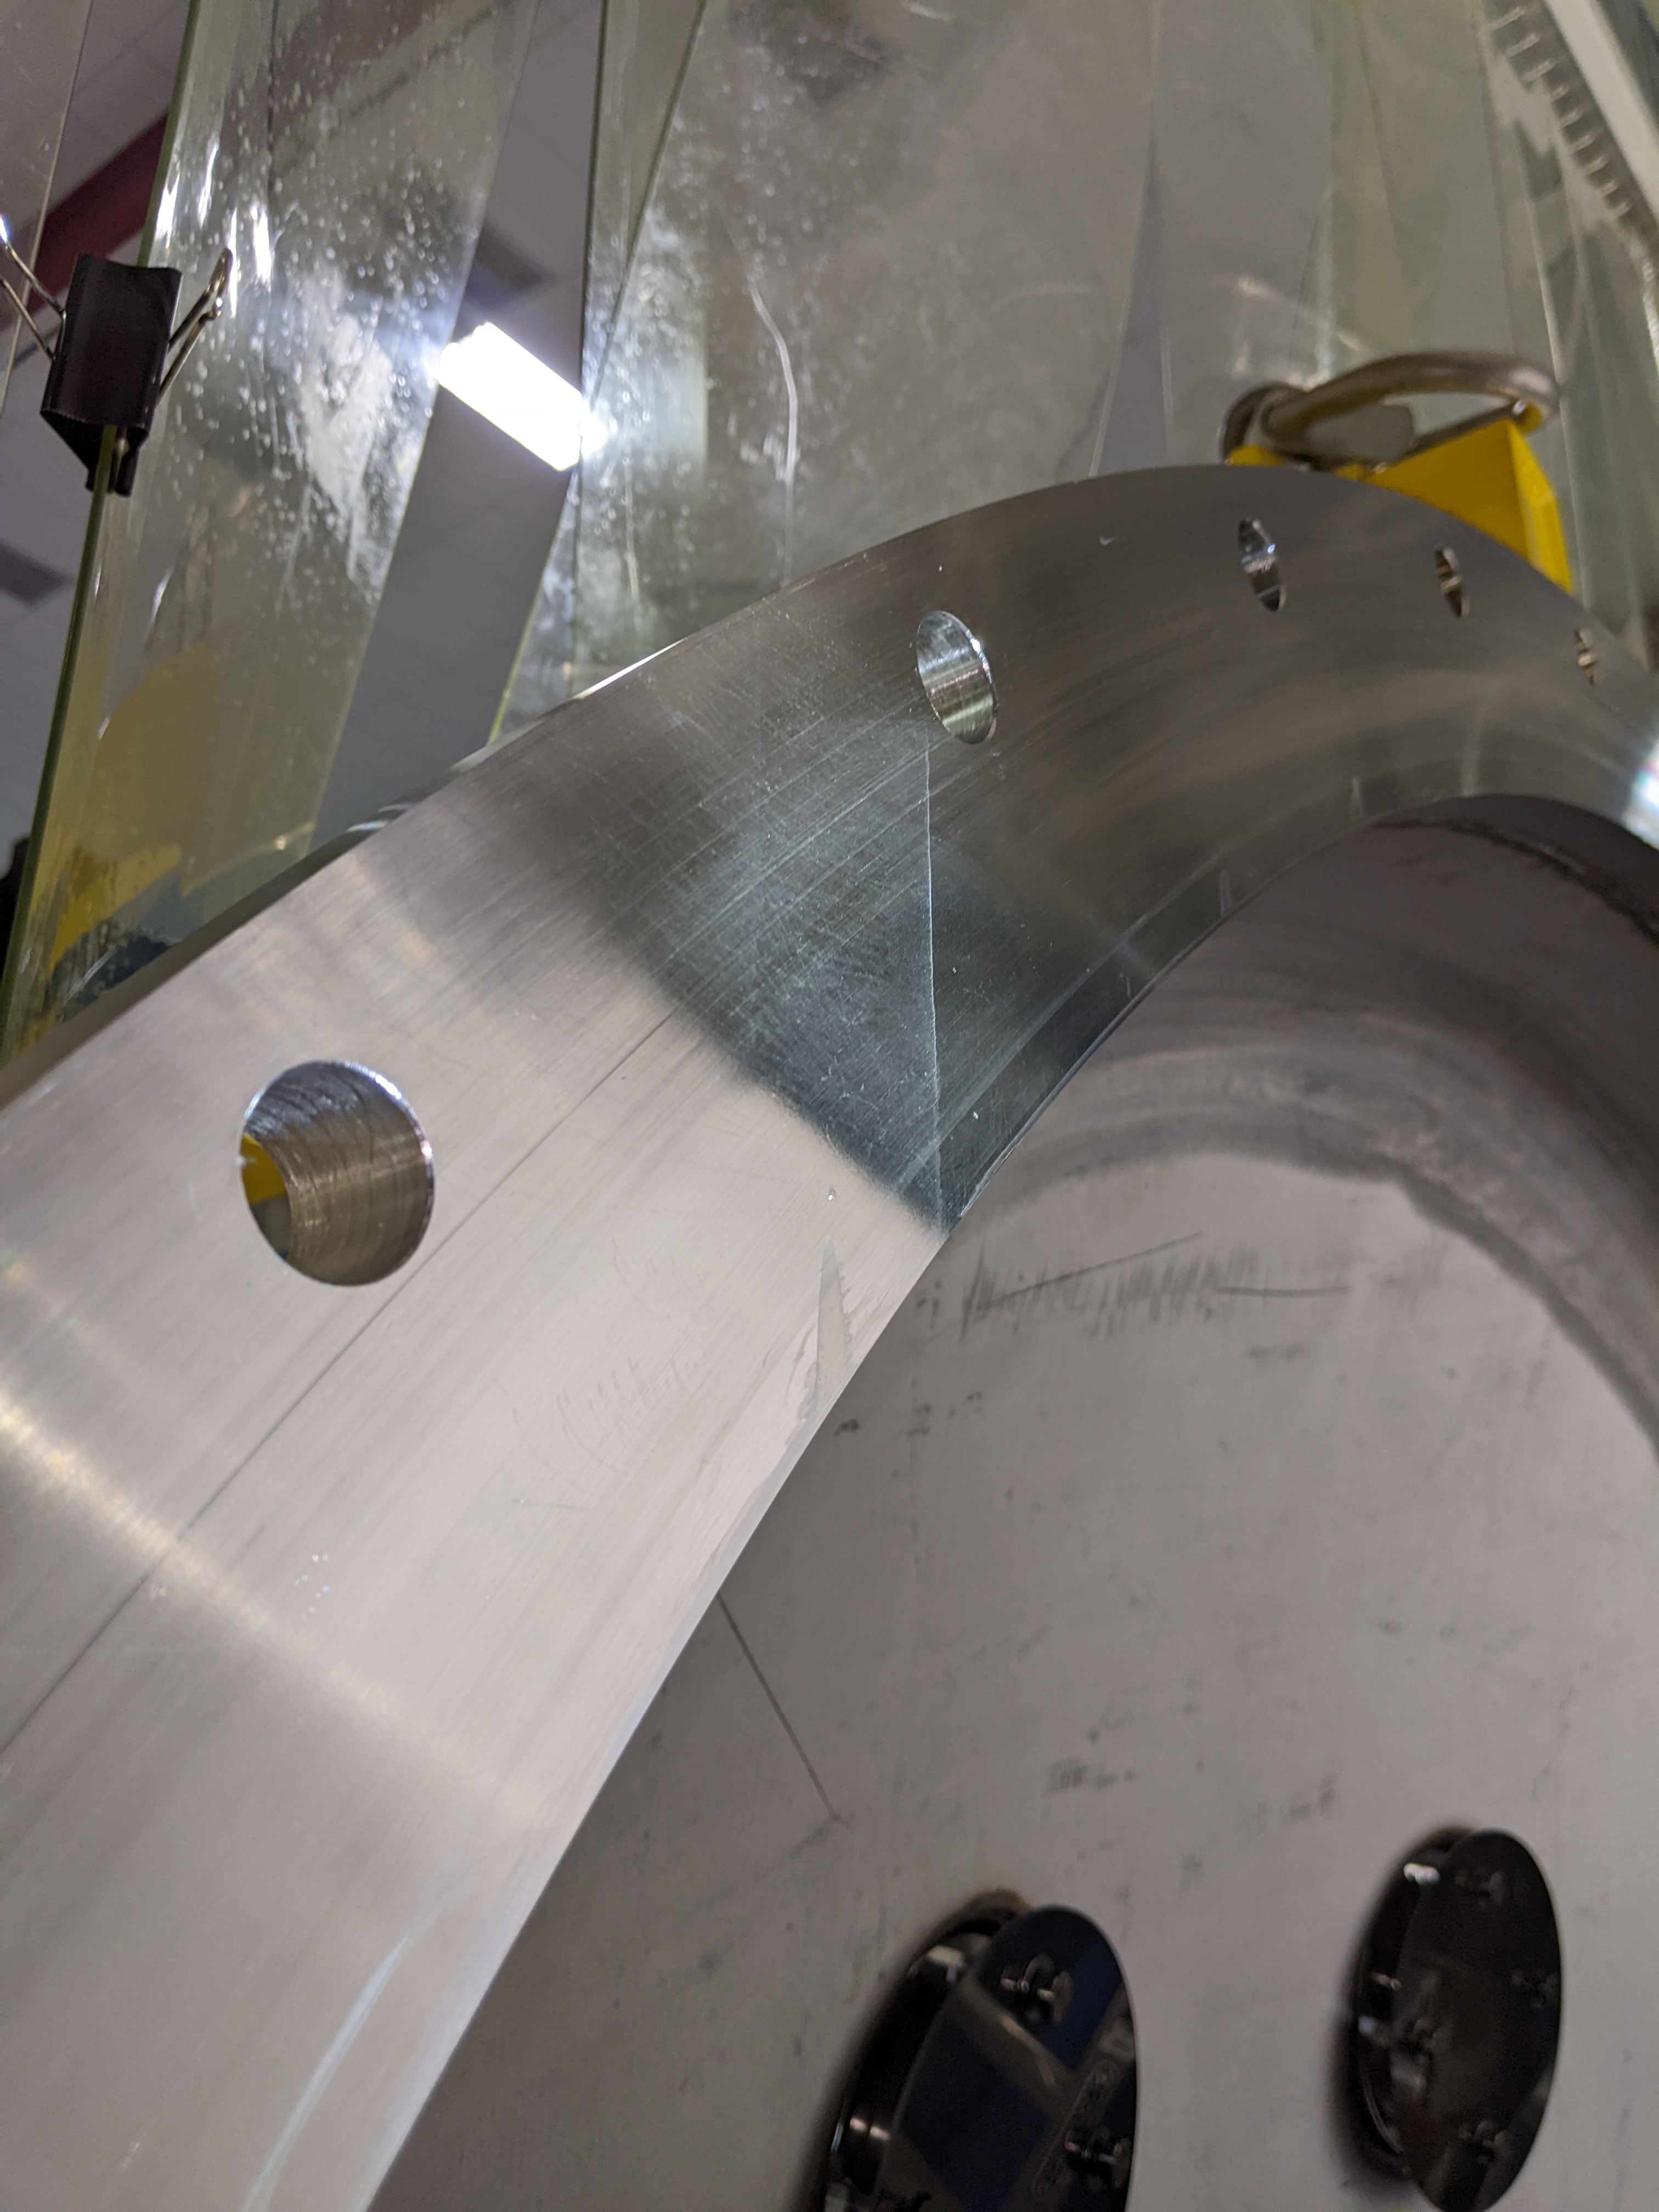
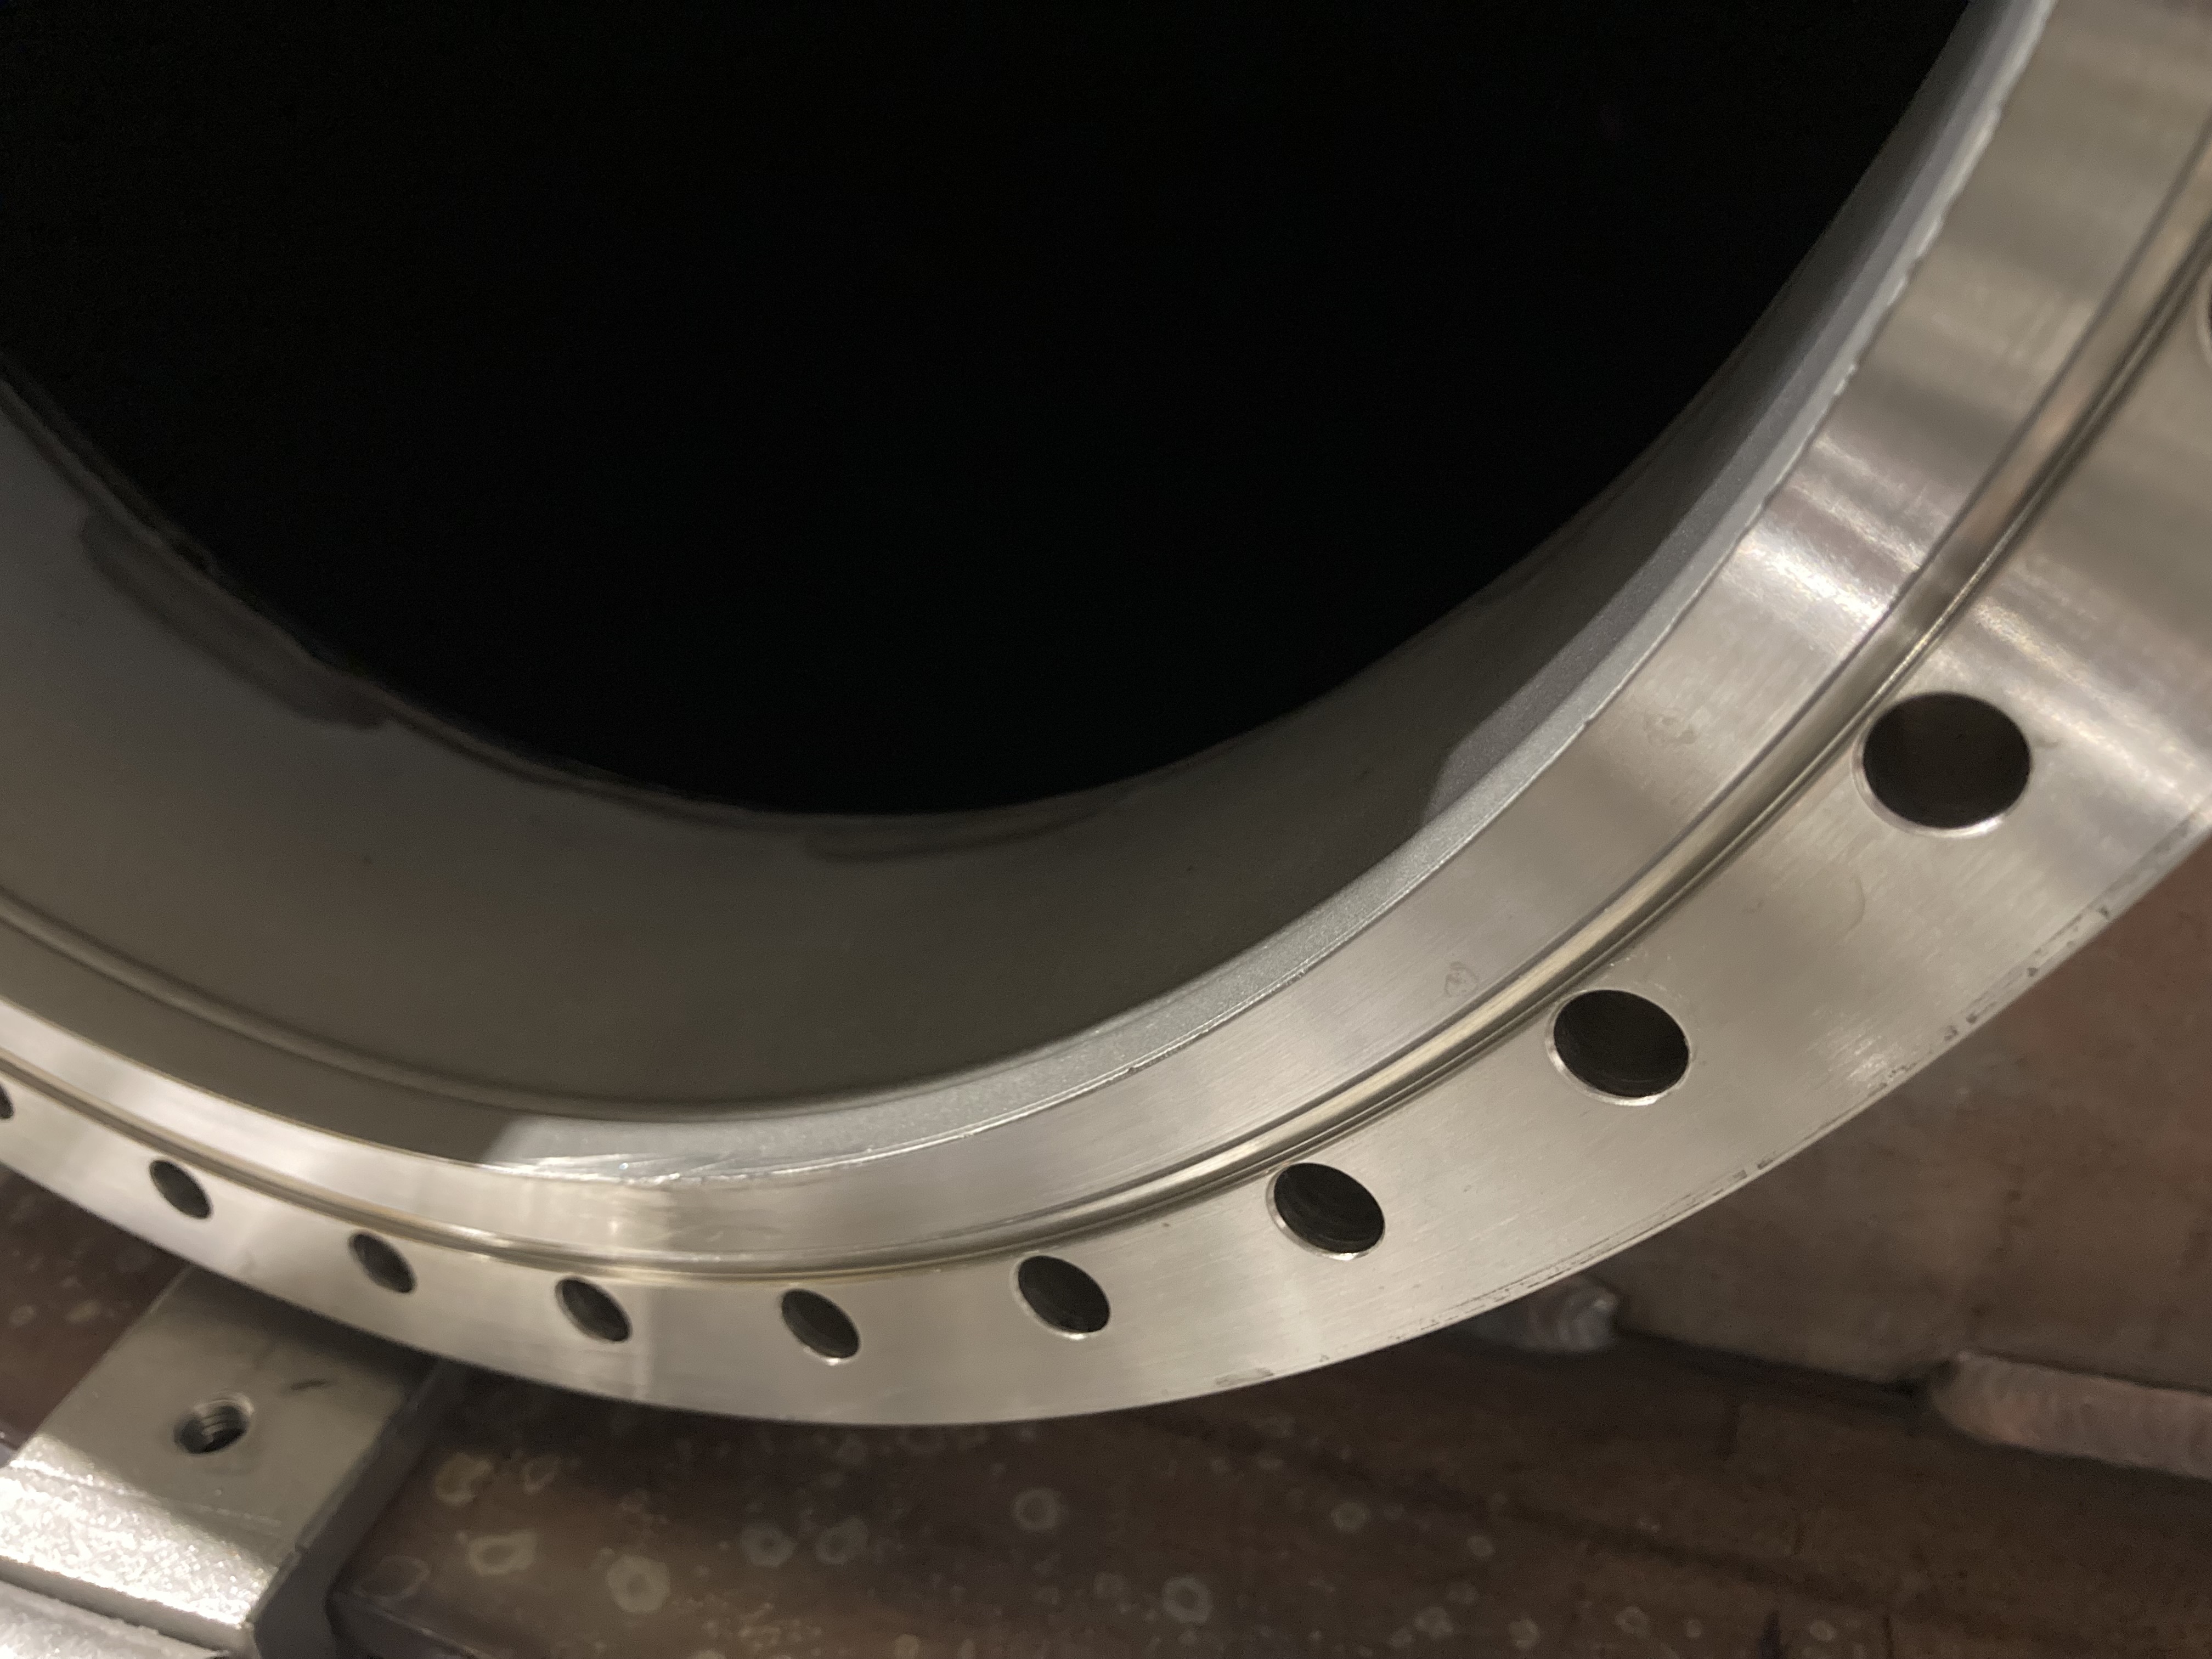
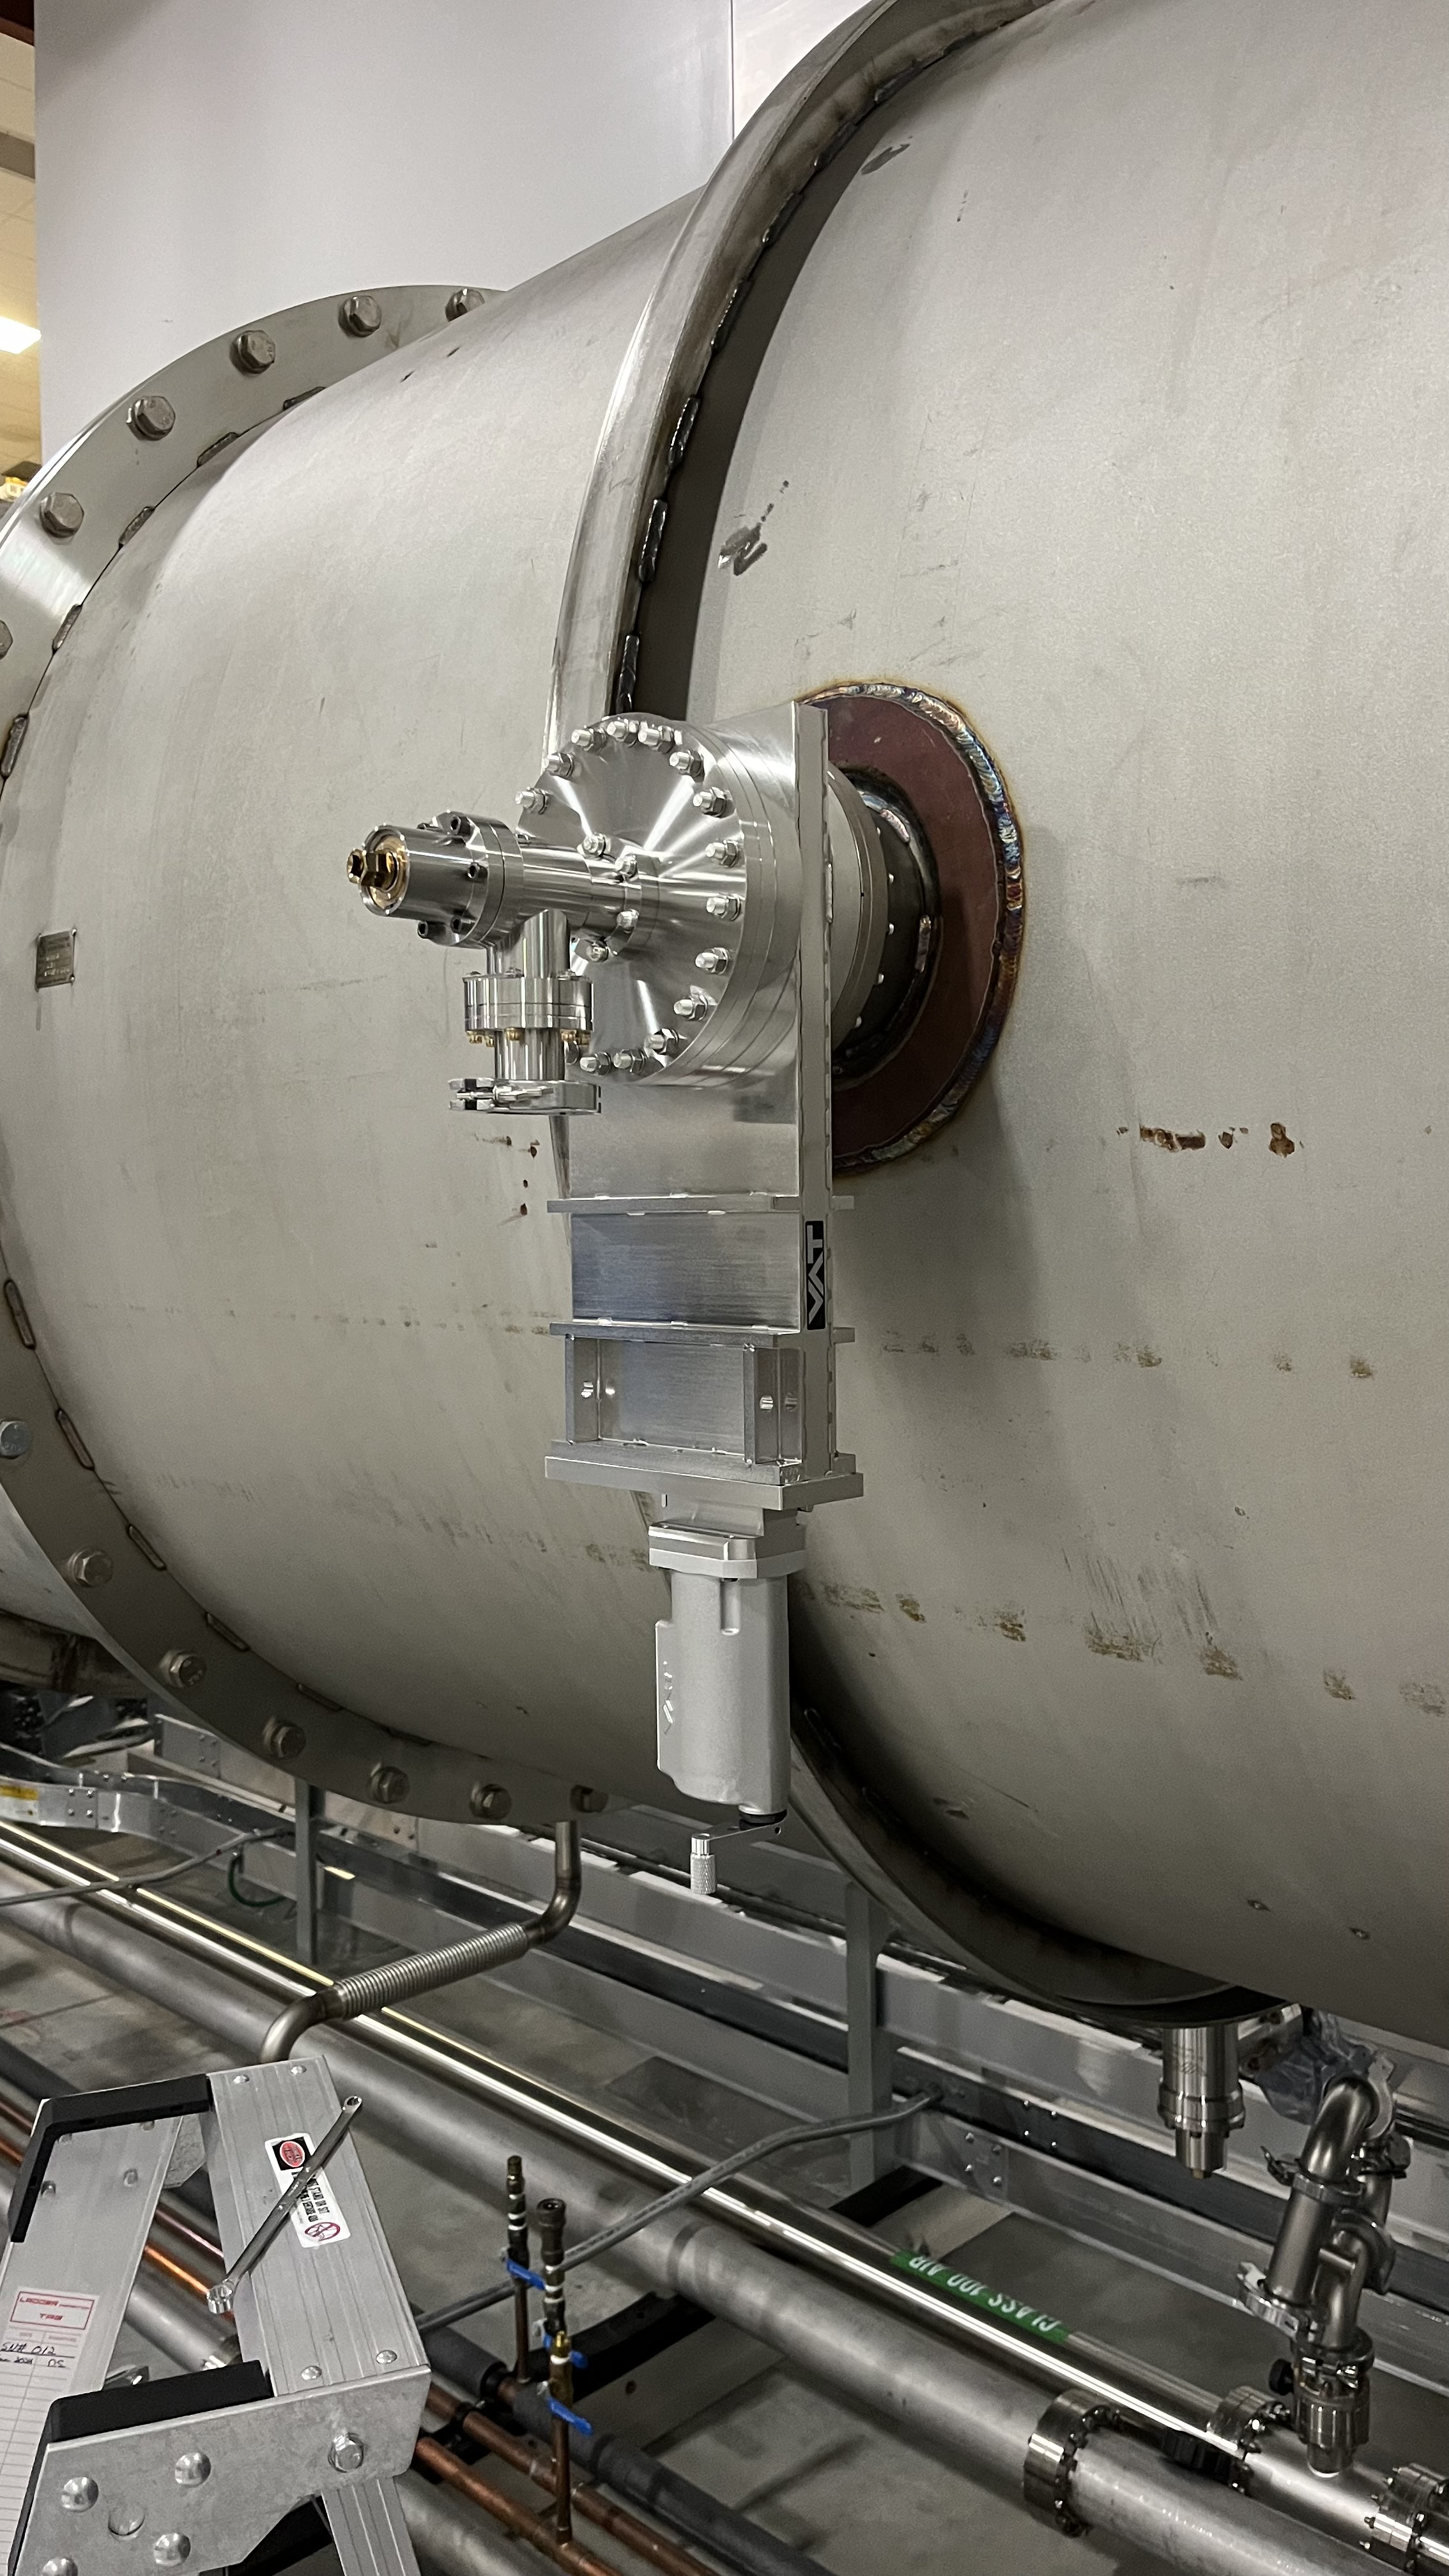
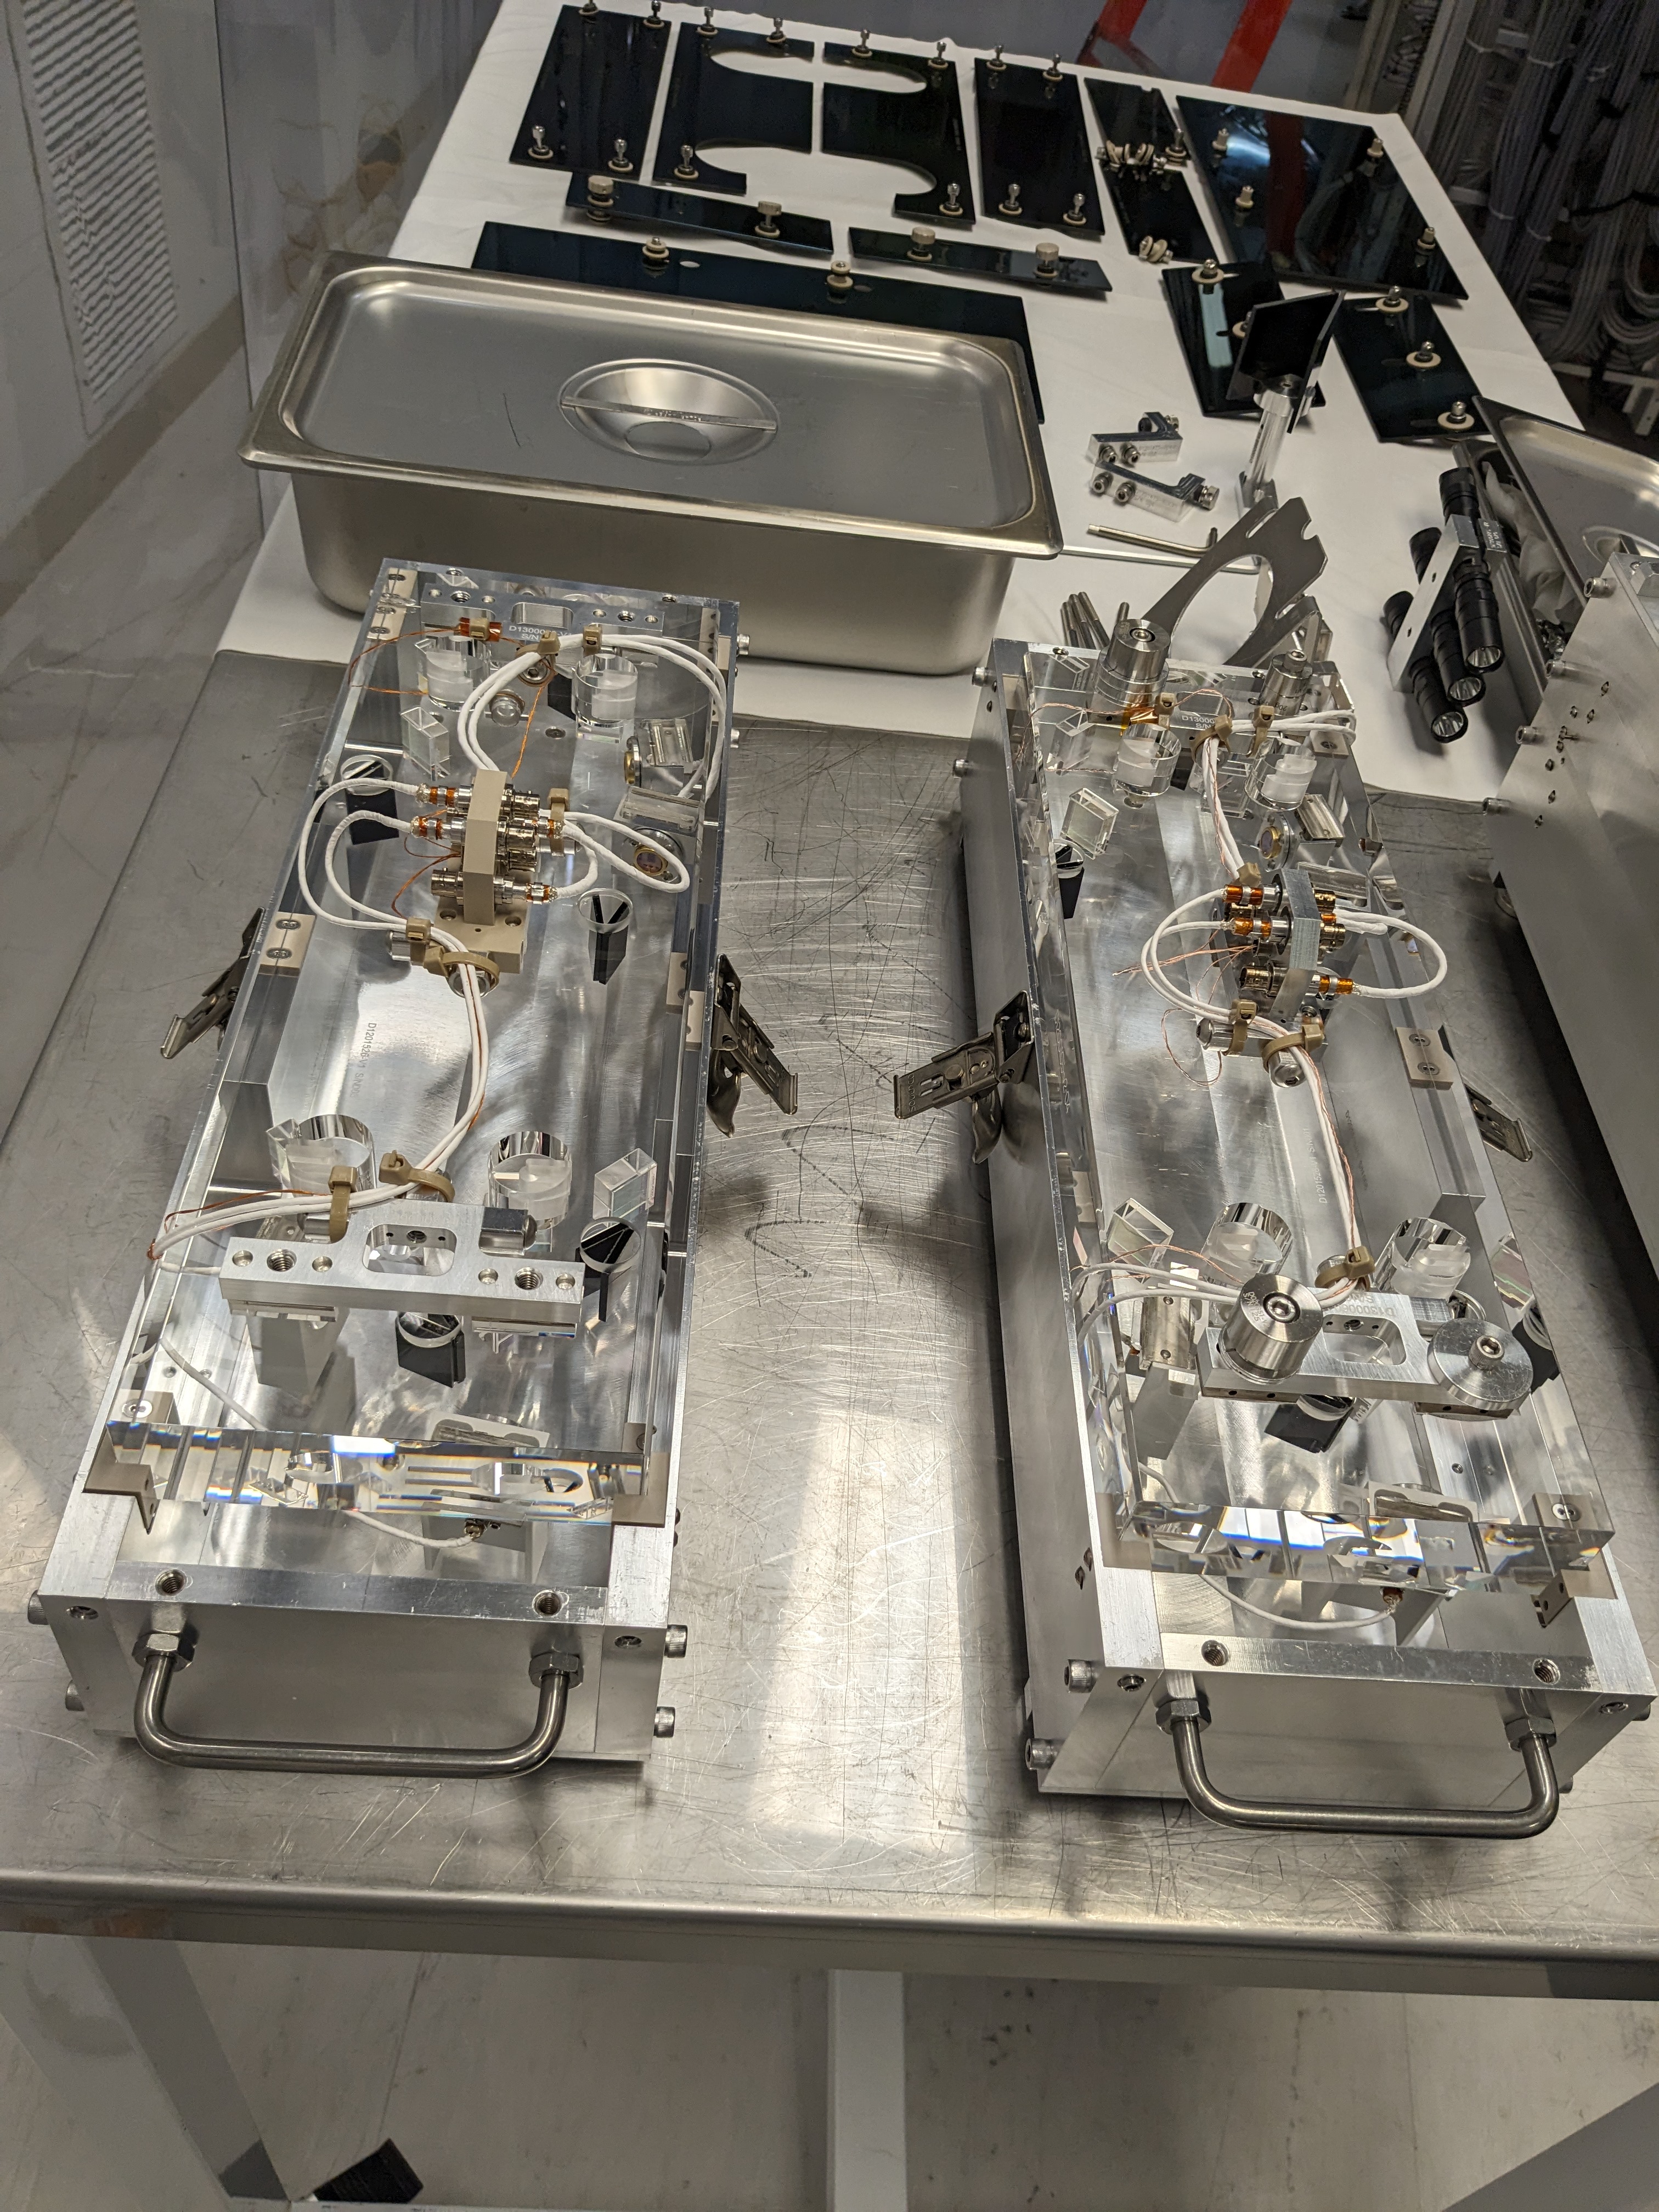
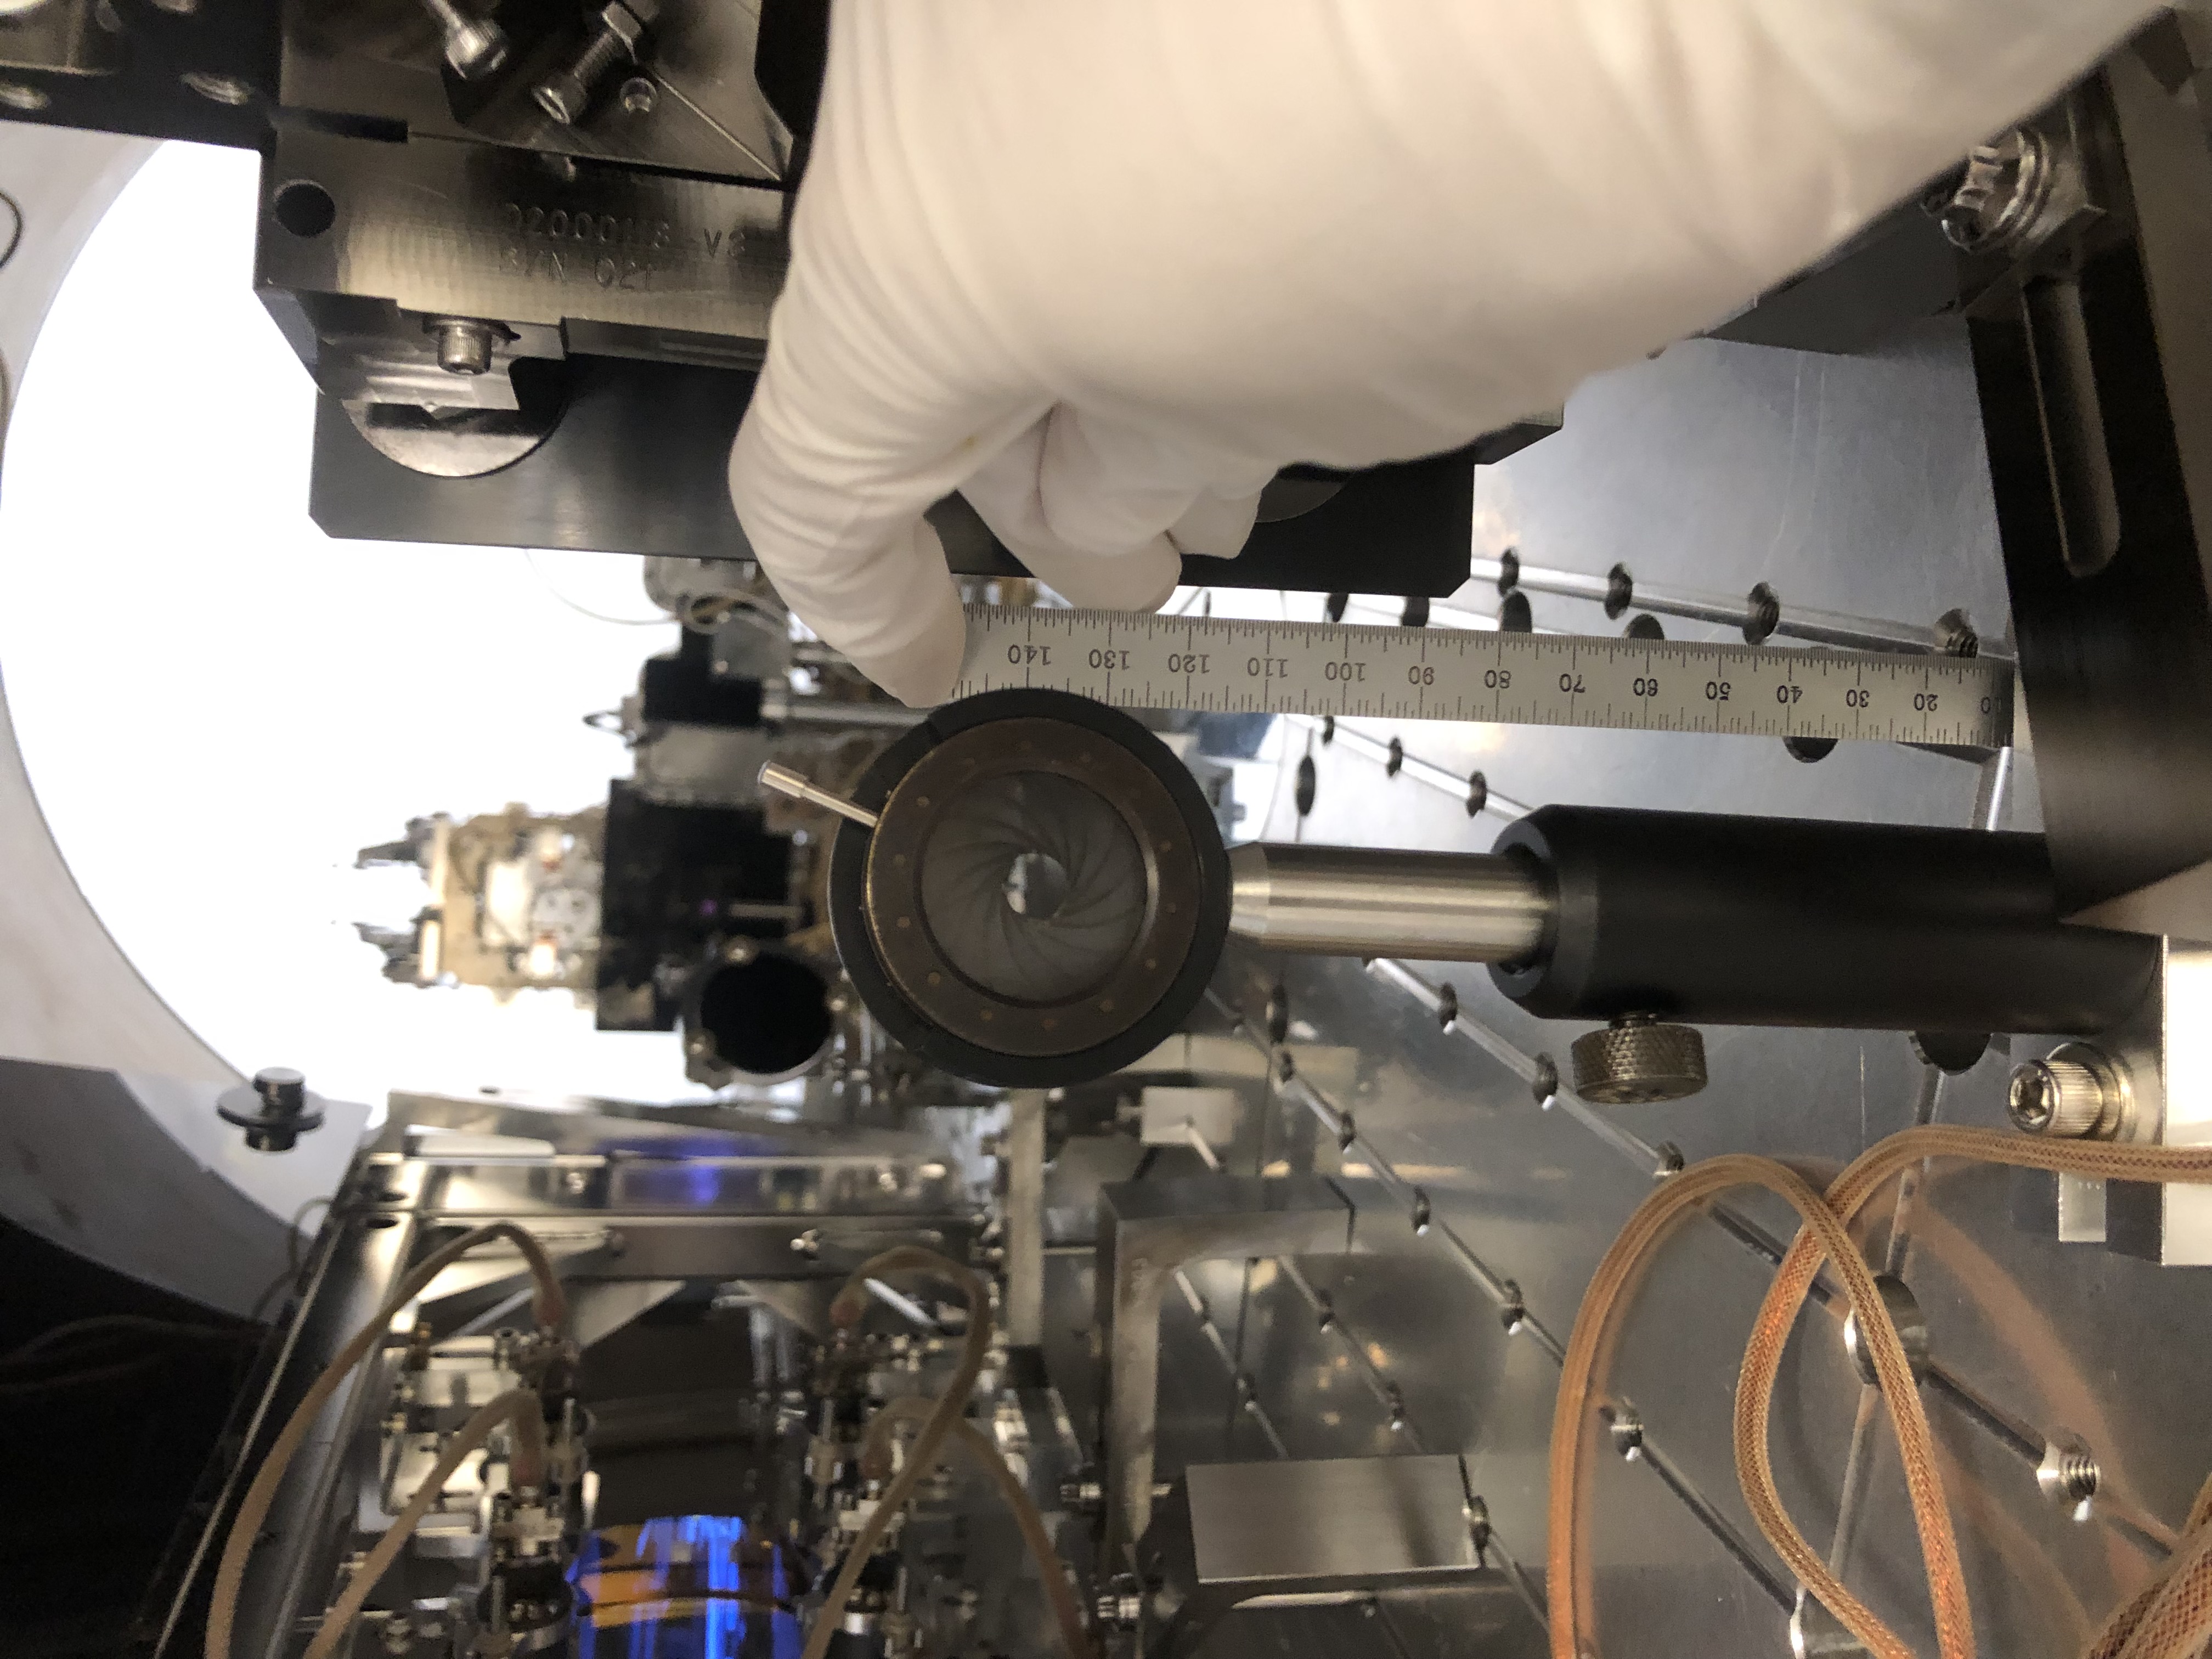
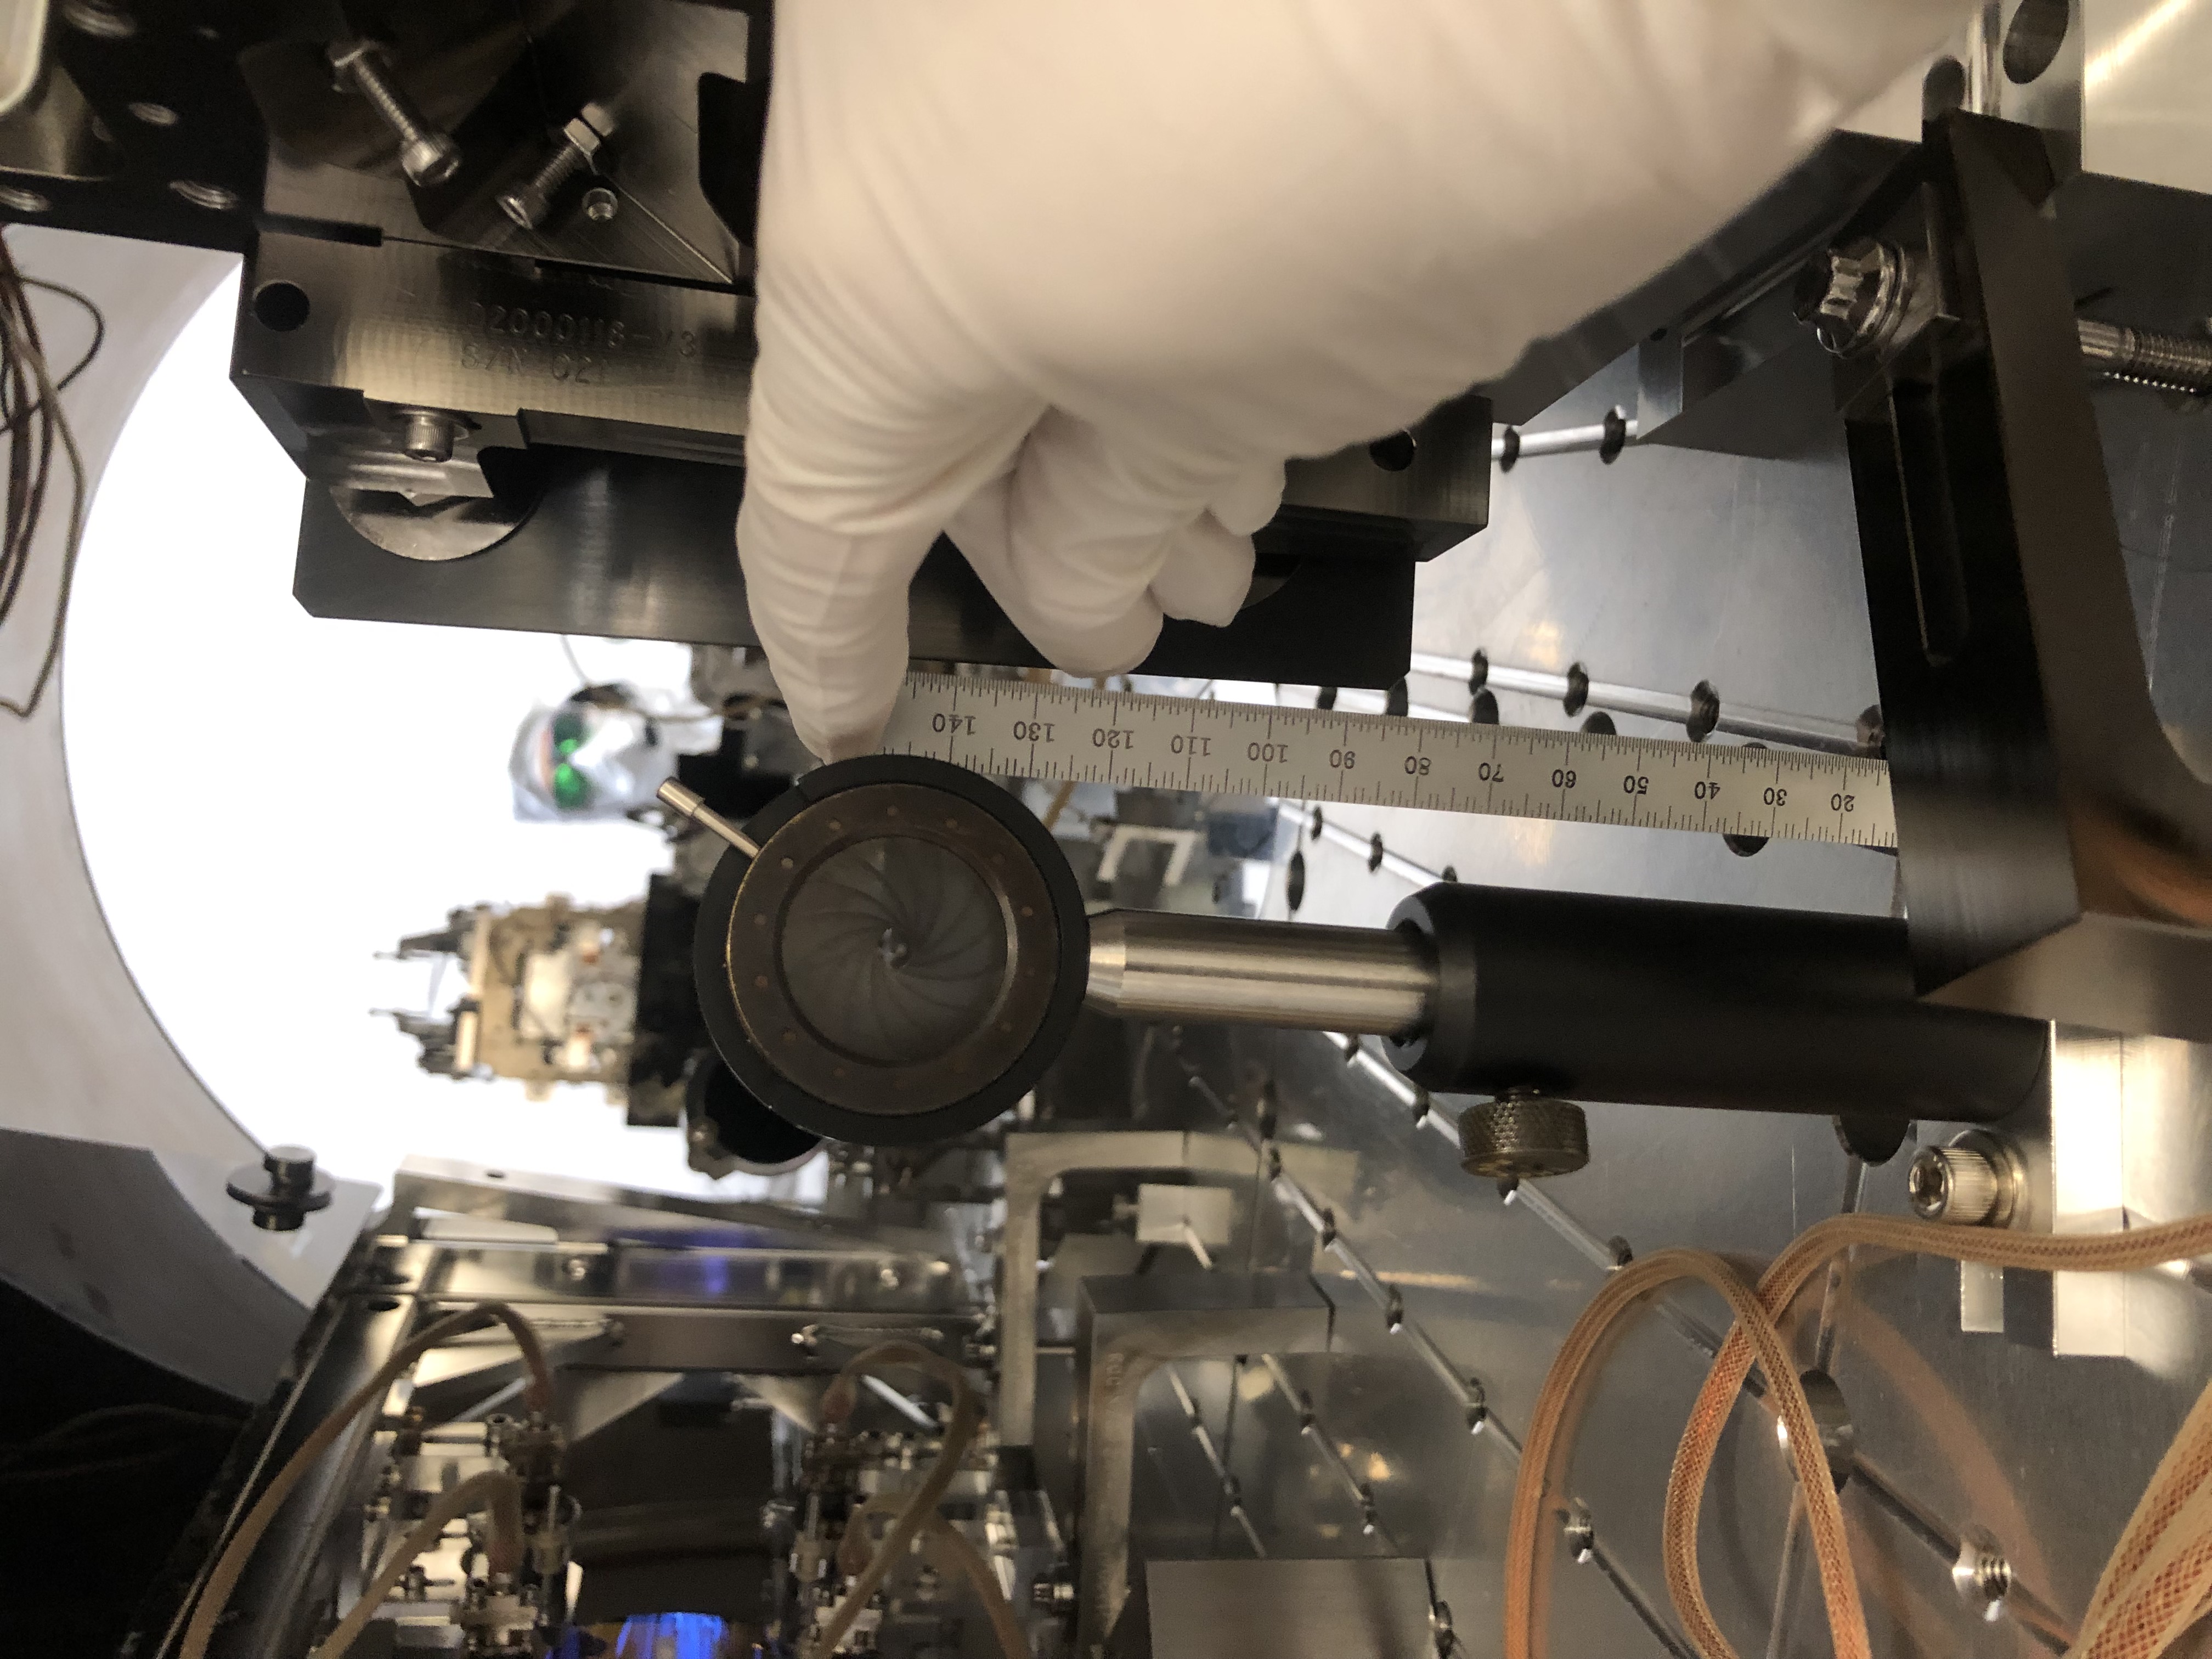
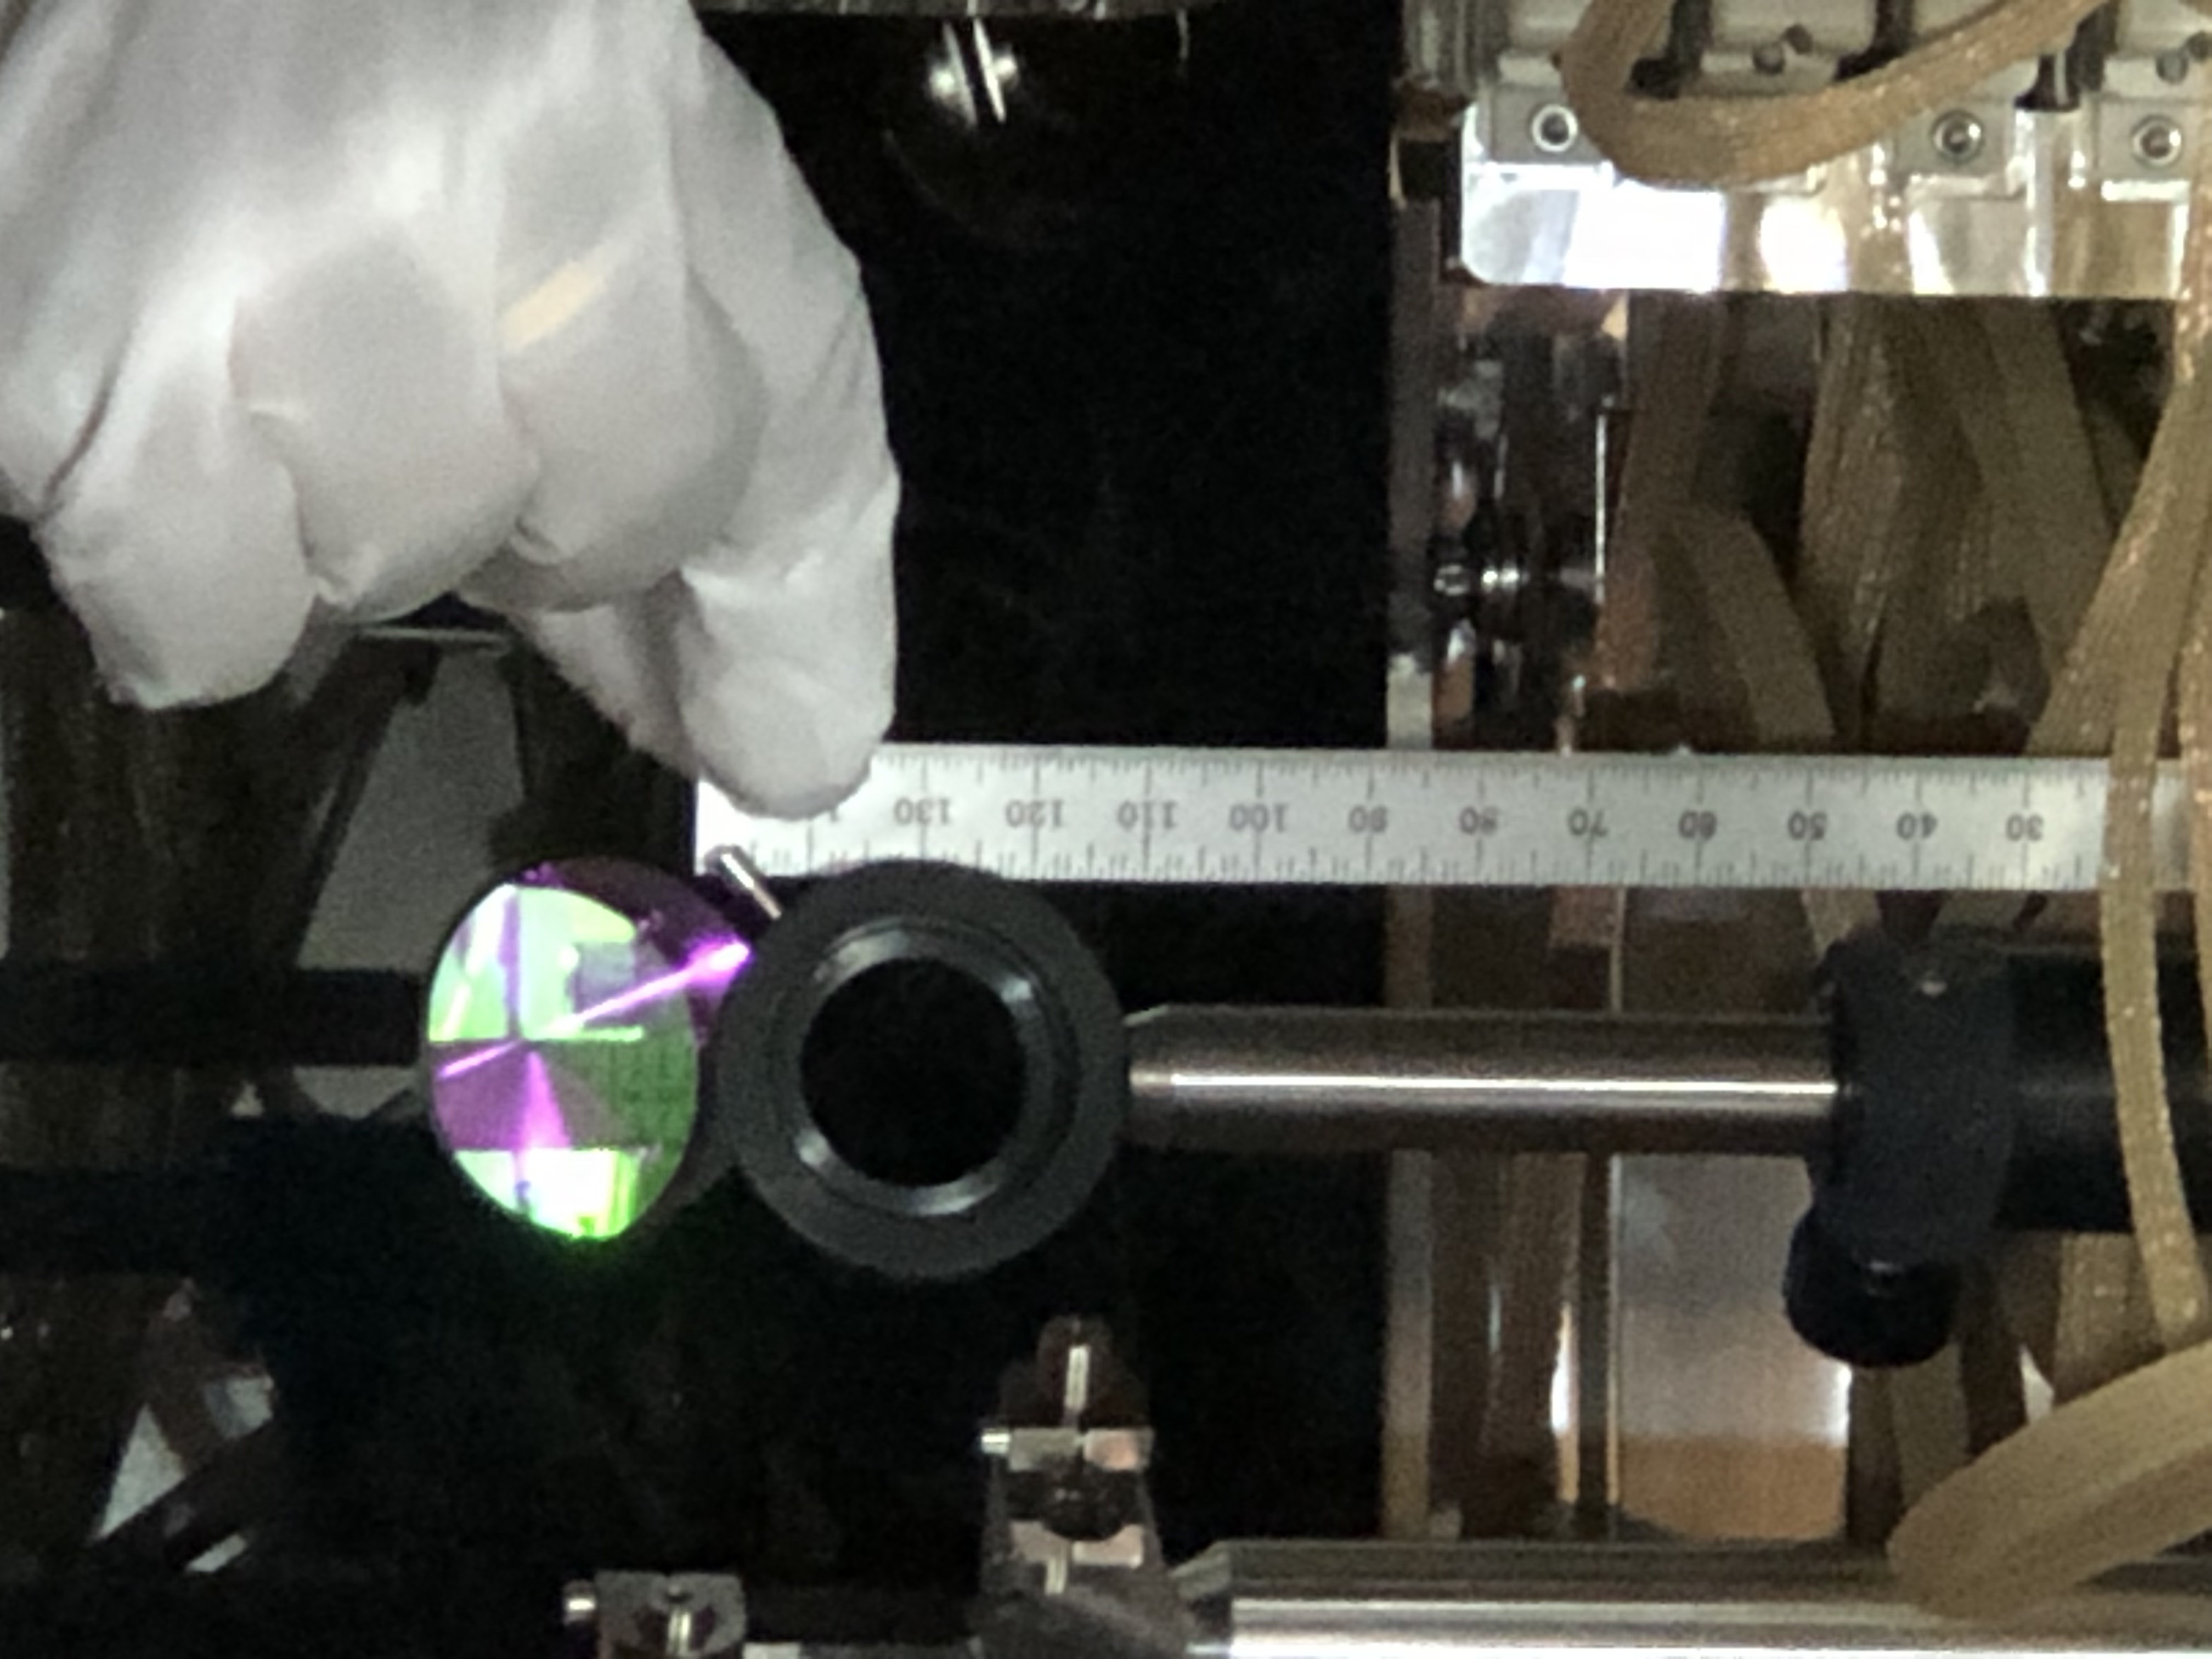
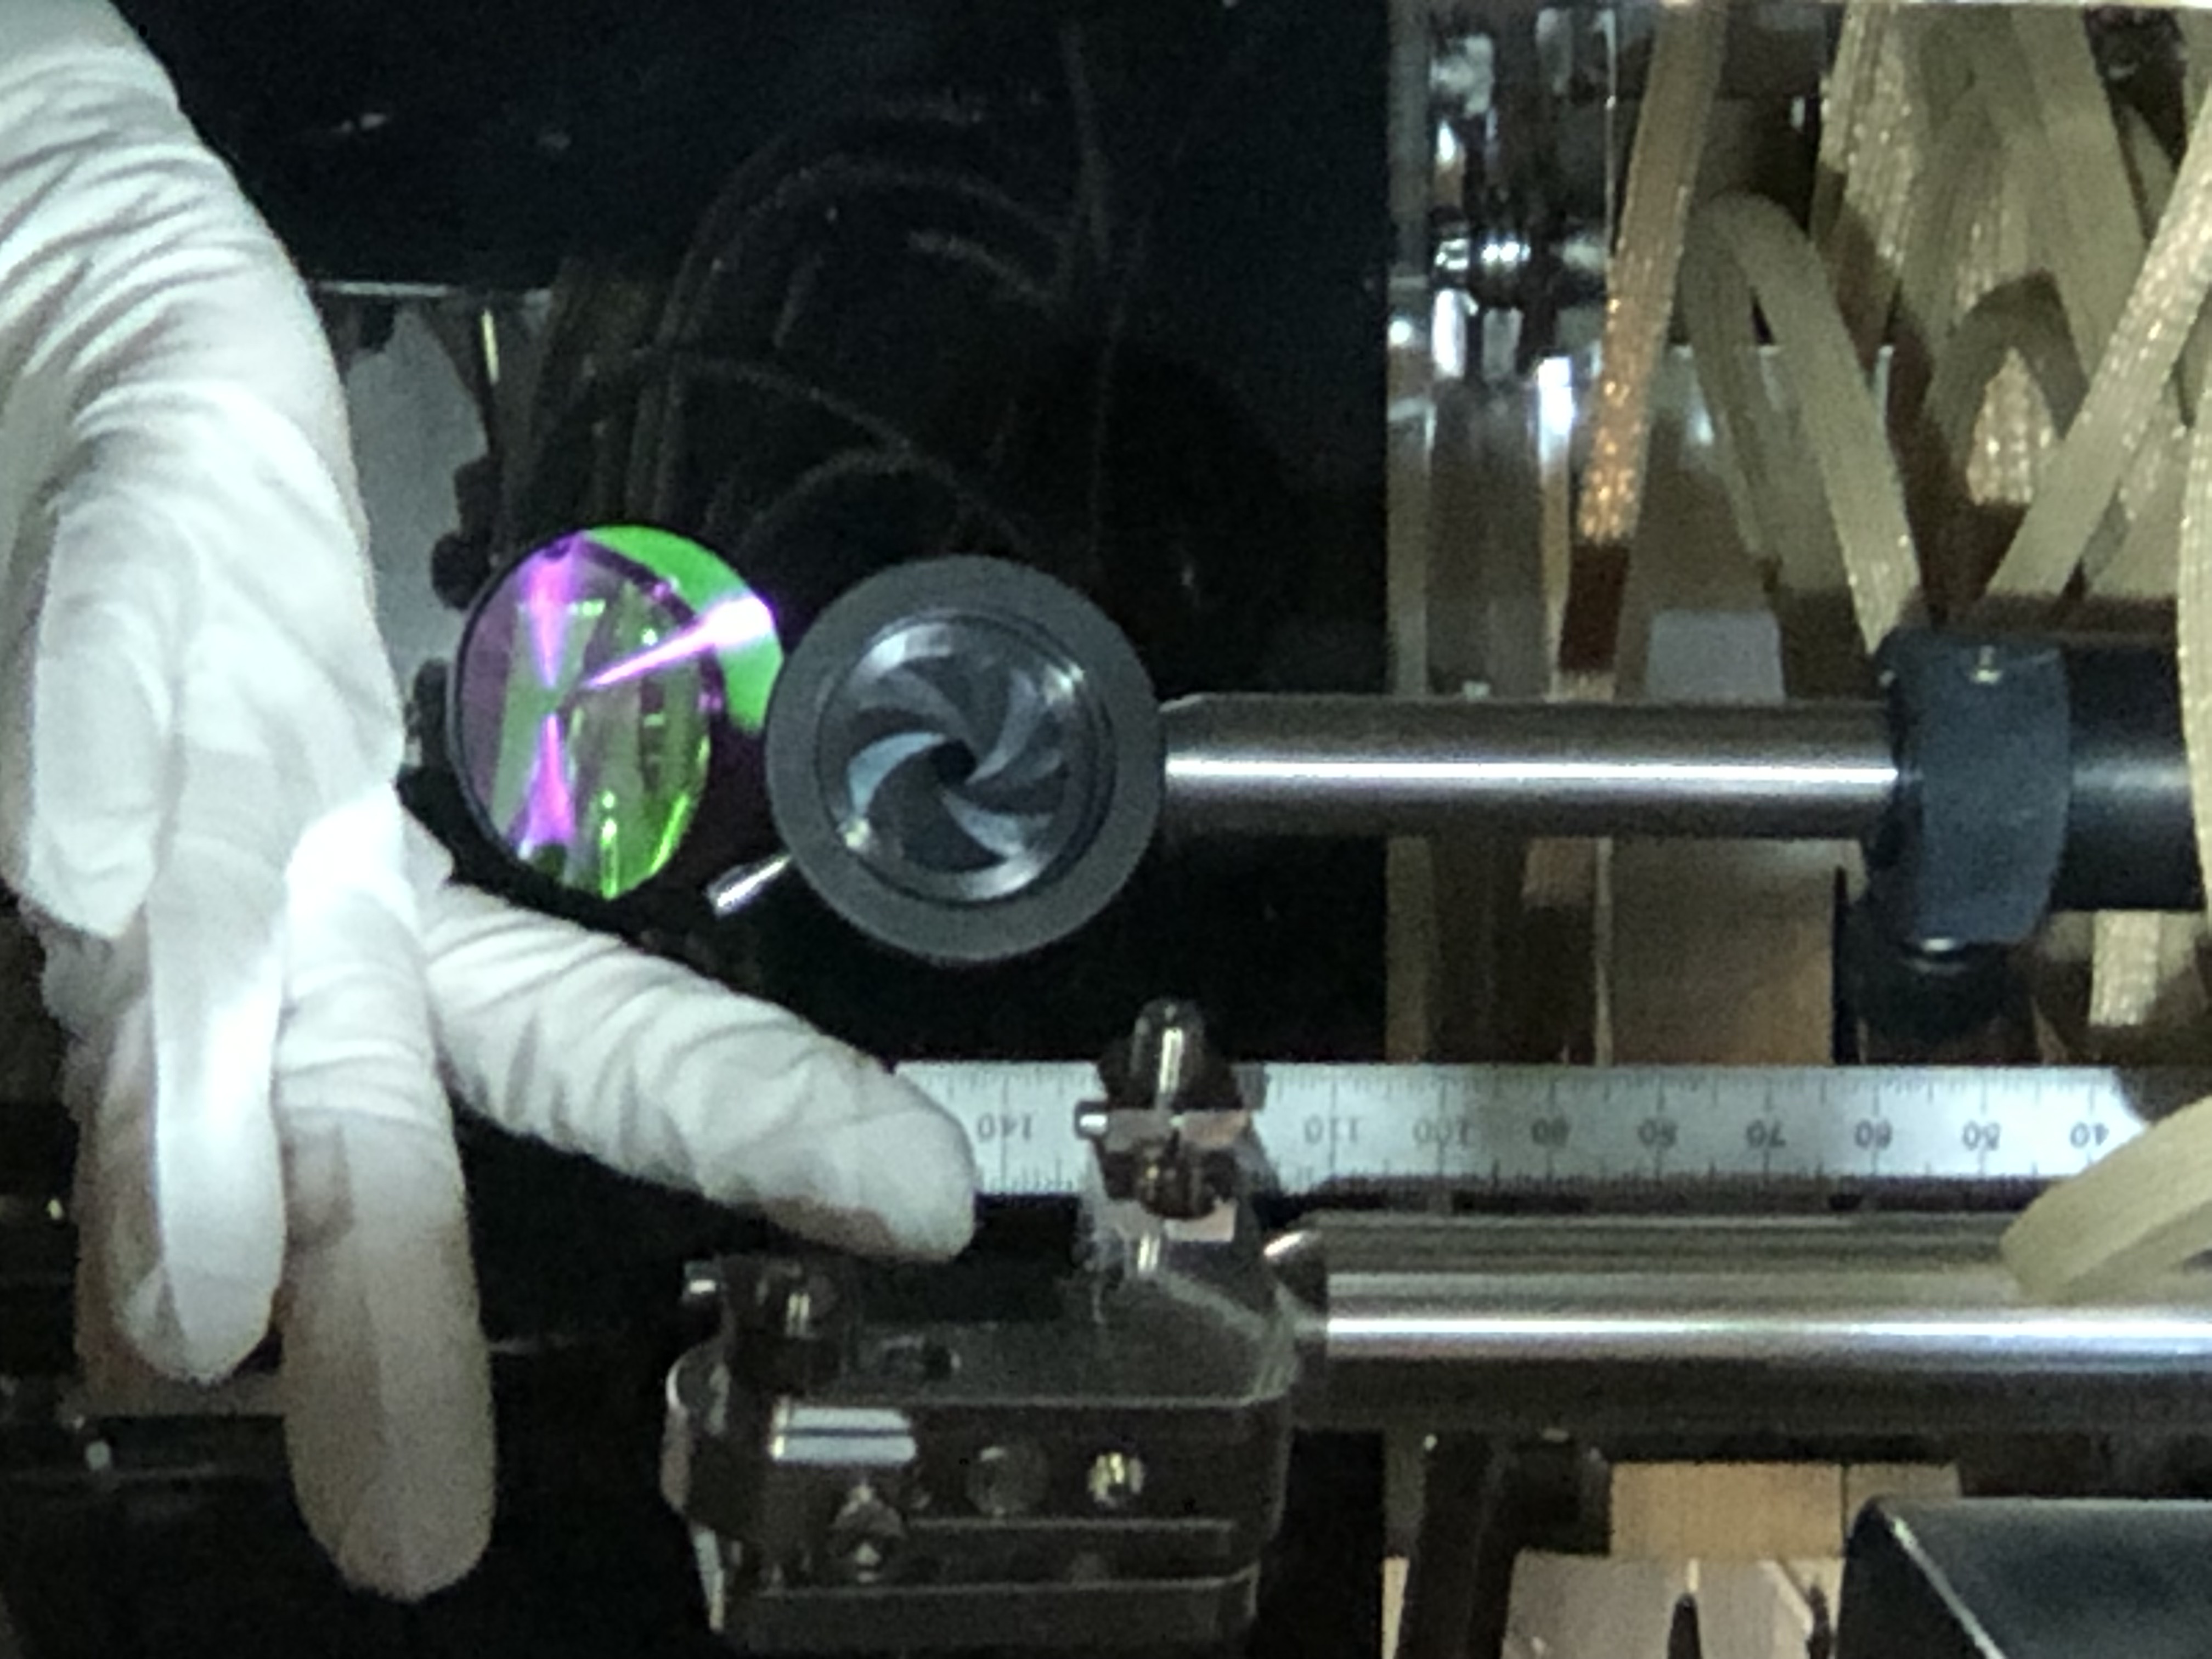
Attached are photos of the mechanical shifting of the irises in HAM7.
For positions see table (measurement is not super precise):
| Iris one | Iris two | |
|---|---|---|
| Old position [mm] | 139 | 130 |
| New position [mm] | 146 | 144 |
Since we offloaded the sliders of ZM4, ZM5 and ZM6, their DAC output is now below 6000 counts, which gives us a healthy range.
ZM4 (both pitch and yaw) and ZM5 (only pitch) were mechanically adjusted in the chamber, hence I took their transfer function measurements and both the suspensions look healthy. Their BOSEMs might need some slight adjustment to re-center the flags.
Also, we need to re-check two other things tomorrow, as listed below:-
- centering of the beam on ZM5 optic since we are not very sure about that.
- centering of the beam on the ZM4, ZM5 baffles.
A few notes to add:
- We moved the HAM7 irises in height only, not in yaw.
- We have been running with ZM6 DAC close to saturated for most of O4a. Part of what we did today was to bring ZM6 DAC output to zero and maintain our alignment into HAM6 by moving ZM4/5. (In addition to correcting for the alingment change due to the PSAMs adjustment.)
- Since OM6 was railed with positive pitch, this mostly meant that we moved the beam position up on ZM5. This might be too high, and could cause astigmatism.
- Tomorow morning we plan to measure beam profiles for some different PSAMs settings anyway, this will tell us if the asitmatism is a problem.
- If so, we can undo the pitch offloading that we did this afternoon.
- Then we can finsh HAM7 work and remove the irises.